

Abstract
The Src homology 2 (SH2) and collagen domain protein Shc plays a pivotal role in signaling via tyrosine kinase receptors, including epidermal growth factor receptor (EGFR). Shc binding to phospho-tyrosine residues on activated receptors is mediated by the SH2 and phospho-tyrosine binding (PTB) domains. Subsequent phosphorylation on Tyr-317 within the Shc linker region induces Shc interactions with Grb2-Son of Sevenless that initiate Ras-mitogen-activated protein kinase signaling. We use molecular dynamics simulations of full-length Shc to examine how Tyr-317 phosphorylation controls Shc conformation and interactions with EGFR. Our simulations reveal that Shc tyrosine phosphorylation results in a significant rearrangement of the relative position of its domains, suggesting a key conformational change. Importantly, computational estimations of binding affinities show that EGFR-derived phosphotyrosyl peptides bind with significantly more strength to unphosphorylated than to phosphorylated Shc. Our results unveil what we believe is a novel structural phenomenon, i.e., tyrosine phosphorylation of Shc within its linker region regulates the binding affinity of SH2 and PTB domains for phosphorylated Shc partners, with important implications for signaling dynamics.
Introduction
Adaptor proteins with multiple interaction domains transmit signals from receptor tyrosine kinases (RTKs) and other cell-surface receptors, initiating numerous signaling pathways (1). One of these adaptors is the Src homology 2 (SH2) and collagen domain protein (Shc) that plays a key role in the initiation of the mitogen-activated protein kinase (MAPK) cascade, regulating cell survival, proliferation, and differentiation (2,3). Shc consists of the N-terminal phosphotyrosine-binding (PTB) and C-terminal SH2 domains, which recognize specific phosphotyrosine sites on RTKs and other signaling proteins, such as protein phosphatase 2A (4,5) and the central collagen-homology (CH) linker region (6). Activated RTKs, including epidermal growth factor receptor (EGFR), phosphorylate Shc on Tyr-317 within the CH region. Tyr-317 is a major site for binding the growth factor receptor binding protein 2 (Grb2) adaptor and the Grb2-SOS (Son of Sevenless) complex, which triggers Ras activation (7–9).
Regulatory adaptor proteins, such as Shc, are often regarded much the same way as adaptors for plug-and-play devices. These proteins have a number of modular interaction domains that are organized as “beads on a string” and that recognize specific sequence motifs. At first glance, the Shc modular structure implies that the phosphorylation of residues located outside the specialized binding domains should not affect the structural flexibility and intramolecular motions of these domains to impact binding to phospho-tyrosines on Shc-specific partners. In a previous study, we derived a theoretical model structure of full-length Shc (Protein Data Bank (PDB) identification, 1WCP; Fig. 1), and investigated the dynamic properties of both phosphorylated Shc (pY317-Shc) and unphosphorylated Shc (Y317-Shc), using short-timescale (2-ns) molecular dynamics (MD) simulations (10). We found that Tyr-317 phosphorylation increases Shc structural rigidity and reduces coupling of domain motions between the PTB and SH2 domains, which might alter the Shc binding affinity for phosphorylated RTKs (10).
Figure 1.
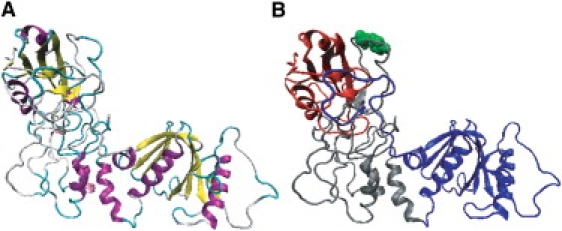
Ribbon diagram of theoretical model structure of Shc. Color assignment corresponds to (A) secondary structures (magenta, α-helix; yellow, β-sheet; cyan, turn; and gray, random structure) and (B) Shc domains (red, SH2 domain; gray, CH domain; and blue, PTB domain). In B, Tyr-317 is highlighted by a space-fill model (green).
Here, we exploit long-timescale (10-ns) MD simulations to analyze the impact of Shc phosphorylation on EGFR-Shc interactions pivotal for the activation of downstream MAPK signaling. Both the PTB and SH2 domains of Shc bind to phosphorylation sites with well-characterized consensus sequences on various RTKs, including EGFR (4). Based on NMR data and homology modeling, we construct model docked structures of the full-length Y317-Shc and pY317-Shc molecules with the EGFR-derived phosphotyrosyl (pY) peptides, corresponding to known sites of Shc binding to EGFR. Several computational techniques to estimate binding free energies of protein-protein or protein-ligand associations were proposed, such as the free energy perturbation (FEP) method (11), molecular mechanics-Poisson/Boltzmann surface area (MM-PBSA) calculations (12), and the linear interaction energy (LIE) method (13–17). Here we combine the LIE method with MD simulations to calculate the binding free energies (and affinities expressed in terms of KD values) of the full-length Y317-Shc and pY317-Shc with each EGFR-derived pY-peptide. We further justify the results of the LIE method by performing thermodynamic integration (TI) simulations of Y317-Shc binding to one of the EGFR-derived pY-peptides. The results for the relative binding free energies from the more rigorous TI simulations match closely with those obtained from the LIE method, justifying the LIE results. Our simulation results revealed that the critical rearrangement of the relative positions of Shc domains induced by Tyr-317 phosphorylation significantly reduces the binding affinities of pY317-Shc for EGFR-derived pY-peptides.
What we believe to be a novel structural phenomenon was revealed by our computational results, i.e., tyrosine phosphorylation of Shc in the linker region bridging two recognition domains dramatically changes the Shc binding function. The calculations imply that this linker-region phosphorylation operates as a molecular switch, causing the disengagement of the Shc adaptor from EGFR. Disruption of the EGFR-Shc complex leads to only transient protection of EGFR against phosphatase activities, and to a transient time course of receptor phosphorylation in response to a constant (growth-factor) stimulus (18). Our findings change the current paradigm of interactions between multidomain proteins, and help assess the functional consequences of signaling events resulting in the phosphorylation of individual residues.
Methods
System setup
We used our theoretical model structure of Y317-Shc (PDB identification, 1WCP; p52 isoform of human Shc) (10) to specify the initial coordinates in MD simulations of full-length Y317-Shc molecules. The theoretical structure of the p52 isoform of human Shc (PDB identification, 1WCP) was modeled using two experimentally determined structures of the PTB and SH2 domains of Shc (PDB accession codes, 1shc and 1tce, respectively). We mapped the target sequence of p52 Shc onto those modeling templates, using integrated sequence tools and structural superposition algorithms of the DeepView (Swiss-PdbViewer) program. Then the sequence alignment was optimized manually and submitted to the Swiss-model server for model building. The resulting protein model (residues 17–474) was improved by performing a 5000-step energy minimization in vacuum, using the molecular operating environment (MOE) program (Chemical Computing Group, Montreal, Quebec, Canada). The final theoretical model structure of the p52 isoform of human Shc was deposited into the PDB (PDB identification, 1WCP). During the deposition of Shc coordinates to the PDB, a rigorous validation of the structure by PROCHECK1 was performed, which included the collection of structural diagnostics such as bond distance and angle comparisons, torsion-angle comparisons, and molecular graphic images.
For MD simulations involving pY317-Shc, the initial structure was obtained by replacing Tyr-317 in the CH region with pTyr, followed by minimizing the energy of the system by treating only the side-chain atoms of the pTyr-317 residue as flexible. To neutralize the net charge of the simulation system, counterions (Na+) were added by using the Leap module in the Amber program package, and the protonation state of all charged residues was set, based on a pH of 7.0. All initial structures were placed at the center of the water sphere in which the water molecules were modeled using the TIP3P 3-point charge model potential (19). The size of the water sphere was chosen so that the distance between every atom in the protein and the boundary of the water droplet was at least 12 Å. Each fully solvated system was energy-minimized using 100 steps of steepest descent, followed by 4900 steps of the conjugate gradient method.
MD simulations
For each system (pY317-Shc and Y317-Shc), we performed five independent MD simulations, starting from the same initial structure with different sets of initial velocities of the atoms, to ensure better conformational sampling. Trajectories were calculated for 10 ns each, and an aggregate of 50 ns was calculated for each system (Fig. 2). All calculations were performed using Amber version 8.0 (20) on a personal computer (Xeon 3.2 GHz), equipped with special-purpose computer boards for MD simulations, i.e., MDGRAPE-3 (21–23). The AMBER2003 molecular mechanical force field (24) was adapted for biomolecular-dynamics simulations, with a time step of integration set to 2 fs. All bond lengths involving hydrogen atoms were constrained to their respective equilibrium values by the SHAKE method (25). All noncovalent interactions, and van der Waals and Coulomb forces and energies, were calculated directly and accurately (i.e., without specifying any cutoff distance), owing to the use of the MDGRAPE-3 architecture. Long-range electrostatics contributions beyond the size of the simulation cell were not considered. We use long-range, nonbonded cutoffs rather than particle-mesh Ewald for computational efficiency in performing dynamics simulations in our 130,000-atom system. The former approach is satisfactory as long as the parameters for cutoff functions are carefully chosen, as was the case here (26).
Figure 2.

Flow-chart diagram of computer simulation steps.
Each analyzed system was gradually heated to 300 K during the first 50 ps, at a heating rate of 6 K/ps. Subsequently, the temperature was maintained at a constant 300 K by applying the thermostat of Berendsen et al. (27), with a coupling time constant of 1.0 ps. During all simulations, water molecules at the boundary of the water droplet were restrained by a soft harmonic potential (with a spring constant of 1.5 kcal/mol · Å2), to prevent their movement away from the protein.
Calculation of the binding free energies
Although FEP and TI calculations offer the most powerful approach to estimating the absolute free energies of ligand (protein)-protein binding, this method has the highest computational cost, and has been limited to small and rigid ligands and single amino-acid mutations (14–16). More recently, FEP was applied to phosphotyrosine peptide binding to the SH2 domain of human Lck (17). However, owing to its computationally intensive nature, the study of a variety of substrates interacting with a receptor system remains intractable. The MM-PBSA method has been widely applied to the prediction of binding free energies, because it involves a relatively smaller computational cost, making it more tractable when exploring or comparing several binding interactions (28–30). This method approximates free energies using the Poisson-Boltzmann continuum representation of a solvent, together with a surface area-dependent term and molecular mechanics energies. However, the MM-PBSA approximation can lead to significant differences between theoretical and experimental free energies, allowing only qualitative comparisons between calculated values and those obtained from experiments (recent performances and applications to peptide-peptide interactions were described elsewhere (28,31–33)). The LIE method combines the advantages of the low computational cost of the MM-PBSA method and the high accuracy of the FEP method. The LIE calculations exploit the electrostatic linear-response approximation to predict the electrostatic contribution to the binding free energy, and an empirical scaling of the intermolecular van der Waals energies to predict the nonpolar contribution to the binding free energy (13). Several successful predictions of binding free energies according to the LIE method were reported (13,34–38).
The LIE method
We considered five EGFR-derived pY-peptides that corresponded to the following known Shc binding sites: 1), the pY992 site, VADADEpYLIPQQ; 2), the pY1086 site, GSVQNPVpYHNQPLN; 3), the pY1114 site, TAVGNPEpYLNTVQ; 4), the pY1148 site, SLDNPDpYQQDFF; and 5), the pY1173 site, TAENAEpYLRVA. The estimation of binding free energies for each of these EGFR-derived pY-peptides and the full-length Y317-Shc or pY317-Shc was performed in two steps. During step 1, we constructed model docked structures for EGFR-derived peptides with Y317-Shc and with pY317-Shc, based on published NMR structures of complexes of the isolated SH2 domain of Shc with the pY-peptide derived from the T-cell receptor (PDB identification, 1TCE), and the isolated PTB domain of Shc with a pY-peptide derived from the TRKA receptor (PDB identification, 1SHC) (39). In step 2, based on the model docked structures obtained in step 1, we calculated binding free energies using the LIE method. We also calculated binding affinities (KD) as follows: KD = exp(ΔG/RT), where ΔG is the binding free energy; R = 1.987 (cal K−1 mol−1), and T = 300 K. Steps 1 and 2 are detailed below.
Step 1 docking
The docking procedure involved aligning and fitting the coordinates of Y317-Shc and pY317-Shc structures and those of the EGFR pY-peptides, respectively, to the coordinates found in the NMR structural complexes of the Shc PTB domain complexed with the TRKA pY-peptide, and those of the Shc SH2 domain complexed with the T-cell pY-peptide (40). In other words, full-length Shc molecules were structurally aligned with either the SH2 domain or PTB domain in the two NMR structural complexes. The coordinates of full-length Y317-Shc and pY317-Shc used in the alignment procedure were obtained from the Y317-Shc and pY317-Shc simulations. In particular, the time-averaged coordinates from trajectory 5 for Y317-Shc (or Y317-Shc_ave5) and the analogous set of coordinates from trajectory 4 of pY317-Shc (or pY317-Shc_ave4) were used in the alignment (see Fig. 2 and Results for details).
When introducing the EGFR-derived pY-peptides and building the complex, amino-acid residues in the pY-peptide templates (i.e., the TRKA pY-peptide in 1SHC or the T-cell pY-peptide in 1TCE) were appropriately modified (i.e., deleted or replaced) with the corresponding sequence of residues in each EGFR-derived pY-peptide. The atoms of side chains were subsequently energy-minimized, and the backbone atoms were held fixed. Using this procedure, we modeled five structural complexes of the full-length Y317-Shc molecule with EGFR pY-peptides: pY992, pY1086, pY1114, pY1148, and pY1173 bound to the PTB domain, and five structural complexes of the full-length Y317-Shc molecule with the same five pY-peptides bound to the SH2 domain. To neutralize the net charge of all systems, counterions were added to the model structures. Because adding counterions to the system leads to a slower convergence of simulations (41), we performed additional 2-ns MD simulations for the five solvated free pY-peptide systems and 25 solvated Shc-pYpeptide complexes, five pYs each for the SH2 and PTB domains of Y317-Shc, and three pYs for PTB and two pYs for SH2 in three distinct conformations of pY317-Shc (Fig. 2), using the same protocol as described above. Trajectories were saved every 10 ps and used in the energy calculations.
Step 2 docking
The binding free energies were calculated for the model docked structures by using the LIE method, according to the following equation (13):
| (1) |
Here, Vele and VvdW in ensemble brackets are the MD averages of the van der Waals energies and electrostatic energies involving the ligand-atoms, respectively, and Δ denotes differences between these averages in the ligand (pY-peptide) bound and free states, calculated from the simulated trajectories. To calculate these energies, we used a cutoff distance of 25.0 Å. α and β are scaling parameters for the van der Waals and electrostatic energies, respectively, and γ is an additional constant to predict absolute binding free energies. Because the binding free energies ΔGbind for the isolated PTB and SH2 domains of Shc and EGFR-derived pY-peptides used in this study were determined experimentally (39), we were able to determine scaling parameters α, β, and γ in Eq. 1 by using the theoretical values Δ〈Vele〉 and Δ〈VvdW〉, calculated for each of the corresponding pY-peptide-Shc domain interactions and the experimental values of ΔGbind. We estimated the constants α, β, and γ by according to a multiple linear regression analysis. Unknown free energies of binding between the full-length pY317-Shc and EGFR-derived pY-peptides were predicted using MD simulations and the same scaling parameters. Here, we assumed that the scaling parameters α and β were transferable across the isolated SH2 and PTB domains as well as the full-length Y317-Shc and pY317-Shc systems. This (and a greater) degree of transferability of the parameters was shown to be appropriate in previous applications of the LIE method (13,34–38).
For each EGFR-derived pY-peptide, we selected its preferred binding domain (SH2 or PTB), based on calculated values for free energies. Only the domain with the lower binding free energy was chosen for further investigation in the pY317-Shc system (Fig. 2). This analysis showed that the PTB domain is the preferred domain for pY1086, pY1114, and pY1148, whereas the SH2 domain binds better to he pY992 and pY1173 sites. This observation is consistent with the experimental data reported by Zhou et al. (39). Thus, in further analyses, we only considered the three modeled structures of the full-length pY317-Shc molecule bound with each of three pY-peptides (pY1086, pY1114, and pY1148) to the Shc PTB domain, and the two modeled structures of pY317-Shc bound with each of two pY-peptides (pY992 and pY1173) to the Shc SH2 domain (Fig. 2). The model docked structures were solvated, energy-minimized, and equilibrated as described in “System setup” and “MD simulations”.
Thermodynamic integration
To calculate the relative binding free energy of the pY-peptide between unphosphorylated Shc (Y317-Shc) and phosphorylated Shc (pY317-Shc), we used the traditional thermodynamic cycle:
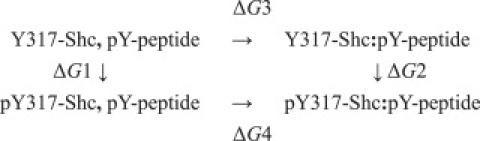
where ΔG1 is the free-energy change as a result of Y317 phosphorylation of Shc in the unbound state, i.e., the EGFR pY-peptide is in solution and not bound to the protein, and ΔG2 is the free energy change as a result of the Y317 phosphorylation of Shc in the bound state. The terms ΔG3 and ΔG4 represent the pY-peptide free energies of binding to the Y317-Shc and pY-317-Shc systems, respectively. The relative binding free energy of the pY-peptide between Y317-Shc and pY317-Shc was calculated as ΔΔG ≡ ΔG3 − ΔG4 = ΔG1 − ΔG2. To compute ΔG1 and ΔG2, we used the TI method (42).
In the TI calculations, the phosphorylation of Y317 (in Shc) was simulated in two alchemical steps: 1), the van der Waals parameters of atoms are gradually increased (or decreased) in 20 steps (windows), increasing the λ-value from 0 to 1; and 2), the partial charges of atoms are gradually increased (or decreased) in seven steps (windows), increasing λ from 0 to 1. The system in each window was simulated for 250 ps, and the last 150 ps of data were used for the calculation of 〈∂H/∂λ〉 = dG/dλ. From Gaussian quadrature formulas of higher order, ΔG is approximately calculated as ΔG ≈ ∑wi〈∂H/∂λ〉λi. The combination of wi and λi used in this study is given in Table 4.
Table 4.
Thermodynamic integration data: wi and λi
|
n = 20∗ |
n = 7∗ |
||
|---|---|---|---|
| wi† | λi‡ | wi† | λi‡ |
| 0.00881 | 0.00344 | 0.06474 | 0.02545 |
| 0.02030 | 0.01801 | 0.13985 | 0.12923 |
| 0.03134 | 0.04388 | 0.19092 | 0.29708 |
| 0.04164 | 0.08044 | 0.20898 | 0.50000 |
| 0.05097 | 0.12683 | 0.19092 | 0.70292 |
| 0.05910 | 0.18197 | 0.13985 | 0.87077 |
| 0.06584 | 0.24457 | 0.06474 | 0.97455 |
| 0.07105 | 0.31315 | ||
| 0.07459 | 0.38611 | ||
| 0.07638 | 0.46174 | ||
| 0.07638 | 0.53826 | ||
| 0.07459 | 0.61389 | ||
| 0.07105 | 0.68685 | ||
| 0.06584 | 0.75543 | ||
| 0.05910 | 0.81803 | ||
| 0.05097 | 0.87317 | ||
| 0.04164 | 0.91956 | ||
| 0.03134 | 0.95612 | ||
| 0.02030 | 0.98199 | ||
| 0.00881 | 0.99656 | ||
Number of windows in integration.
wi values are calculated from Eq. 14 in Hummer and Szabo (53).
λi values are derived from the solutions of Legendre's polynomial.
In the TI simulations, a time step of integration of 0.5 fs with no constraints on bond lengths was used. To assess the statistical error further, we also performed reverse simulations where the pY317 of Shc was mutated to Y317. For estimation of errors, the trajectories (the last 150 ps) were divided into five blocks, and an average ΔG was calculated for each block.
For the TI calculations, we prepared three different conformations (A, B, and C), corresponding to the initial (λ = 0) and final (λ = 1) states. System A corresponds to unphosphorylated Shc (bound or unbound to the EGFR pY-peptide), wherein the partial charges and van der Waals radii of the atoms of the phosphate moiety are set at zero. System B involves quasiphosphorylated Shc (bound and unbound to the EGFR pY-peptide), wherein the partial charges of dummy atoms of the phosphate moiety are set at zero. System C involves phosphorylated Shc (bound and unbound to the pY-peptide). The three systems were fully solvated and energy-minimized, and were equilibrated through protocols similar to those described in System Setup and Molecular Dynamics. The equilibrated structures of A, B, and C were used as the initial and final states for TI calculations. These protocols were also used in our earlier study (43). The results of TI computations are reported in Tables 4 and 5.
Table 5.
Free energy changes as a result of Y317 phosphorylation of Shc in the bound state and in the solution estimated from TI simulations (kcal/mol)
| Forward integration | Reverse integration | Average | |
|---|---|---|---|
| In bound state | −436.715 ± 0.812 | 438.566 ± 0.750 | −437.641 ± 0.781 |
| In unbound solution | −439.122 ± 0.719 | 440.028 ± 0.665 | −439.575 ± 0.692 |
Results
Molecular dynamics
For each system (Y317-Shc and pY317-Shc), we performed five independent MD simulations to explore the vast conformational space and investigate the effects of Tyr-317 phosphorylation on Shc protein dynamics and Shc interactions (Fig. 2). To elucidate the dynamic properties of unphosphorylated and tyrosine-phosphorylated Shc, for each system (Y317-Shc and pY317-Shc), the five MD trajectories were combined into one and then subjected to principal component analysis (PCA). Such analyses project the dynamics captured in the trajectories onto a reduced dimensionality, and help distill the slow modes captured in the trajectories. Here we extracted the first two principal components (PCs) describing collective motions of the combined trajectory for each of the two systems. The cumulative contribution of these two PCs to the overall dynamics was > 70%. The individual trajectories of each system were then projected onto the plane formed by the first two PCs, as shown in Fig. 3.
Figure 3.
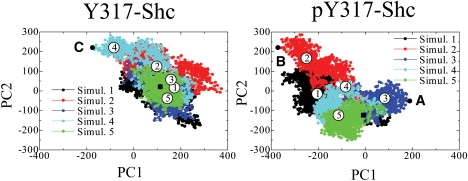
Two-dimensional projections of trajectories obtained from MD simulations for Y317-Shc and pY317-Shc. Five independent simulations 1–5 were performed with same initial structure (black square) but different sets of initial velocities, and were combined into one. Eigen values and vectors were computed for the merged trajectory, which was then subjected to PCA. The x axis shows the first largest principal component (PC1), and the y axis shows the second largest principal component (PC2). For both Y317-Shc and pY317-Shc, simulations 1–5 show the progress of these five independent simulations. The final structures (circled simulation numbers) show the results obtained after 10-ns simulations. Points A and B represent (extrema) conformations of pY317-Shc, farthest from the average structure of simulation 4 along PC1. Point C represents an average conformation of Y317-Shc (i.e., averaged over a distinct cluster of conformations) that is farthest from the time-averaged coordinates of simulation 5 along PC1.
For unphosphorylated Y317-Shc, the final (equilibrated) structures obtained from simulations 1, 2, 3, and 5 (Fig. 3, left) are closely related and similar to one another, whereas the structure obtained from simulation 4 is an apparent outlier on the PC1–PC2 plane (Fig. 3). Thus, simulation trajectories 1, 2, 3, and 5 represent the salient dynamical behavior of unphosphorylated Shc. The time-averaged coordinates of Y317-Shc in simulation 5 (Y317-Shc_ave5) were chosen as a representative structure of unphosphorylated Shc. The differences between final structures obtained in these simulations were caused by changes in the positions of loop regions, but not by changes in the structures or relative positions of domains. For each domain, the averaged root mean-square deviations (RMSDs) between the final structures, averaged over a 5–10-ns period, were as low as 1.21 ± 0.24 Å (Fig. 4). The nature of the dynamics trajectory harvested in simulation 4 is different from the other four simulations, as indicated by the starkly different trace of this trajectory in the PC1–PC2 plane (see Fig. 3). The traces in Fig. 3 indicate that the direction defined by the first principal component (PC1) vector can be taken as the typical dynamics of unphosphorylated Shc. On the PC1 axis, we compared the representative structure, Y317-Shc_ave5, with the average structure that represents the most distant conformational cluster (structure C in Fig. 3) from the average (i.e., Y317-Shc_ave). The comparison showed that although the positions of several loop regions (especially the loop involving Tyr-317 in the CH domain) were different, the structures of all domains and the relative positions of these domains did not change (Figs. 4 and 5). This result demonstrates that the typical dynamics of the Y317-Shc are mainly caused by the fluctuation of loops in the CH domain (Fig. 5, gray) and by the coupled motion of the domains, rather than by a positional rearrangement for each domain (when the domain motion is coupled, the relative positions of domains show little change).
Figure 4.
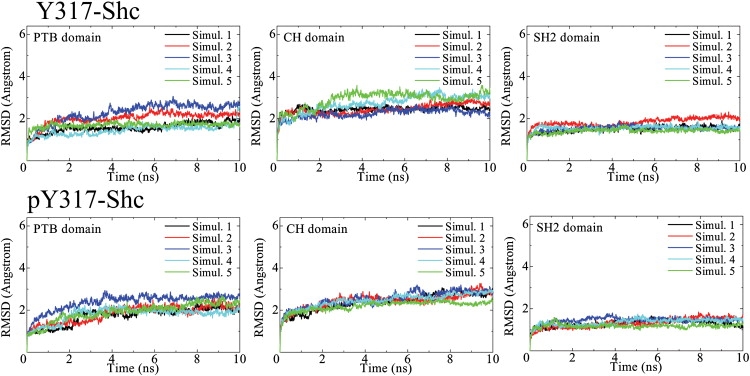
Time-dependent RMSDs of main chain from the initial structure for each Shc domain (PTB, CH, and SH2). Simulations 1–5 indicate the five independent simulations we performed with different sets of initial velocities. RMSDs of targeted structure from the reference structure were calculated after fitting the targeted structure to the reference structure by using the equation (1/N[Σ {Ri − ri}2])1/2, where Ri and ri are positions of main-chain atom i in the target and reference structures, respectively.
Figure 5.
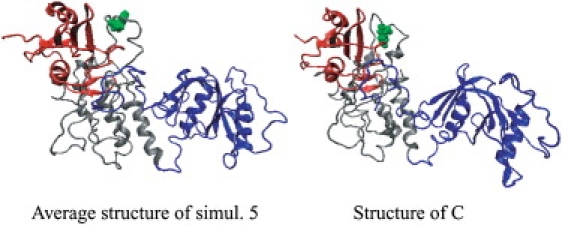
Comparison of representative average structure Y317-Shc_ave5 and structure C (Fig. 3), representing extrema conformations in our trajectories. Tyr-317 is represented by a space-filling model (green). The color of each domain is the same as in Fig. 1.
The nature of the dynamics in the phosphorylated system is depicted (in reduced dimensionality) in Fig. 3 (right). For pY317-Shc, the traces on the PC1–PC2 plane indicate that the final structures are spread widely. As a representative structure of pY317-Shc, the average structure of pY317-Shc simulation 4 (pY317-Shc_ave4), as displayed at the center point on the PC1–PC2 plane, was selected. By comparing the pY317-Shc_ave4 structure with the two most distant structures on the PC1 axis (Fig. 3, structures A and B), we found that in contrast with unphosphorylated Shc, variations in the relative positions of pY317-Shc domains contribute to major differences between these structures (Fig. 6). These results suggest that Tyr-317 phosphorylation brings about substantial rearrangements in the relative positions of Shc domains by reducing their coupling and disrupting coordinated motion of the domains.
Figure 6.
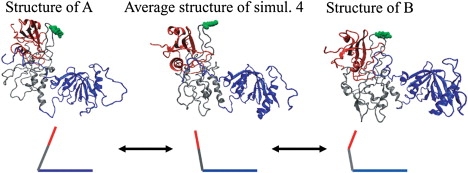
Comparison of representative average structure pY317-Shc_ave4 and structures of extrema conformations A and B (Fig. 3) captured in our simulations. Domain motions are shown schematically below corresponding ribbon diagrams. pTyr-317 is represented by a space-filling model (green). The color of each domain is the same as in Fig. 1.
The conclusions that the domain motion of Y317-Shc is coupled, and that Tyr-317 phosphorylation reduces this coupling of the domain motion, are consistent with our previous results (10). Our simulations (aggregates of 50 ns for each system) are possibly too short to observe a full-scale conformational change of Shc induced by Tyr-317 phosphorylation. Nevertheless, our findings of subtle rearrangements of the relative positions of domains for pY317-Shc are significant when viewed in the context of other proteins, where it is appreciated that changes in relative domain positions are the key dynamic characteristics of conformational changes. Such changes can be induced not only by phosphorylation, but also by ligand-binding (44–46).
Calculations of free energies for Shc binding to EGFR-derived pY-peptides
To investigate the impact of Tyr-317 phosphorylation, the free energies of binding between Shc and five EGFR-derived pY-peptides (pY992, pY1086, pY1114, pY1148, and pY1173) were calculated by applying the LIE method together with MD simulations. In Table 1, we report the calculated and experimental binding free energies and average interaction energies (kcal/mol) between Y317-Shc and EGFR pY-peptides for a test set. The error bars were estimated by dividing the 1 ns of the equilibrated MD trajectory into four blocks (250-ps windows), computing the mean values in each block, and calculating the standard deviation of the mean values from the four blocks (shown in parentheses in Table 1).
Table 1.
Calculated and experimental binding free energies and average interaction energies (kcal/mol) between Y317-Shc and pY-peptides in a test set
| pY-peptide | Y317-Shc∗ |
pY-peptide∗ |
ΔGLIEbind† | ΔGexpbind‡ | ||
|---|---|---|---|---|---|---|
| 〈Vboundele〉 | 〈VboundvdW〉 | 〈Vfreeele〉 | 〈VfreevdW〉 | |||
| pY992 PTB | −1584.680 | −91.294 | −1553.163 | −60.284 | −4.814 (0.321) | −4.3 |
| SH2 | −818.660 | −98.469 | −665.080 | −72.237 | −5.849 (0.386) | −5.3 |
| pY1086 PTB | −1061.417 | −99.823 | −936.448 | −71.041 | −5.808 (0.339) | −7.2 |
| SH2 | −1441.218 | −108.145 | −1414.328 | −77.702 | −4.669 (0.408) | −5.0 |
| pY1114 PTB | −1227.725 | −84.656 | −894.639 | −48.404 | −9.775 (0.441) | −9.4 |
| SH2 | −748.271 | −96.544 | −713.710 | −63.011 | −5.212 (0.390) | −4.9 |
| pY1148 PTB | −476.622 | −139.136 | −287.952 | −92.546 | −9.211 (0.451) | −9.2 |
| SH2 | −461.847 | −106.133 | −428.677 | −78.009 | −4.430 (0.417) | −4.1 |
| pY1173 PTB | −874.030 | −118.241 | −810.219 | −90.750 | −4.770 (0.377) | −4.3 |
| SH2 | −552.377 | −82.338 | −466.415 | −56.517 | −4.844 (0.354) | −5.8 |
Vbound and Vfree are ligand-surrounding energies for ligand-bound and ligand-free states, respectively.
Each 1-ns trajectory (from 1 to 2 ns) was divided into four blocks (250 ps windows), and mean values were calculated for each window. Standard deviations are shown in parentheses.
Experimental values are taken from Zhou et al. (39).
For the docking studies of Y317-Shc with EGFR pY-peptides, we used the representative structure Y317-Shc_ave5. As an illustration, the docked structures of the unphosphorylated Y317-Shc/pY1086 complex, for which the free energies were evaluated, are shown in Fig. 7. Although the unphosphorylated system explores a vast conformational space (e.g., compare the structures Y317-Shc_ave5 and C in Fig. 3, left), we chose to evaluate the free energies for the representative docked structure Y317-Shc_ave5. This is because our analysis of domain motion revealed that the two domains underwent coupled or concerted motions, and so the conformations of binding sites for the pY peptides in the SH2 and PTB domains of Y317-Shc are expected not to be altered to a significant extent between the different conformations. However, the scenario for the phosphorylated system is quite different.
Figure 7.
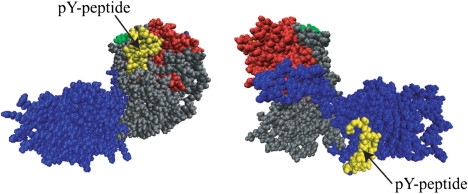
Space-filling models for docked structures of Y317-Shc and EGFR-derived pY-peptide (pY1086) bound to SH2 domain (left) and PTB domain (right). These docked structures were used for calculations of corresponding binding free energies. The pY-peptide and Tyr-317 are colored in green and yellow, respectively. The color of each domain is the same as in Fig. 1.
In the case of the phosphorylated system, because our simulations unveiled large-scale conformational rearrangements of the relative positions of Shc domains after Shc phosphorylation on the Tyr-317 residue, we surmised that the differences in conformations explored in the dynamics of pY317-Shc could potentially affect the free energy of binding. To gauge the sensitivity of the distinct conformations on the calculated values of binding free energy, we evaluated the binding free energies for different template structures. For the docking studies with pY-peptides, we used not only the representative pY317-Shc_ave4 structure, but also structures A and B (Figs. 5 and 6) of pY317-Shc, representing extrema in terms of conformational fluctuations (Fig. 3).
The binding free energies for the PTB and SH2 domains of Y317-Shc and the five EGFR pY-peptides were determined experimentally (40), which allowed us to use these systems as a test set to verify the applicability to our systems of the linear correlation upon which the LIE methodology is based, and to determine the scaling parameters α, β, and γ (see Methods). We found that the values α = 0.141, β = 0.014m and γ = 0.0 provide excellent agreement with the experimental data, with a correlation coefficient of 0.89 (Fig. 8 and Table 1).
Figure 8.

Comparison of experimental and calculated free energies of binding between Y317-Shc and EGFR-derived pY-peptides.
The scaling parameters for electrostatic energy, β, were very small compared with those reported by other groups (β ≈ 0.5) (13,34–38). This difference can be rationalized by the notion that the values of scaling parameters should depend on the nature and size of a ligand, i.e., whether it is a small molecule inhibitor or a protein, the hydrophobicity of the ligand, and the wideness of the contact surface area between receptor and ligand. The pY-peptides have wider contact surfaces at the binding interface with both the PTB and SH2 domains in Shc (Fig. 9) than the typical ligands considered in previous studies using the LIE method (38). This characteristic of a wider molecular surface area at the binding interface is evident for both Y317-Shc and pY317-Shc, justifying our rationale that these two systems are governed by the same set of scaling parameters.
Figure 9.
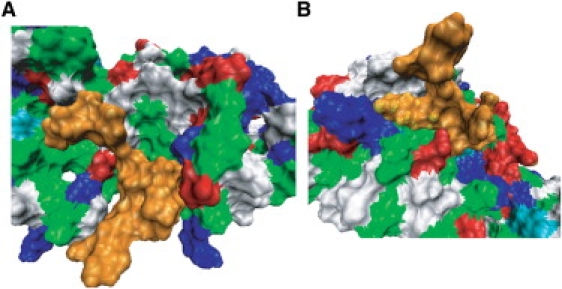
Intermolecular contact surfaces between Shc PTB domain and pY1114 (A), and Shc SH2 domain and pY1173 (B), represented in terms of their molecular surface. The averaged structure (during 1–2-ns period) obtained from 2-ns MD simulation is shown in each panel. pY-peptides are colored orange. Acidic and basic residues are colored red and blue, respectively. Nonpolar and polar residues are colored green and white, respectively.
Notably, although the value of β that was determined to provide the best correlation between calculated and experimental binding free energies is small, this finding does not imply that the van der Waals contributions override the electrostatics contributions. An examination of Table 1 reveals that the dominating contribution in the lower of the calculated binding free energies of each pY peptide binding to either the SH2 or to PTB domains in Y317 Shc comes in some cases from van der Waals (e.g., pY992), and in other cases from electrostatics (e.g., pY1114). Irrespective of the dominant contributor, the tighter binding scenario of a particular pY-peptide to either SH2 or PTB as predicted by our calculations, in all cases we have considered (for Y317-Shc), matches the experimental trends. This provides strong validation that our methodologies of using docking, dynamics simulation, and the calculation of binding free energies can provide a reliable framework for comparing such trends between the Y317-Shc and pY317-Shc systems.
The calculated free energies of binding between full-length pY317-Shc and EGFR pY-peptides are listed in Table 2. For each system reported in Table 2, 1 ns of the equilibrated MD trajectory was divided into four blocks (250-ps windows), and the block mean values were calculated for each window. The standard deviations of mean values from the four blocks are shown in parentheses. The binding affinities (KD) of EGFR pY-peptides for full-length Y317-Shc and full-length pY317-Shc are compared in Table 3. These KD values were computed using binding free energies from Tables 1 and 2, along with the standard deviations. Remarkably, in all cases, the binding affinities of pY-peptides declined upon Tyr-317 phosphorylation. The p values calculated by Student's t test (Table 3) demonstrate that the differences between Y317-Shc and pY317-Shc binding affinities are statistically significant (p < 0.01). These results corroborate our hypothesis that Shc tyrosine phosphorylation diminishes its affinity for EGFR, and strengthen a general view that after phosphorylation, a signaling protein has the potential to alter the binding affinity to its partner systematically in intracellular-signal transduction.
Table 2.
Calculated binding free energies between pY317-Shc and pY-peptides
| pY0992 | pY1086 | pY1114 | pY1148 | pY1173 | |
|---|---|---|---|---|---|
| pY317-Shc_ave4 | −3.401 (0.412) | −6.526 (0.545) | −9.544 (0.712) | −9.228 (0.698) | −4.370 (0.488) |
| Structure A | −5.735 (0.500) | −4.490 (0.462) | −6.608 (0.579) | −7.755 (0.613) | −4.836 (0.489) |
| Structure B | −3.590 (0.448) | −3.712 (0.431) | −5.701 (0.522) | −7.806 (0.636) | −2.105 (0.395) |
| Average | −4.381 (0.456) | −4.955 (0.441) | −7.201 (0.560) | −8.331 (0.604) | −3.800 (0.411) |
| Binding domain | SH2 | PTB | PTB | PTB | SH2 |
All values are in kcal/mol. Each 1-ns trajectory (from 1 to 2 ns) was divided into four blocks (250-ps windows), and mean values were calculated for each window. Standard deviations are shown in parentheses.
Table 3.
Comparison of calculated KD values for binding of pY-peptides to Y317-Shc or pY317-Shc
| Shc | pY0992 | pY1086 | pY1114 | pY1148 | pY1173 |
|---|---|---|---|---|---|
| Y317 | 54.840 (10.521) | 58.744 (9.711) | 0.076 (0.017) | 0.192 (0.045) | 295.953 (118.055) |
| pY317 | 643.444 (150.634) | 245.675 (55.215) | 5.678 (1.727) | 0.853 (0.288) | 1705.140 (352.179) |
| p values | 0.001∗ | 0.002∗ | 0.002∗ | 0.009∗ | 0.001∗ |
| Binding domain | SH2 | PTB | PTB | PTB | SH2 |
KD values (in μM) were calculated as KD = exp(ΔG/RT), where ΔG represents the binding free energies reported in Tables 1 and 2. R = 1.987 (cal K−1 mol−1), and T = 300 K. Standard deviations are shown in parentheses.
Statistical significance of differences in KD values between Y317-Shc and pY317-Shc was determined by Student's t test. Differences are considered statistically significant at p < 0.01.
Because a central result of this study (i.e., the binding free energy estimations for phosphorylated versus unphosphorylated Shc) is based on the correlation of binding free energy data obtained from our simulations (LIE) and our experiment (Fig. 8), we also performed TI simulations (see Methods) to validate this correlation and, in particular, to check the validity of α and β values. Importantly, TI simulations directly yield the free energy of binding of the EGFR pY-peptide to Y317-Shc, relative to the binding of the same peptide to pY317-Shc, i.e., the ΔΔG. value (see Methods and Table 5). Because TI simulations are computationally intensive, we performed TI simulations only for the case of the EGFR peptide pY1086 binding to the PTB domain of Shc.
We selected a representative structure resulting from the averaged coordinates of simulation 5 for the Y317-Shc system (Figs. 3 and 5). Because the conformational changes in Shc induced by Y317 phosphorylation could not be captured in our TI simulations (performed using 250-ps MD trajectories for each window; see Methods), the conformation of pY317-Shc was found to be similar to the conformation labeled pY317-Shc_ave4 in Figs. 3 and 6.
From the LIE simulations, the binding free energy of pY1086 with pY317-Shc relative to that with Y317-Shc is ΔΔG = −4.903 − (−6.526) = 1.623 kcal/mol (Tables 2 and 3). For this same system, the ΔΔG computed from TI simulations (Tables 4 and 5) was −437.641 − (−439.575) = 1.934 kcal/mol. Hence, the consistency between the results of the LIE and TI approaches justifies the values of α and β (Eq. 1) used to establish the correlation in Fig. 8.
Discussion
After phosphorylation by cell-surface receptors, adaptor proteins become involved in multiple interactions that propagate extracellular signals to downstream effector pathways. Recent work demonstrated the combinatorial nature of these interactions, which play critical roles in both the diversity and specificity of cellular responses (4,47). For instance, binding of the adaptor protein Shc to activated RTKs and subsequent Shc phosphorylation send a biochemical message to Shc signaling partners that recognize a specific phosphotyrosine motif in the central CH region of Shc. In the classic Ras/extracellular signal-regulated kinase (ERK) activation pathway, phosphorylated Shc bound to the receptor recruits the complex of Grb2 with guanine nucleotide exchange factor Son of Sevenless (SOS) to the plasma membrane where the small GTPase Ras is localized. Thus, activation of the membrane-anchored Ras, which is a gatekeeper for the Raf/mitogen-activated protein kinase (MEK)/ERK cascade, depends critically on whether the complex of phosphorylated Shc with Grb2 and SOS remains bound to a membrane receptor, such as EGFR, or has moved from the plasma membrane into the cell interior (48,49). In the cytoplasm, phosphorylated Shc can be associated with Grb2-SOS, can engage other signaling partners, or may be dephosphorylated by phosphatases. Importantly, in either scenario, Shc dissociated from the receptor does not contribute to Ras activation.
How phosphorylation of an adaptor or enzymatic protein influences its affinity for the receptor is a key question in many signaling pathways. For instance, our kinetic model of the EGFR network predicted that the phosphorylation of Y317 reduces the affinity of Shc for EGFR and facilitates the dissociation of Shc from the receptor, thus terminating signaling to Ras (18). Likewise, a kinetic analysis of experimental data obtained in rat hepatocytes suggests that phosphorylation of the 85-kDa subunit of phosphatidylinositol 3-kinase decreases its affinity for EGFR (50). Here, we addressed the question of whether the phosphorylation of Y317 on full-length p52 Shc reduces its affinity for EGFR. To this end, we used MD simulations, directly calculating the binding free energies of Y317-Shc and pY317-Shc for all EGFR-derived pY-peptides that correspond to Shc binding sites on the receptor tail.
The simulated systems of fully solvated Shc molecules include over 130,000 atoms. To specify the initial atom coordinates, we used our theoretical model structures of full-length Y317-Shc and pY317-Shc derived previously (10). By assigning five different sets of initial velocities of the atoms, we sampled a vast conformational space and calculated the trajectories during 10 ns, resulting in an aggregate of 50 ns for each full-length system. This allowed us to obtain the time-averaged coordinates of atoms that precisely characterized the difference (in structural terms) between phosphorylated and unphosphorylated Shc proteins on this timescale. Importantly, the domains of Y317-Shc always displayed concerted or coupled motions, whereas these domains exhibited large-scale conformational rearrangements for the phosphorylated pY317-Shc protein. These findings allowed us to conjecture that the free energies of binding of these domains to the EGFR-derived pY-peptides would be very different for full-length unphosphorylated and phosphorylated Shc molecules. Through the use of previously published NMR structures and homology modeling, we were able to align structures of EGFR-derived pY-peptides with the binding sites in Y317-Shc and pY317-Shc proteins, to obtain docked structures of protein-pY-peptide complexes. By exploiting the LIE method, we computed how the free energies of Y-peptide-binding to Y317-Shc and pY317-Shc differ. The free energy results were obtained through a careful design and comparison of the LIE method and the TI method. The agreement between the two independent approaches provided an additional check for the consistency of the computed binding free energies.
Our main biological finding is that in all the EGFR pY peptides we have considered, the binding affinities for Shc systematically declined upon Tyr-317 phosphorylation. Importantly, the differences in KD values between Y317-Shc and pY317-Shc were statistically significant for all pY-peptides studied. This result corroborates our hypothesis that Shc tyrosine phosphorylation diminishes its affinity for EGFR.
Our calculations were performed on relatively large systems (over 130,000 atoms) and were made possible by our special-purpose computer for molecular simulation, MDGRAPE-3, which functions with high speed and accuracy (21–23). We constructed a Peta-floating point number operations per second (Peta-flops) system, which is a cluster of personal computers each equipped with MDGRAPE-3, a custom-designed architecture. The Peta-flops system is a powerful computer system not only for long-timescale single MD simulations, but also for massive parallel simulations. Thus, through the use of this technology, the ability to generate aggregate 50-ns dynamics trajectories for large systems enabled us to delineate crucial structural differences in response to molecular signals, e.g., Y317-phosphorylation. Although the 50–100-ns timescale is short for capturing full-scale conformational changes in proteins, the systematic changes captured in the dynamics simulations provide a view at molecular resolution of the possible nature of such a conformational change, and help identify key domain motions that trigger such changes. Because large-scale conformational changes and substrate recognition are key regulatory elements in cellular signaling, predicting the molecular context where such regulation operates is crucial for constructing predictive systems-level models of signal transduction. With the advent of faster computing platforms to perform such dynamics calculations and improved methods for sampling large-scale conformational changes (51,52), the approach we have undertaken can be generalized and extended to other systems, and facilitate the true bridging of structural biology (x-ray crystallography and NMR) and single-molecule methods with studies in cellular signal transduction.
Acknowledgments
We thank Dr. Y. Ohno, Dr. G. Morimoto, and Dr. T. Narumi for the use of MDGRAPE-3. R.R. acknowledges National Science Foundation support through grant CBET-0730955. B.N.K. acknowledges National Institutes of Health support through grants GM059570 and R33HL088283 (a part of the National Heart, Lung, and Blood Institute Exploratory Program in Systems Biology).
References
- 1.Seet B.T., Dikic I., Zhou M.M., Pawson T. Reading protein modifications with interaction domains. Nat. Rev. Mol. Cell Biol. 2006;7:473–483. doi: 10.1038/nrm1960. [DOI] [PubMed] [Google Scholar]
- 2.Pelicci G., Lanfrancone L., Grignani F., McGlade J., Cavallo F. A novel transforming protein (SHC) with an SH2 domain is implicated in mitogenic signal transduction. Cell. 1992;70:93–104. doi: 10.1016/0092-8674(92)90536-l. [DOI] [PubMed] [Google Scholar]
- 3.Plyte S., Majolini M.B., Pacini S., Scarpini F., Bianchini C. Constitutive activation of the Ras/MAP kinase pathway and enhanced TCR signaling by targeting the Shc adaptor to membrane rafts. Oncogene. 2000;19:1529–1537. doi: 10.1038/sj.onc.1203451. [DOI] [PubMed] [Google Scholar]
- 4.Hardy W.R., Li L., Wang Z., Sedy J., Fawcett J. Combinatorial ShcA docking interactions support diversity in tissue morphogenesis. Science. 2007;317:251–256. doi: 10.1126/science.1140114. [DOI] [PMC free article] [PubMed] [Google Scholar]
- 5.Ugi S., Imamura T., Ricketts W., Olefsky J.M. Protein phosphatase 2A forms a molecular complex with Shc and regulates Shc tyrosine phosphorylation and downstream mitogenic signaling. Mol. Cell. Biol. 2002;22:2375–2387. doi: 10.1128/MCB.22.7.2375-2387.2002. [DOI] [PMC free article] [PubMed] [Google Scholar]
- 6.Ravichandran K.S. Signaling via Shc family adapter proteins. Oncogene. 2001;20:6322–6330. doi: 10.1038/sj.onc.1204776. [DOI] [PubMed] [Google Scholar]
- 7.Guy G.R., Yusoff P., Bangarusamy D., Fong C.W., Wong E.S. Dockers at the crossroads. Cell. Signal. 2002;14:11–20. doi: 10.1016/s0898-6568(01)00227-3. [DOI] [PubMed] [Google Scholar]
- 8.Pelicci G., Dente L., De Giuseppe A., Verducci-Galletti B., Giuli S. A family of Shc related proteins with conserved PTB, CH1 and SH2 regions. Oncogene. 1996;13:633–641. [PubMed] [Google Scholar]
- 9.Salcini A.E., McGlade J., Pelicci G., Nicoletti I., Pawson T. Formation of Shc-Grb2 complexes is necessary to induce neoplastic transformation by overexpression of Shc proteins. Oncogene. 1994;9:2827–2836. [PubMed] [Google Scholar]
- 10.Suenaga A., Kiyatkin A.B., Hatakeyama M., Futatsugi N., Okimoto N. Tyr-317 phosphorylation increases Shc structural rigidity and reduces coupling of domain motions remote from the phosphorylation site as revealed by molecular dynamics simulations. J. Biol. Chem. 2004;279:4657–4662. doi: 10.1074/jbc.M310598200. [DOI] [PubMed] [Google Scholar]
- 11.Kollman P.A. Free energy calculations: application to chemical and biochemical phenomena. Chem. Rev. 1993;93:2395–2417. [Google Scholar]
- 12.Srinivasan J., Cheatham T.E.I., Cieplak P., Kollman P.A., Case D.A. Continuum solvent studies of the stability of DNA, RNA, and phosphoramidate-DNA helices. J. Am. Chem. Soc. 1998;120:9401–9409. [Google Scholar]
- 13.Åqvist J., Medina C., Samuelsson J.E. New method for predicting binding-affinity in computer-aided drug design. Protein Eng. 1994;7:385–391. doi: 10.1093/protein/7.3.385. [DOI] [PubMed] [Google Scholar]
- 14.Roux B., Nina M., Pomes R., Smith J.C. Thermodynamic stability of water molecules in the bacteriorhodopsin proton channel: a molecular dynamics free energy perturbation study. Biophys. J. 1996;71:670–681. doi: 10.1016/S0006-3495(96)79267-6. [DOI] [PMC free article] [PubMed] [Google Scholar]
- 15.Hermans J., Wang L. Inclusion of loss of translational and rotational freedom in theoretical estimates of free energies of binding: application to a complex of benzene and mutant T4 lysozyme. J. Am. Chem. Soc. 1997;119:2707–2714. [Google Scholar]
- 16.Boresch S., Tettinger F., Leitgeb M., Karplus M. Absolute binding free energies: a quantitative approach for their calculation. J. Phys. Chem. B. 2003;107:9535–9551. [Google Scholar]
- 17.Woo H.J., Roux B. Chemical theory and computation special feature: calculation of absolute protein-protein binding free energy from computer simulations. Proc. Natl. Acad. Sci. USA. 2005;102:6825–6830. doi: 10.1073/pnas.0409005102. [DOI] [PMC free article] [PubMed] [Google Scholar]
- 18.Kholodenko B.N., Demin O.V., Moehren G., Hoek J.B. Quantification of short term signaling by the epidermal growth factor receptor. J. Biol. Chem. 1999;274:30169–30181. doi: 10.1074/jbc.274.42.30169. [DOI] [PubMed] [Google Scholar]
- 19.Jorgensen W.L., Chandrasekhar J., Madura J.D., Impey R.W., Klein M.L. Comparison of simple potential functions for simulating liquid water. J. Chem. Phys. 1983;79:926–935. [Google Scholar]
- 20.Case, D. A., T. A. Darden, T. E. I. Cheatham, C. L. Simmerling, J. Wang, et al. 2004. AMBER 8. University of California at San Francisco.
- 21.Narumi, T., Y. Ohno, N. Okimoto, T. Koishi, A. Suenaga, et al. 2006. A 185 Tflops simulation of amyloid-forming peptides from yeast prion Sup35 with the special-purpose computer system MD-GRAPE3. Proc. Supercomputing 2006. (CD-ROM).
- 22.Taiji, M. 2004. MDGRAPE-3 chip: a 165 Gflops application specific LSI for molecular dynamics simulations. Proc. Hot Chips 16. (CD-ROM).
- 23.Taiji, M., T. Narumi, Y. Ohno, N. Futatsugi, A. Suenaga, et al. 2003. Protein explorer: a petaflops special-purpose computer system or molecular dynamics simulations. Proc. Supercomputing 2003. (CD-ROM).
- 24.Duan Y., Wu C., Chowdhury S., Lee M.C., Xiong G. A point-charge force field for molecular mechanics simulations of proteins based on condensed-phase quantum mechanical calculations. J. Comput. Chem. 2003;24:1999–2012. doi: 10.1002/jcc.10349. [DOI] [PubMed] [Google Scholar]
- 25.Ryckeart J.-P., Ciccotti G., Berendsen H.J.C. Numerical integration of the Cartesian equations of motion of a system with constraints: molecular dynamics of n-alkanes. J. Comput. Chem. 1987;23:327–341. [Google Scholar]
- 26.Norberg J., Nilsson L. On the truncation of long-range electrostatic interactions in DNA. Biophys. J. 2000;79:1537–1553. doi: 10.1016/S0006-3495(00)76405-8. [DOI] [PMC free article] [PubMed] [Google Scholar]
- 27.Berendsen H.J.C., Postma J.M.P., van Gunsteren W.F., DiNola A., Haak J.R. Molecular dynamics with coupling to an external bath. J. Comput. Phys. 1984;81:3684–3690. [Google Scholar]
- 28.Suenaga A., Hatakeyama M., Ichikawa M., Xiaomei Y., Futatsugi N. Molecular dynamics, free energy and SPR analyses of the interactions between the SH2 domain of Crb2 and ErbB phosphotyrosyl peptides. Biochemistry. 2003;42:5195–5200. doi: 10.1021/bi034113h. [DOI] [PubMed] [Google Scholar]
- 29.Kollman P.A., Massova I., Reyes C., Kuhn B., Huo S. Calculating structures and free energies of complex molecules: combining molecular mechanics and continuum models. Acc. Chem. Res. 2000;33:889–897. doi: 10.1021/ar000033j. [DOI] [PubMed] [Google Scholar]
- 30.Gohlke H., Case D.A. Converging free energy estimates: MM-PB(GB)SA studies on the protein-protein complex Ras-Raf. J. Comput. Chem. 2004;25:238–250. doi: 10.1002/jcc.10379. [DOI] [PubMed] [Google Scholar]
- 31.Lafont V., Schaefer M., Stote R.H., Altschuh D., Dejaegere A. Protein-protein recognition and interaction hot spots in an antigen-antibody complex: free energy decomposition identifies “efficient amino acids. Proteins. 2007;67:418–434. doi: 10.1002/prot.21259. [DOI] [PubMed] [Google Scholar]
- 32.Strockbine B., Rizzo R.C. Binding of antifusion peptides with HIVgp41 from molecular dynamics simulations: quantitative correlation with experiment. Proteins. 2007;67:630–642. doi: 10.1002/prot.21301. [DOI] [PubMed] [Google Scholar]
- 33.Suenaga A., Takada N., Hatakeyama M., Ichikawa M., Xiaomei Y. Novel mechanism of interaction of p85 subunit of phosphatidylinositol 3-kinase and ErbB3 receptor-derived phosphotyrosyl peptides. J. Biol. Chem. 2005;280:1321–1326. doi: 10.1074/jbc.M410436200. [DOI] [PubMed] [Google Scholar]
- 34.Åqvist J., Luzhkov V.B., Brandsdal B.O. Ligand binding affinities from MD simulations. Acc. Chem. Res. 2002;35:358–365. doi: 10.1021/ar010014p. [DOI] [PubMed] [Google Scholar]
- 35.Hansson T., Marelius J., Åqvist J. Ligand binding affinity predicted by linear interaction energy method. J. Comput. Aided Mol. Des. 1998;12:27–35. doi: 10.1023/a:1007930623000. [DOI] [PubMed] [Google Scholar]
- 36.Wang W., Wang J., Kollman P.A. What determines the van der Waals coefficient β in the LIE (linear interaction energy) method to estimate binding free energies using molecular dynamics simulations? Proteins. 1999;34:395–402. [PubMed] [Google Scholar]
- 37.Brandsdal B.O., Åqvist J., Smalås A.O. Computational analysis of binding of P1 variants to trypsin. Protein Sci. 2001;10:1584–1595. doi: 10.1110/ps.940101. [DOI] [PMC free article] [PubMed] [Google Scholar]
- 38.Almlöf M., Åqvist J., Smalås A.O., Brandsdal B.O. Probing the effect of point mutations at protein-protein interfaces with free energy calculations. Biophys. J. 2006;90:433–442. doi: 10.1529/biophysj.105.073239. [DOI] [PMC free article] [PubMed] [Google Scholar]
- 39.Zhou M.-M., Harlan J.E., Wade W.S., Crosby S., Ravichandran K.S. Binding affinities of tyrosine-phosphorylated peptides to the COOH-terminal SH2 and NH2-terminal phosphotyrosine binding domains of Shc. J. Biol. Chem. 1996;270:31119–31123. doi: 10.1074/jbc.270.52.31119. [DOI] [PubMed] [Google Scholar]
- 40.Zhou M.-M., Meadows R.P., Logan T.M., Yoon H.S., Wade W.S. Solution structure of the Shc SH2 domain complexed with a tyrosine-phosphorylated peptide from the T-cell receptor. Proc. Natl. Acad. Sci. USA. 1995;92:7784–7788. doi: 10.1073/pnas.92.17.7784. [DOI] [PMC free article] [PubMed] [Google Scholar]
- 41.Beveridge D.L., Dicapua F.M. Free energy via molecular simulations: application to chemical and biochemical system. Annu. Rev. Biophys. Biophys. Chem. 1989;18:431–492. doi: 10.1146/annurev.bb.18.060189.002243. [DOI] [PubMed] [Google Scholar]
- 42.Chipot C., Kollman P.A., Pearlman D.A. Alternative approaches to potential of mean force calculations: free energy perturbation versus thermodynamic integration. Case study of some representative nonpolar interactions. J. Comput. Chem. 1996;117:1112–1131. [Google Scholar]
- 43.Suenaga A., Umezu O., Ando T., Yamato I., Murata T. Estimation of ligand binding free energies of F-ATPase by using molecular dynamics/free energy calculation. J. Comput. Chem. Jpn. 2008;7:103–116. [in Japanese] [Google Scholar]
- 44.Hayward S. Identification of specific interactions that drive ligand-induced closure in five enzymes with classic domain movements. J. Mol. Biol. 2004;339:1001–1021. doi: 10.1016/j.jmb.2004.04.004. [DOI] [PubMed] [Google Scholar]
- 45.Silvaggi N.R., Zhang C., Lu Z., Dai J., Dunaway-Mariano D. The x-ray crystal structures of human α-phosphomannomutase 1 reveal the structural basis of congential disorder of glycosylation type 1a. J. Biol. Chem. 2006;281:14918–14926. doi: 10.1074/jbc.M601505200. [DOI] [PubMed] [Google Scholar]
- 46.Wemmer D.E. The energetics of structural change in maltose-binding protein. Proc. Natl. Acad. Sci. USA. 2003;100:12529–12530. doi: 10.1073/pnas.2335923100. [DOI] [PMC free article] [PubMed] [Google Scholar]
- 47.Kiyatkin A., Aksamitiene E., Markevich N.I., Borisov N.M., Hoek J.B. Scaffolding protein Grb2-associated binder 1 sustains epidermal growth factor-induced mitogenic and survival signaling by multiple positive feedback loops. J. Biol. Chem. 2006;281:19925–19938. doi: 10.1074/jbc.M600482200. [DOI] [PMC free article] [PubMed] [Google Scholar]
- 48.Haugh J.M., Lauffenburger D.A. Physical modulation of intracellular signaling processes by locational regulation. Biophys. J. 1997;72:2014–2031. doi: 10.1016/S0006-3495(97)78846-5. [DOI] [PMC free article] [PubMed] [Google Scholar]
- 49.Kholodenko B.N., Hoek J.B., Westerhoff H.V. Why cytoplasmic signalling proteins should be recruited to cell membranes. Trends Cell Biol. 2000;10:173–178. doi: 10.1016/s0962-8924(00)01741-4. [DOI] [PubMed] [Google Scholar]
- 50.Moehren G., Markevich N., Demin O.V., Kiyatkin A.B., Goryanin I. Temperature dependence of the epidermal growth factor receptor signaling network can be accounted for by a kinetic model. Biochemistry. 2002;41:306–320. doi: 10.1021/bi011506c. [DOI] [PubMed] [Google Scholar]
- 51.Cardenas A.E., Elber R. Kinetics of cytochrome C folding: atomically detailed simulations. Proteins. 2003;51:245–257. doi: 10.1002/prot.10349. [DOI] [PubMed] [Google Scholar]
- 52.Radhakrishnan R., Schlick T. Orchestration of cooperative events in DNA synthesis and repair mechanism unraveled by transition path sampling of DNA polymerase beta's closing. Proc. Natl. Acad. Sci. USA. 2004;101:5970–5975. doi: 10.1073/pnas.0308585101. [DOI] [PMC free article] [PubMed] [Google Scholar]
- 53.Hummer G., Szabo A. Calculation of free-energy differences from computer simulations of initial and final states. J. Chem. Phys. 1996;105:2004–2010. [Google Scholar]