

Abstract
We perform single-molecule spatial tracking measurements of a DNA repair protein, the C-terminal domain of Ada (C-Ada) from Escherichia coli, moving on DNA extended by flow. The trajectories of single proteins labeled with a fluorophore are constructed. We analyze single-protein dwell times on DNA for different flow rates and conclude that sliding (with essentially no hopping) is the mechanism of C-Ada motion along stretched DNA. We also analyze the trajectory results with a drift-diffusion Langevin equation approach to elucidate the influence of flow on the protein motion; systematic variation of the flow enables one to estimate the microscopic friction. We integrate the step-size probability distribution to obtain a version of the fluctuation theorem that articulates the relation between the entropy production and consumption under the adjustable drag (i.e., bias) from the flow. This expression allows validation of the Langevin equation description of the motion. Comparison of the rate of sliding with recent computer simulations of DNA repair suggests that C-Ada could conduct its repair function while moving at near the one-dimensional diffusion limit.
Introduction
Cellular DNA is subject to constant exposure to various endogenous and exogenous chemicals that can lead to damage such as base or backbone lesions (1). Repair proteins need to identify such lesions promptly to prevent loss of genetic information and even disease. How DNA repair proteins find lesion sites in an entire genome, or more generally, how DNA binding proteins search along DNA for their target binding sites has long been debated (2). It was first proposed that proteins undergo facilitated diffusion, in which they bind nonspecifically and then undergo one- instead of three-dimensional diffusion (3). Subsequent experimental and theoretical studies further articulated mechanisms for the one-dimensional and three-dimensional motion of various DNA binding proteins (e.g., hopping, sliding, intersegmental transfer, and conformational change of the macromolecules) (2,4–8).
The emergence of high-resolution single-molecule imaging techniques (9–11) creates the opportunity for directly visualizing single DNA binding protein movement along the DNA molecule and validating mechanisms (12–16). Studies of a few DNA binding proteins have demonstrated that they bind nonspecifically to extended DNA molecules and execute a one-dimensional walk along them. In one such experiment, the observation that flow of the solution affected the motion of the restriction endonuclease EcoRV on stretched DNA was taken to indicate that EcoRV explores DNA by both one-dimensional sliding and three-dimensional jumping (16). However, no three-dimensional motion was observed in an analogous measurement on the DNA repair protein hOgg1 (14). The difference in protein function could account for such a discrepancy: i.e., EcoRV cleaves at a specific sequence, whereas hOgg1 repairs an 8-oxoguanine lesion regardless of sequence context. These differences make clear the importance of making measurements that can distinguish sliding from hopping and yield quantitative molecular information for a variety of proteins to assess the generalities of observations and their relations to protein function.
In this study, we show how analysis of the effects of flow in a microfluidic chamber can be used for these purposes. The system that we study is the C-terminal domain of the bacterial DNA repair protein Ada (C-Ada, 19 kD). It repairs alkylated guanine and thymine bases by flipping them into its active site and directly transferring the damaging (i.e., alkyl) groups to a cysteine in an irreversible fashion (1). In addition to being important for elucidating the diffusion mechanisms accessible to thermally driven proteins (e.g., sliding versus hopping), tracking single copies of C-Ada allows one to infer whether the protein flips (unmodified) nucleotides while scanning the sequence for damage. The relation of the results to recent simulation studies and their implications for repair both in vitro and in vivo are discussed.
Methods
For our single-molecule measurements, we label the C-Ada protein (19 kD) on surface-exposed lysine residues by reaction with Cy 3 NHS ester (GE Healthcare, Piscataway, NJ). A gel-based assay shows that the activity of this construct is comparable to that of the unlabeled protein (Supporting Material). Our measurements were performed on an inverted microscope (Olympus IX70; and UPLSAPO 100× NA 1.4 oil immersion objective) by total internal reflection fluorescence microscopy (11). See the Supporting Material for additional details. The fluorescence emission from the Cy3-labeled C-Ada protein was filtered (dichroic mirror, Semrock, Rochester, NY; bandpass filter, Chroma, Rockingham, VT), magnified by a 2× eyepiece, and imaged onto an electron-multiplying CCD array detector (iXon DV887-BI CCD, Andor Technology, South Windsor, CT) with a total of 200× magnification (see the Supporting Material). The microfluidic flow chamber, constructed by sealing polydimethylsiloxane (PDMS) with a glass coverslip, was dilutely coated with streptavidin (Invitrogen, Carlsbad, CA) by incubating the chamber with streptavidin solution (0.02 mg/mL) for ∼15 min. A 1,2-dilauroyl-sn-glycero-3-phosphocholine (DLPC; Avanti, Alabaster, AL) bilayer was then applied onto the coverslip surface by incubating with 1 mg/mL DLPC vesicle solution for ∼1 h (17), followed by ≥2 h incubation with biotinylated λ-DNA. The DNA had been sparsely intercalated with YOYO-1 dye (Invitrogen, Carlsbad, CA) at ∼1:100 dye/bp ratio. We took the contour length of the DNA as 16.2 μm because there was no length increase observed at this low labeling ratio (17). The Cy3-labeled C-Ada protein was flowed at constant volume (PHD 2000 syringe pump, Harvard Apparatus, Holliston, MA) through the chamber with buffer solution (20 mM pH 8.0 Tris, 10 mM NaCl with oxygen-scavenging reagent composed of 0.8 mg/mL glucose oxidase, 0.03 mg/mL catalase, 1% β-mercaptoethanol, and 0.4% glucose) at a concentration of <5 nM. To reduce the complexity of the dynamics and analysis, the average number of proteins on one DNA was reduced to, on average, less than one per frame (achieved at <5 nM protein concentration), thereby avoiding protein-protein collision contributions to the measured transport properties (18). The position of the stretched dye-intercalated DNA was located by 488 nm laser (Coherent, Santa Clara, CA) illumination of YOYO-1. The Cy3-labeled protein moving along the DNA was then imaged using 532-nm laser (Spectra Physics, Mountain View, CA ) excitation of Cy3 within the penetration depth of the evanescent wave. The images were recorded at a rate of ≥20 frames/s. The photons from the Cy3 on each protein were fit to a two-dimensional Gaussian function (DiaTrack 3.0, Semasopht, Chavannes, Switzerland) to determine the centroid.
Results
Data on single C-Ada molecules on DNA were obtained as described in Methods; typical images are shown in Fig. S2 in the Supporting Material. As shown by the superposition of trajectories in Fig. 1 a, the magnitude of DNA fluctuations perpendicular to the flow is small compared with the extent of protein motion along the DNA; as a result, we approximate the latter as one-dimensional. Fig. 1 b shows a representative trajectory in which a protein binds close to the tethered end of the DNA (x = 0 μm) and then moves over almost the entire length within ∼10 s. Flow effects are readily observed in the averaged behavior of single-molecule trajectories shown in Fig. 1 c: the mean-square displacement (MSD) as a function of time deviates from linear, particularly at the higher flow rate. Hence, the flow rate can be varied to serve as an adjustable bias.
Figure 1.

Properties of C-Ada dynamics on λ-DNA. (a) Accumulated single-protein trajectories on the same flow-extended DNA at two different flow rates. The flow is along the +x direction. (Upper image) A plot of 196 protein trajectories on the DNA at 2 μL/min volume flow rate. (Lower image) Plot of 216 protein trajectories on the same DNA at 4 μL/min flow rate. The scale bar is 1 μm. (b) A sample single C-Ada position time series (dots) showing that the protein scans over almost the entire DNA length in 12 s. (c) MSD versus time curve calculated from the two pools of trajectories in a: (+) low flow rate, (○) high flow rate. The MSD is calculated by the internal averaging method for better statistics (30). (d) Step size (x) distribution (+) at t = 0.5 s constructed from the pool of protein trajectories for 2 μL/min (left) and the best Gaussian fit. Analogous histogram and fit for 4 μL/min (○). Peak positions (0.13 μm and 0.48 μm, respectively) are indicated by dashed lines.
We use an overdamped Langevin equation with drift to infer information about C-Ada's one-dimensional biased diffusion on DNA and in turn frictional interactions of the protein with DNA and the solution environment. The equation of motion of the protein on DNA is
| (1) |
Here, α and γ are drag coefficients arising from the viscous fluid flow and interaction between the protein and DNA, respectively, u is the flow rate in the vicinity of the DNA molecule, F(t) is a random force whose distribution is defined by a fluctuation relation, 〈F(t)F(t′)〉 = 2γkTδ(t − t′), k is Boltzmann's constant, and T is temperature. Under the approximation that α ≪ γ and , the equation becomes , and its solution yields a probability density function that describes the distribution of step sizes for the flow-biased walk:
| (2) |
where D = kT/γ is the diffusion constant of the protein. The mean value and variance of this Gaussian distribution provide information about the aforementioned frictional interactions.
Fig. 1 d shows the results of fitting Eq. 2 to trajectory segments of length t = 0.5 s obtained for the same DNA molecule at the two flow rates shown in Fig. 1 a. Both the peak position and variance scale linearly with t as expected (Fig. 2). Regression on these parameters for 0.05 ≤ t ≤ 0.5 s in 0.05 s increments yields values for αu/γ and D as a function of flow rate (see the Supporting Material for details of the determination of the flow rate, u, at the DNA molecule). The values of αu/γ thus obtained are proportional to the flow rate, whereas the diffusion constant is invariant (Fig. 3), as expected from Eq. 2.
Figure 2.

Extraction of αu/γ and D. Each set of protein trajectories was taken on one DNA molecule. In a total of 12 data sets shown, there are three DNA molecules that allowed the production of more than one data set; in other words, we were able to perform experiments for more than one flow rate condition on these three DNA molecules. The rest of the data sets were collected on separate DNAs. Each data set contains on average ∼100 protein trajectories. (a) The peak positions of the Gaussian fits for the x distributions constructed at different times from four different sets of protein trajectories at 2 μL/min. The slope of the linear fit gives αu/γ. (b) The variances of the Gaussian fits for the same histograms in a versus time. The slope of the linear fit gives 2D. (c and d) Analogous plots for trajectories at 3 μL/min. (e and f) Analogous plots for trajectories at 4 μL/min.
Figure 3.

The quantity αu/γ at three different flow rates (four data sets per flow rate) (○) on some single DNA molecules. The slope of the linear fit is 1 × 10⁻². The diffusion constants (▿) determined from experiments are independent of flow. The error bars represent standard deviations.
Because our measurements include a wide range of times that C-Ada is on and moves along DNA, an examination of the distribution of on-times can provide definitive information about the mechanism of motion. The distributions of protein dwell times on DNA for different flow conditions are shown in Fig. 4. The dwell time distributions for the three flow rates are essentially identical, allowing us to conclude that the C-Ada protein does a one-dimensional search by sliding instead of hopping or even a combination of sliding and hopping. However, because the flow rate at the DNA plane is much higher than the speed of protein motion, if the protein were to hop off the DNA and be caught in the flow, it would be rapidly carried away. If hopping were significant, the systematic increase of the flow rate should enhance the probability of the protein being carried off and lost from the DNA and therefore reduce the lifetime of the protein on the DNA. However, such a trend is not observed in the data of Fig. 4.
Figure 4.
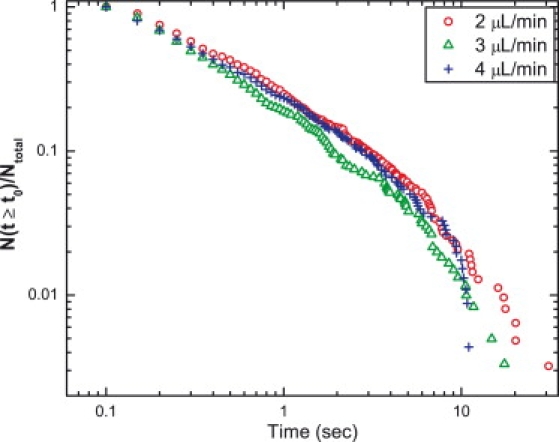
Protein dwell time distributions on the DNA under three different flow conditions (colors). Each dwell time value is a bin in the histograms.
The fact that each of the distributions is not a simple single exponential suggests a source of inhomogeneity. We determined that the data were better fit by three exponentials, with time constants differing by about an order of magnitude, than by a stretched exponential. We also partitioned the dwell time data according to whether the protein dissociated differently from three regions of the DNA, i.e., the pinned end, the middle segment, and the free end. Although the distributions are noisier, we concluded that they are still identical to each other. These findings suggest that the inhomogeneity is not a result of sequence or region-specific interactions. We suspect the nonsingle-exponential behavior results from the nonspecific nature of the dye labeling. Despite this inhomogeneity, the consistency of the protein dwell time distributions at different flow rates is direct experimental evidence for sliding being the mechanism that the protein employs in searching for its target sites in DNA sequences. This result is functionally relevant, at least in vitro, because the dye-labeled protein is catalytically active (Fig. S4).
Depending on whether the observed motion of the protein is with or against the flow, energy is put in or taken out of the system, respectively. This energy is transformed into heat exchange with the bath that, in turn, increases or decreases the system entropy. Further insights into the sufficiency of Eq. 2 to describe the motion can be obtained by showing that the motion of the protein satisfies the fluctuation theorem (20,21). To this end, consider the work done by the drag of the flow on the protein over time t:
| (3) |
Thus, we can write the entropy change in terms of x at time t:
| (4) |
Hence, the probability of obtaining trajectories with an entropy change of Σt is directly related to the probability of observing the protein at x (relative to its initial position at the origin).
| (5) |
Fig. 5 shows that the detailed fluctuation theorem (20) is satisfied.
Figure 5.
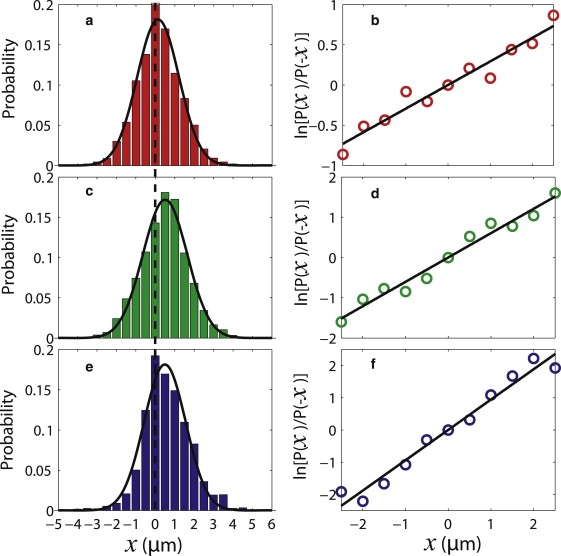
Satisfaction of a detailed fluctuation theorem. (a) Distribution of x for t = 0.5 s constructed from a set of protein trajectories at 2 μL/min flow rate with bin width 0.5 μm. The black curve is the best Gaussian fit. The dashed line indicates x = 0 μm. (b) Logarithm of the ratio of the number of trajectories with displacement x (i.e., entropy Σt) to the number of trajectories with displacement −x (i.e., entropy − Σt) versus x. The experimental data (○) are fitted with y = ax (solid black). (c and d) Analogous plots for a set of trajectories at 3 μL/min. (e and f) Analogous plots for a set of trajectories at 4 μL/min. The slopes of the fitted lines are in agreement with the αu/γD parameters extracted independently.
We further construct a relation in accordance with the integral fluctuation theorem (21):
| (6) |
It is clear from Eq. 6 that the probability of entropy consumption should approach that of entropy production at small flow-induced drag and short timescales, whereas the probability of observing entropy-consuming trajectories becomes vanishingly small at large flow-induced drag and long timescales. More information is obtained by expressing the ratio on the left-hand side explicitly:
| (7) |
where is the error function. In our system, the flow-induced drag is small, and the length of the trajectory segments t is chosen to be relatively short (i.e., to allow neglecting effects associated with the finite size of the DNA), such that the shift of the peak is small compared to the spread of the distribution (i.e., ). In this limit, we can expand the error function to obtain the leading contribution on the right-hand side of Eq. 7:
| (8) |
Thus, at short times, the logarithm is expected to scale with t according to a power law with exponent β = 0.5. Fig. 6, which compares the leftmost and rightmost quantities in Eq. 6 as a function of time, shows that this is indeed the case (0.48 ≤ β ≤ 0.53).
Figure 6.

Satisfaction of an integral fluctuation theorem. Logarithm of the ratio of the number of entropy-producing trajectory segments to the number of entropy-consuming trajectory segments versus t (leftmost quantity in Eq. 6; + symbols and fit, solid lines), and logarithm of 1/〈exp(− Σt/k)〉Σt>0 versus t (rightmost quantity in Eq. 6; ○ symbols and fit, dashed lines) plots for three sets of trajectories under different flow rates, 2 μL/min (bottom), 3 μL/min (middle), and 4 μL/min (top, blue online). A power law of the form y = axb is used to fit the data. The fitting parameters are a = 0.37 and b = 0.53 (bottom, solid), a = 0.31 and b = 0.50 (bottom, dashed), a = 0.87 and b = 0.53 (middle, solid), a = 0.85 and b = 0.49 (middle, dashed), a = 1.1 and b = 0.48 (top, solid), and a = 1.1 and b = 0.50 (top, dashed).
Discussion
The analysis above shows that, rather than neglecting the influence of the flow on the motion, one can exploit it for quantitative analysis of a macromolecular system. Given the agreement between the model and the data, it is of interest to relate the estimated parameters to the search mechanism. The slope of the line in Fig. 3 gives α/γ = 1.0 × 10⁻². Because D = kT/γ = 1.3 ± 0.2 μm2/s, α is experimentally determined to be 3.1 × 10⁻¹¹ kg/s. Although the protein is thought to follow the grooves of the DNA, as discussed below, the flow is axial, so we compare this number to the friction for translation of a sphere of radius r = 2.4 nm, which is estimated from the crystal structure (22): α = 6πηr = 4.5 × 10⁻¹¹ kg/s. That there is almost no shielding is consistent with the fact that only ∼10% of the surface area of a homolog is buried when bound to DNA (23).
Because the protein motion is likely to be a spiral path along the DNA double helix, it is important to relate laboratory and molecular frame quantities to interpret the diffusion constant (24,25). To this end, we consider the ratio of the length traveled along the spiral path to that along the axis: Lmol/Llab ≈ 4.8, assuming a 2.4-nm radius of orbital motion (i.e., roughly the radius of the protein). Given the measured diffusion constant Dlab = 1.3 ± 0.2 μm2/s, Dmol = (Lmol/Llab)2Dlab ≈ 30 μm2/s. By the same token, the theoretical diffusion constant of the protein free in aqueous solution is = kT/6πηr = 89 μm2/s and when projected to the laboratory frame it is = 3.9 μm2/s. Following the procedure described by Blainey et al. (14), which assumes that binding to the DNA affects only the free energy barrier to sliding, comparison of the observed and theoretical upper limit values corresponds to a barrier of 1.1kT.
A recent computer simulation of human AGT, a protein homolog of C-Ada, revealed that bases flip to an extrahelical intermediate before reaching the reactive site. Estimates of the rates for flipping to and from the intermediate conformation suggest a kinetic gate-keeping mechanism of lesion identification in which both damaged and undamaged bases flip to the intermediate but only the former continue onto the active site before the protein continues sliding. This would allow sliding at a near diffusion-limited rate (26).
We have also determined (Y. Lin, T. Zhao, X. Jian, Z. Farooqui, X. Qu, C. He, A. R. Dinner, and N. F. Scherer, unpublished results) that the diffusion constant is considerably smaller under crowded conditions (i.e., many copies of C-Ada on a single DNA) achieved at higher C-Ada concentrations. Because the in vivo protein concentration is substantially greater than that used here, and the associated mobility is reduced, there would certainly be sufficient time for partial base flipping to ascertain lesions in cells. This is consistent with the idea that Ada functions in vivo in crowded conditions either by binding multiple copies (see references 18,27,28 for discussion of its human homolog in this regard) or binding of many types of proteins to DNA. Chance entrance of undamaged bases to the active site under such circumstances does not pose a danger to the cell because the protein directly repairs damage rather than excises it.
Conclusions
We have used flow-dependent dynamics of C-Ada DNA repair protein on DNA to determine the diffusion coefficient and frictional interactions with DNA and solution. We suggest that the repair function could even work at a near-diffusion-limited rate of motion given estimates of kinetic parameters from recent simulations (26). Analysis of our measured dwell time (on-time) distributions shows that the mechanism of motion in vitro is sliding with little or no hopping. Our conclusion coincides with the observation of another DNA repair protein hOgg1 (14) but is not consistent with measurement on EcoRV (16). Possibly, the differences in the function of DNA binding proteins lead to such different observed mechanisms. However, all these assays were conducted on extended DNA molecules, whereas in vivo, the crowded conditions (and presumed reduced mobility) and coiled DNA structure and fluctuations would facilitate site exchange by hopping and intersegment transfer.
The general approach presented here for validation of the equation of motion will allow determination of the appropriate description of the dynamics and equation of motion for more complicated dynamics. For example, studies of C-Ada and its human homolog on single-stranded DNA extended by flow could confirm a putative asymmetry in binding kinetics (27,18).
Finally, although mechanical perturbation methods have reached very sophisticated levels and can deliver great sensitvity (29), the study we have presented here shows that much can be learned from a simple flow-based experiment. Given the straightforward nature of such measurements, they can readily be made for many systems, and it will be interesting to analyze the resulting fluctuations of systems with more complex dynamics, including ones that intrinsically consume energy such as RNA polymerases and other molecular motors that hydrolyze nucleotide triphosphates.
Acknowledgments
We thank Erica Duguid, Jelena Pesic, and Ying Li for helpful discussions. We also thank the Ismagilov group and the Lee group (University of Chicago) for experimental help.
The work was supported by the National Institutes of Health (GM67961, GM071440), the University of Chicago National Science Foundation-sponsored Materials Research Science and Engineering Center (DMR0213745), a Multidisciplinary University Research Initiative Program grant from the Army Research Office, and a National Science Foundation CAREER Award (MCB0547854). Z.F. was supported by the National Institutes of Health Roadmap Initiative, DK070076. N.F.S. thanks the John S. Guggenheim Memorial Foundation for a fellowship.
Contributor Information
Aaron R. Dinner, Email: dinner@uchicago.edu.
Norbert F. Scherer, Email: nfschere@uchicago.edu.
Supporting Material
References
- 1.Mishina Y., Duguid M.E., He C. Direct reversal of DNA alkylation damage. Chem. Rev. 2006;106:215–232. doi: 10.1021/cr0404702. [DOI] [PMC free article] [PubMed] [Google Scholar]
- 2.Halford S.E., Marko J.F. How do site-specific DNA-binding proteins find their targets? Nucleic Acids Res. 2004;32:3040–3052. doi: 10.1093/nar/gkh624. [DOI] [PMC free article] [PubMed] [Google Scholar]
- 3.Berg O.G., Winter R.B., von Hippel P.H. Diffusion-driven mechanisms of protein translocation on nucleic acids. 1. Models and theory. Biochemistry. 1981;20:6929–6948. doi: 10.1021/bi00527a028. [DOI] [PubMed] [Google Scholar]
- 4.Stanford N.P., Szczelkun M.D., Marko J.F., Halford S.E. One- and three-dimensional pathways for proteins to reach specific DNA sites. EMBO J. 2000;19:6546–6557. doi: 10.1093/emboj/19.23.6546. [DOI] [PMC free article] [PubMed] [Google Scholar]
- 5.Gowers D.M., Wilson G.G., Halford S.E. Measurement of the contributions of 1-D and 3-D pathways to the translocation of a protein along DNA. Proc. Natl. Acad. Sci. USA. 2005;102:15883–15888. doi: 10.1073/pnas.0505378102. [DOI] [PMC free article] [PubMed] [Google Scholar]
- 6.Slutsky M., Mirny L. Kinetics of protein-DNA interaction: facilitated target location in sequence-dependent potential. Biophys. J. 2004;87:4021–4035. doi: 10.1529/biophysj.104.050765. [DOI] [PMC free article] [PubMed] [Google Scholar]
- 7.Sokolov I.M., Metzler R., Pant K., Williams M.C. Target search of N sliding proteins on a DNA. Biophys. J. 2005;89:895–902. doi: 10.1529/biophysj.104.057612. [DOI] [PMC free article] [PubMed] [Google Scholar]
- 8.Hu L., Grosberg A.Y., Bruinsma R. Are DNA transcription factor proteins Maxwellian demons? Biophys. J. 2008;95:1151–1156. doi: 10.1529/biophysj.108.129825. [DOI] [PMC free article] [PubMed] [Google Scholar]
- 9.Thompson R.E., Larson D.R., Webb W.W. Precise nanometer localization analysis for individual fluorescent probes. Biophys. J. 2002;82:2775–2783. doi: 10.1016/S0006-3495(02)75618-X. [DOI] [PMC free article] [PubMed] [Google Scholar]
- 10.Gordon M.P., Ha T., Selvin P.R. Single-molecule high-resolution imaging with photobleaching. Proc. Natl. Acad. Sci. USA. 2004;101:6462–6465. doi: 10.1073/pnas.0401638101. [DOI] [PMC free article] [PubMed] [Google Scholar]
- 11.Qu X., Wu D., Mets L., Scherer N.F. Nanometer-localized multiple single-molecule fluorescence microscopy. Proc. Natl. Acad. Sci. USA. 2004;101:11298–11303. doi: 10.1073/pnas.0402155101. [DOI] [PMC free article] [PubMed] [Google Scholar]
- 12.Graneli A., Yeykal C.C., Robertson R.B., Greene E.C. Long-distance lateral diffusion of human Rad51 on double-stranded DNA. Proc. Natl. Acad. Sci. USA. 2006;103:1221–1226. doi: 10.1073/pnas.0508366103. [DOI] [PMC free article] [PubMed] [Google Scholar]
- 13.Wang Y.M., Austin R.H., Cox E.C. Single molecule measurements of repressor protein 1D diffusion on DNA. Phys. Rev. Lett. 2006;97:048302. doi: 10.1103/PhysRevLett.97.048302. [DOI] [PubMed] [Google Scholar]
- 14.Blainey P.C., van Oijen A.M., Banerjee A., Verdine G.L., Xie X.S. A base-excision DNA-repair protein finds intrahelical lesion bases by fast sliding in contact with DNA. Proc. Natl. Acad. Sci. USA. 2006;103:5752–5757. doi: 10.1073/pnas.0509723103. [DOI] [PMC free article] [PubMed] [Google Scholar]
- 15.Kim J.H., Larson R.G. Single-molecule analysis of 1D diffusion and transcription elongation of T7 RNA polymerase along individual stretched DNA molecules. Nucleic Acids Res. 2007;35:3848–3858. doi: 10.1093/nar/gkm332. [DOI] [PMC free article] [PubMed] [Google Scholar]
- 16.Bonnet I., Biebricher A., Porte P.-L., Loverdo C., Benichou O. Sliding and jumping of single EcoRV restriction enzymes on non-cognate DNA. Nucleic Acids Res. 2008;36:4118–4127. doi: 10.1093/nar/gkn376. [DOI] [PMC free article] [PubMed] [Google Scholar]
- 17.Graneli A., Yeykal C.C., Prasad T.K., Greene E.C. Organized arrays of individual DNA molecules tethered to supported lipid bilayers. Langmuir. 2006;22:292–299. doi: 10.1021/la051944a. [DOI] [PubMed] [Google Scholar]
- 18.Zhao T., Dinner A.R. Apparent directional scanning for DNA repair. Biophys. J. 2007;94:47–52. doi: 10.1529/biophysj.107.110619. [DOI] [PMC free article] [PubMed] [Google Scholar]
- 19.Reference deleted in proof.
- 20.Evans D., Cohen E., Morriss G. Probability of second law violations in shearing steady states. Phys. Rev. Lett. 1993;71:2401–2404. doi: 10.1103/PhysRevLett.71.2401. [DOI] [PubMed] [Google Scholar]
- 21.Wang G.M., Sevick E.M., Mittag E., Searles D.J., Evans D.J. Experimental demonstration of violations of the second law of thermodynamics for small systems and short time scales. Phys. Rev. Lett. 2002;89:050601. doi: 10.1103/PhysRevLett.89.050601. [DOI] [PubMed] [Google Scholar]
- 22.Moore M.H., Gulbis J.M., Dodson E.J., Demple B., Moody P.C. Crystal structure of a suicidal DNA repair protein: the Ada O6-methylguanine-DNA methyltransferase from E. coli. EMBO J. 1994;13:1495–1501. doi: 10.1002/j.1460-2075.1994.tb06410.x. [DOI] [PMC free article] [PubMed] [Google Scholar]
- 23.Duguid E.M., Rice P.A., He C. The structure of the human AGT protein bound to DNA and its implications for damage detection. J. Mol. Biol. 2005;350:657–666. doi: 10.1016/j.jmb.2005.05.028. [DOI] [PubMed] [Google Scholar]
- 24.Schurr J.M. The one-dimensional diffusion coefficient of proteins absorbed on DNA. Hydrodynamic considerations. Biophys. Chem. 1979;9:413–414. [PubMed] [Google Scholar]
- 25.Bagchi B., Blainey P.C., Xie X.S. Diffusion constant of a nonspecifically bound protein undergoing curvilinear motion along DNA. J. Phys. Chem. 2008;112:6282–6284. doi: 10.1021/jp077568f. [DOI] [PubMed] [Google Scholar]
- 26.Hu J., Ma A., Dinner A.R. A two-step nucleotide-flipping mechanism enables kinetic discrimination of DNA lesions by AGT. Proc. Natl. Acad. Sci. USA. 2007;105:4615–4620. doi: 10.1073/pnas.0708058105. [DOI] [PMC free article] [PubMed] [Google Scholar]
- 27.Daniels D.S., Woo T.T., Luu K.X., Noll D.M., Clarke N.D. DNA binding and nucleotide flipping by the human DNA repair protein AGT. Nat. Struct. Mol. Biol. 2004;11:714–720. doi: 10.1038/nsmb791. [DOI] [PubMed] [Google Scholar]
- 28.Rasimas J.J., Kar S.R., Pegg A.E., Fried M.G. Interactions of human O6-alkylguanine-DNA alkyltransferase (AGT) with short single-stranded DNAs. J. Biol. Chem. 2007;282:3357–3366. doi: 10.1074/jbc.M608876200. [DOI] [PMC free article] [PubMed] [Google Scholar]
- 29.Wang M.D., Schnitzer M.J., Yin H., Landick R., Gelles J. Force and velocity measured for single molecules of RNA polymerase. Science. 1998;282:902–907. doi: 10.1126/science.282.5390.902. [DOI] [PubMed] [Google Scholar]
- 30.Saxton M.J. Single-particle tracking: the distribution of diffusion coefficients. Biophys. J. 1997;72:1744–1753. doi: 10.1016/S0006-3495(97)78820-9. [DOI] [PMC free article] [PubMed] [Google Scholar]
Associated Data
This section collects any data citations, data availability statements, or supplementary materials included in this article.