

Abstract
Bis(monoacylglycero)phosphate (BMP) is an unusually shaped lipid found in relatively high percentage in the late endosome. Here, we report the characterization of the morphology and molecular organization of dioleoyl-BMP (DOBMP) with dynamic light scattering, transmission electron microscopy, nuclear magnetic resonance (NMR) spectroscopy, and electron paramagnetic resonance spectroscopy. The morphology of hydrated DOBMP dispersions varies with pH and ionic strength, and DOBMP vesicles are significantly smaller in diameter than phosphatidylcholine dispersions. At neutral pH, DOBMP forms highly structured, clustered dispersions 500 nm in size. On the other hand, at acidic pH, spherically shaped vesicles are formed. NMR and spin-labeled electron paramagnetic resonance demonstrate that DOBMP forms a lamellar mesophase with acyl-chain packing similar to that of other unsaturated phospholipids. 31P NMR reveals an orientation of the phosphate group in DOBMP that differs significantly from that of other phospholipids. These macroscopic and microscopic structural characterizations suggest that the biosynthesis of BMP on the inner luminal membrane of maturing endosomes may possibly produce budded vesicles high in BMP content, which form small vesicular structures stabilized by the physical properties of the BMP lipid.
Abbreviations used: BMP, bis(monoacylglycero)phosphate; BMP18:1, (S,R isomer)-sn-(3-oleoyl-2-hydroxy)-glycero-1-phospho-sn-3′-(1′-oleoyl-2′-hydroxy)-glycerol; POPC, 1-palmitoyl-2-oleoyl-sn-glycero-3-phosphocholine; EPR, electron paramagnetic resonance; LUV, large unilamellar vesicles; MLV, multilamellar vesicle; VB, vesicular body; DLS, dynamic light scattering; TLC, thin-layer chromatography; TEM, transmission electron microscopy; DMBMP, dimyristoyl-BMP; DOBMP, dioleoyl-BMP; DOPC, 1,2-dioleoyl-sn-glycero-3-phosphocholine; DOPG, 1,2-dioleoyl-sn-glycero-3-[phospho-rac-(1-glycerol)]; POPG, 1-palmitoyl-2-oleoyl-sn-glycero-3-[phospho-rac-(1-glycerol)]; SDS, sodium dodecyl sulfate; ANTS, 8-amino-napthalene-1,3,6 trisulfonic acid; DPX, p-xylene-bis-pyridinium bromide
Introduction
Bis(monoacylglycero)phosphate (BMP), also known as lysobisphosphatidic acid, is a negatively charged phospholipid found in elevated concentrations in the late endosome. BMP represents <1 mol % of the total phospholipid mass in most tissues and cell types (1,2); but, in the late endosome, the concentration of BMP is near 15 mol % of the total lipid content of the organelle (3–5) and can comprise as much as 70 mol % of the lipid composition of the intraendosomal vesicles. Endosomes are intracellular organelles that act as a staging area for sorting endocytosed material either back to the plasma membrane for recycling or to specialized organelles (lysosomes) for degradation (2,6), and they can be identified by the presence of vesicular bodies (VBs) inside the lumen of a limiting membrane or by lipid composition (4,7). Early endosomes have a limiting membrane with a lipid composition very similar to that of the plasma membrane, whereas late endosomes are characterized by an absence of a significant amount of cholesterol and a relatively high concentration of BMP (7). During endosome maturation, the internal pH undergoes a series of changes from that of the neutral cytosol to that of the acidic lysosome. It is within late endosome intraluminal membranes that BMP is first found in relatively higher concentrations and is believed to be partly responsible for the formation of the intraendosomal VBs (8).
The structure of BMP is unusual from two perspectives. First, it is a phospholipid with two glycero groups, each with a single acyl chain (Fig. 1). In addition, BMP isolated from biological sources differs from the typical sn-3-glycerophosphate structures exhibited by most other glycerophospholipids (2,9,10) in that it possesses an atypical sn-1-glycerophospho-sn-1′-glycerol (sn1:sn1′) stereoconfiguration (11–16). However, the sn-3:sn-1′ configuration has been reported for BMP isolated from BHK cells, although it is postulated that this configuration is an intermediate in the synthesis of the sn-1:sn-1′ BMP (12). The unusual structure and stereochemistry of BMP are thought to play important roles in the endosome, including structural integrity, endosome maturation, and lipid/protein sorting and trafficking (17,18). It is unclear how this occurs, but it is likely that the structure and biosynthesis of BMP, coupled to the change in pH during the maturation of endosome induces intraendosomal VB formation.
Figure 1.

Stick diagram structures of DOBMP and POPC.
Because of the unusual structure of BMP, we were interested in characterizing the morphology, size, and acyl-chain packing in hydrated BMP dispersions and extruded vesicles. Investigations utilizing solid-state NMR and spin-labeled EPR provide detailed molecular-level information regarding the degree of order at individual chemical bonds for particular molecules (19–24). The types of order/disorder commonly investigated using these spectroscopic techniques include a motion-averaged picture of phospholipid head group and acyl chain angular orientation with respect to the bilayer normal (20,21,25). Because all phospholipids (by definition) contain a phosphate group, the phosphorus atom is a natural probe for 31P NMR investigations of average head group orientation, which provides an indirect means to determining lipid mesophase, with each having a signature 31P powder pattern spectrum (26). However, line shape can only be consistent with a particular mesomorphic state, and x-ray or cryogenic electron microscopy measurements are needed to fully confirm the aggregate morphology (9). In addition, EPR can be used to probe acyl-chain order/dynamics as a function of membrane depth by use of doxyl-labeled phospholipids (22). The doxyl label, which provides an unpaired electron for EPR, is strategically placed at different depths within the membrane bilayer. These doxyl-labeled lipids have been widely used to investigate disorder and mobility profiles along lipid bilayer chains (27–32). Although the NMR and EPR investigations provide a microscopic view of head group and acyl-chain organization, dynamic light scattering (DLS) and negative-staining TEM provide information regarding the macroscopic shapes and sizes of BMP dispersions and vesicles.
Various structural isomers of BMP can be made by varying the location of the two acyl chains or by altering the sn- stereochemistry (18). Here we have used the commercially available sn-3:sn-1′ dioleoyl BMP (3:1′ DOBMP structure shown in Fig. 1) and investigated the morphology and acyl-chain packing in hydrated lipid dispersions and extruded vesicles. Our results show that DOBMP forms small, stable lamellar vesicles with interior volumes and acyl-chain packing that does not differ from other model membranes containing similar unsaturated acyl chains. The morphology of the hydrated dispersions vary as a function of pH and provide insight into the role that BMP plays in forming intraendosomal VBs, which are triggered by the biosynthesis of BMP and a drop in endosomal lumen pH.
Experimental Procedures
Materials
DOBMP ((S,R-isomer)sn-(3-oleoyl-2-hydroxy)-glycero-1-phospho-sn-3′-(1′-oleoyl-2′-hydroxy)-glycerol, ammonium salt), POPC, DOPC, POPG sodium salt, DOPG sodium salt, and 5-, 7-, 10-, 12-, 14-, 16- doxyl-PC were purchased from Avanti Polar Lipids (Alabaster, AL) and used without further purification. Calcein (C30H26N2O13), ANTS, and DPX were purchased from Molecular Probes (Invitrogen, Carlsbad, CA). SDS, HEPES, NaOAc, EDTA, and NaCl were purchased from Fisher Biotech (Pittsburgh, PA). CH3Cl, MeOH, cyclohexane, NH4OH, HCl, and NaOH were obtained from Fisher Scientific (Pittsburgh, PA). UO2 (CH3COO)2·2H2O) and 400-mesh Formvar-coated copper grids were purchased from Ted Pella (Redding, CA). Single-sealed 50- to 1000-μL disposable cuvettes (10-mm path length) were obtained from Eppendorf (Westbury, NY). The 30-nm, 100-nm, and 400-nm polycarbonate extrusion membranes and filter supports were purchased from Avanti Polar Lipids. TLC plates were silica-coated aluminum and were purchased from Whatman (Florham Park, New Jersey).
Preparation of lipid dispersions and unilamellar vesicles
For DLS and TEM measurements, the desired amount of BMP or POPC dissolved in chloroform was dried under a gentle N2 stream. The sample was then vacuum desiccated for at least 24 h to remove residual chloroform. The resulting thin lipid film was hydrated with 2 mL of either HEPES buffer, pH 7.4 (5 mM HEPES, 100 mM NaCl, 0.1 mM EDTA) or NaOAc buffer, pH 4.2 (5 mM sodium acetate, 100 mM NaCl, 0.1 mM EDTA) to a final lipid concentration of 0.75 mM. For TEM measurements, additional samples hydrated in HEPES buffer without salt, pH 7.4 (5 mM HEPES, 0.1 mM EDTA) and NaOAc buffer without salt, pH 4.2 (5 mM NaOAc, 0.1 mM EDTA) were prepared. Lipid suspensions were then vortex mixed 5–10 times, freeze-thawed with liquid nitrogen three times, and placed in a shaker/incubator at room temperature for ∼2 h. MLV dispersions were incubated at room temperature for ∼12 h before extrusion or measurement by DLS and TEM. To form LUVs, the MLV dispersions were passed 31 times through 30 nm, 100 nm, or 400 nm polycarbonate extrusion membranes. LUV samples were then immediately used for DLS measurements.
MLV dispersions were prepared as described above; however, EPR samples were ∼50 mM total lipid concentration, whereas NMR samples were ∼5 mg BMP or 50 mg POPC hydrated in 300 μL of buffer solution. Additionally, EPR samples included 1 mol % n-doxyl spin-labeled phospholipid (n = 5, 7, 10, 12, 14, and 16), where n indicates the position along the saturated palmitoyl acyl chain. Note that the HEPES buffer, pH 7.4 (50 mM HEPES, 100 mM NaCl, 0.1 mM EDTA) and NaOAc buffer, pH 4.2 (50 mM NaOAc, 100 mM NaCl, 0.1 mM EDTA) differ from DLS and TEM buffer conditions. Phospholipid integrity, both before and after NMR analysis, was verified by TLC. Approximately 7 μL of sample was dried and redissolved in ∼2 μL of chloroform and spotted on silica-coated aluminum plates. Plates were placed in a chamber containing a 65:25:4 (CH3Cl:MeOH:NH4OH) mobile phase. The TLC plates were developed in an iodine chamber and visualized by eye. The final lipid concentration was determined by a Malachite Green Phosphate Assay Kit (BioAssay Systems, Hayward, CA).
Dynamic light scattering
DLS size distribution measurements of liposomes were performed with a Brookhaven 90Plus/BI-MAS ZetaPALS spectrometer operated at a wavelength of 659 nm and at 25°C. The instrument uses a BI-9000AT digital autocorrelator and 9KDLSW data acquisition software. A 100-μL sample volume in a disposable cuvette was used for each measurement. Data and histograms were further analyzed and converted into B-spline plots using OriginPro 8 software.
Negative-staining transmission electron microscopy
TEM images were obtained using a Hitachi H-7000 transmission electron microscope operated at 75 kV with a Soft-Imaging System MegaViewIII with AnalySIS digital camera (Lakewood, CO). The microscope has a maximum resolution at 0.2 nm with a magnification range of 110× to 600,000×. Before TEM measurements, samples were prepared by negative staining. Briefly, for all samples, a drop of the lipid vesicle sample was spread on a 400-mesh Formvar-coated copper grid and incubated for 2 min. Excess sample was gently dabbed away with filter paper, and the grid was allowed to dry for 2 min. A drop of deionized water was added to the grid to remove any excess salt from the buffer solution used in vesicle preparation. One drop of 2% uranyl acetate was then added to the grid and allowed to stain for 2 min, after which any excess uranyl acetate was wiped away, and the sample was allowed to dry for 2 min before being placed in the electron microscope specimen holder for analysis.
Fluorescence measurements
Fluorescence spectra were acquired with a FluoroMax-3 fluorometer (Jobin Yvon Horiba, Edison, NJ) with a temperature-controlled sample cell and a Haake K20 temperature controller (Thermo Electron, Waltham, MA). Measurements were made using a 4-mm light path quartz cuvette (Starna, Atascadero, CA). All spectra were collected at 27°C with both the excitation and emission slits set to 5 nm and with excitation and emission polarizers set to 90° and 0°, respectively.
For calcein-loaded vesicle assays (33), BMP dissolved in chloroform was dried under a stream of nitrogen gas to form a thin lipid film, then subsequently placed under vacuum overnight to remove residual organic solvent. This lipid film was hydrated with 2 mL of either HEPES buffer (pH 7.4) containing 70 mM calcein fluorescent dye or NaOAc buffer (pH 4.2) containing 25 mM ANTS and 90 mM DPX fluorescent dyes; final lipid concentrations were 5 mg/mL for pH 7.4 and 2 mg/mL for pH 4.2. Hydrated dispersions were passed through 400-nm extrusion membranes as described above to form LUVs. Fluorophore-loaded LUVs were separated from free fluorophore on a Sephadex G-50 Fine column (GE Healthcare, Piscataway, NJ). For this assay, 10 μL of lipid suspension was diluted to 300 μL in a 4-mm light path quartz cuvette (Starna). SDS detergent solubilization of calcein-loaded vesicles was monitored by fluorescence spectroscopy with excitation at 490 nm and detection of emission intensity at 520 nm. However, the ANTS/DPX leakage assay utilized an excitation of 360 nm and emission at 530 nm and used wider slit widths (10–20 nm). Concentrated SDS detergent (10% w/w) was titrated with a subsequent 10-min incubation period at 27°C, with stirring, before obtaining the emission intensity after each SDS titration step. Percentage fluorophore release was determined as (I − I0)/(I∞ − I0) · 100 where I is the emission intensity after addition of SDS, I0 is the emission intensity in the absence of SDS, and I∞ is the emission intensity after the addition of 5 μL 20% w/w SDS. All emission intensities were corrected for dilution factor from titrations and each assay was performed in triplicate.
EPR spectroscopy
EPR spectroscopy was performed on a modified Bruker ER200 spectrometer with an ER023M signal channel, an ER032M field control unit and equipped with a loop gap resonator (Medical Advances, Milwaulkee, WI). Sample temperature was maintained at 27°C by passing nitrogen gas through a copper coil submerged in a refrigerated bath (Thermo Scientific Neslab RTE-7 digital one (−25 to 150°C ± 0.01)) containing 40% ethylene glycol that then flowed to a quartz dewar (Wilmad-Labglass, Buena, NJ) that surrounded the loop-gap resonator. A 10-μL sample was loaded into a sealed round capillary tube, 0.60 mm × 0.84 mm × 100 mm (Fiber Optics Center, New Bedford, MA). Spectra were acquired with the following instrumentation parameters: 100 G sweep width, 1.8 G modulation amplitude, 2 mW microwave power. Labview programs, generously provided by Drs. Christian Altenbach and Wayne Hubbell (UCLA), were used for baseline correction and area normalization of all EPR spectra.
NMR spectroscopy
Wide line 31P NMR spectroscopy was performed with a Tecmag Apollo spectrometer operating at a resonance frequency of 145.2 MHz. 31P NMR spectra were acquired with a CP/MAS probe purchased from Doty Scientific (Columbia, SC) with variable temperature capability (±1°C) using a two-pulse Hahn echo sequence with typical pulse spacing of 40 μs, 4-μs π/2 pulses, with 1H decoupling. A minimum of 1024 transients (5 μs dwell and 5 s recycle delay) were averaged for each spectrum.
Results
Vesicle morphology of BMP dispersions and extruded vesicles
DLS was utilized to characterize the size of hydrated and extruded DOBMP samples. When DOBMP is hydrated from a dry film, it forms lipid dispersions that have diameters much smaller than those of POPC MLVs. Fig. 2, A and B, show results from DLS experiments of DOBMP and POPC hydrated dispersions as a function of pH. Fig. 2, C and D, show results obtained for hydrated liposomes that were mechanically passed 31 times through extrusion membranes with 400-nm pore diameters. The traces shown represent single histogram results from a single measurement. Typically, three to five measurements were made for each sample (average results summarized in Table 1). Regardless of pH, DOBMP dispersions (solid lines, Fig. 2, A and B) have average vesicle diameters smaller than those of POPC (dashed lines, Fig. 2, A and B). Dispersions obtained when samples are hydrated with sodium acetate buffer (pH 4.2) are larger in size for both DOBMP (∼1000 nm) and POPC (∼2500 nm) than under neutral conditions, where vesicles of DOBMP and POPC have average diameters near 600 nm and 1400 nm, respectively.
Figure 2.

DLS measurements at 25°C of DOBMP (solid line) and POPC (dashed line) for hydrated dispersions at (A) pH 7.4 and (B) acidic pH 4.2 and for vesicles mechanically passed through extrusion membranes with 400 nm pores at (C) neutral pH 7.4 and (D) acidic pH 4.2. For these experiments all buffers contained 100 mM NaCl and 0.1 mM EDTA. Note that the scales on the abscissa are not the same.
Table 1.
Average measured vesicle diameter determined from DLS measurements for lipid dispersions mechanically passed through extrusion membranes
| Pore diameter of extrusion membrane | Measured vesicle diameters∗ |
||
|---|---|---|---|
| DOBMP | POPG | POPC | |
| 30 nm | 54 ± 22† | 84 ± 6 | 75 ± 17 |
| 100 nm | 95 ± 19 | 123 ± 17 | 120 ± 9 |
| 400 nm | 230 ± 30 | 300 ± 100 | 396 ± 180 |
All samples prepared in 50 mM HEPES, 100 mM NaCl, pH 7.4.
Error bars represent the standard deviation of most probable vesicle size from three independent DLS histograms.
At neutral pH, when the POPC dispersions are passed through 400 nm extrusion membranes, the average vesicle diameter is observed to be ∼360 nm (Fig. 2 C, dashed line), but when acidic conditions are used, the vesicle size increases slightly to near 800 nm (Fig. 2 D, dashed line). However, the size of the DOBMP extruded vesicles does not change significantly when pH is altered. As shown in Fig. 2, C and D (solid lines), the DOBMP vesicles have average diameters near 230 nm at pH 7.4 and near 280 nm for pH 4.5, which are both smaller than the diameters of the 400-nm pores through which the dispersions were mechanically passed. In addition, the extruded DOBMP vesicles have a much narrower size distribution than that of POPC.
Table 1 summarizes the results from DLS measurements of average measured vesicle diameters for DOBMP, POPC, and POPG hydrated dispersions (neutral pH) that were mechanically passed through extrusion membranes that varied in size (30 nm, 100 nm, and 400 nm). Because DOBMP is negatively charged, comparisons to POPG are also presented. The results show that, on average, DOBMP vesicles form with a diameter that is smaller than both POPG and POPC when passed through extrusion membranes of equal size. In addition, a markedly smaller diameter of 230 ± 30 nm is observed for DOBMP vesicles mechanically passed through the 400-nm extrusion pores. These data suggest that DOBMP forms stable small vesicles with diameters near 250 nm.
Fig. 3 shows negative-staining TEM images of DOBMP and POPC dispersions (A and B) and vesicles produced by passing through 400-nm extrusion membranes (C–F) at neutral pH and 100 mM NaCl. From Fig. 3 A it can be seen that DOBMP dispersions form nonspherical vesicles with their morphology resembling a clustering of smaller vesicles possibly containing small budlike protrusions. The arrow in Fig. 3 A points to a possible side view of the vesicle indicating that the clustering seen from the top-down views is likely not a vesicle-inside-a-vesicle effect but rather the fused tubular structure of smaller vesicle shapes.
Figure 3.
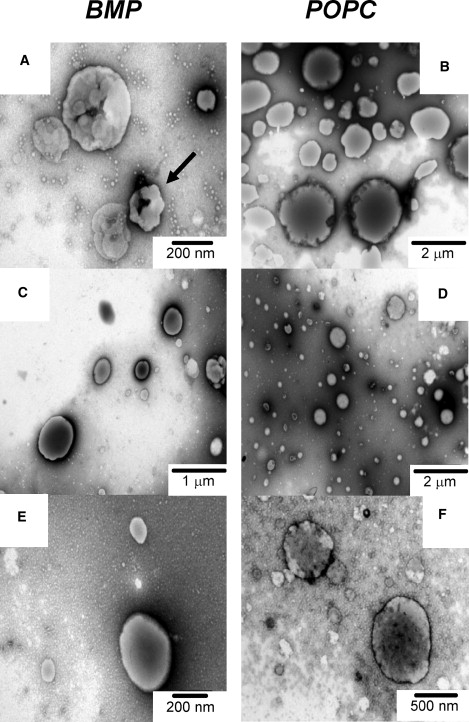
Negative-staining TEM images of DOBMP and POPC hydrated with HEPES buffer pH 7.4 with 100 mM NaCl. Dispersions of (A) DOBMP and (B) POPC. (C and E) DOBMP vesicles formed by mechanical passage through 400-nm extrusion membranes. (D and F) POPC vesicles formed by extrusion through 400-nm membranes. Parts E and F are magnifications of C and D, respectively, with magnification indicated in each panel.
A size analysis of the DOBMP hydrated dispersion TEM images gives a distribution between 200 and 800 nm for vesicle diameter, centered at 400 nm, which is in agreement with results obtained from DLS measurements. It is interesting to note that when the DOBMP dispersions are passed through 400-nm pore size extrusion membranes (C and E), the clustered structure disappears, and well-rounded spherical structures with an average diameter of 200 nm are formed. The size is also consistent with that observed from DLS measurements. The fact that DOBMP “400 nm extruded” vesicles produce 200-nm vesicles can be understood by considering that the clustered dispersions may have their smaller budlike protrusions sheared off when passed through the membranes. In comparison, we see that POPC MLVs form uniform spherical structures that are much larger in size (∼2000 nm) than the DOBMP dispersions, and analysis of the TEM images of POPC 400 nm extruded vesicles reveals the expected spherical structures with vesicle diameter near 500 nm.
The clustered macroscopic structure of the DOBMP dispersions is found to vary with pH. Fig. 4 shows TEM images of DOBMP hydrated dispersions at pH 7.4 (A) and pH 4.2 (B). A clear distinction can be seen between the two structures, with samples at pH 7.4 exhibiting the clustered/budding structures and those at pH 4.2 forming nonstructured spherical shapes ranging from 400 to 800 nm (again much smaller in size than POPC). The pH dependence of DOBMP vesicle morphology may have significant implications in the process of endosome maturation (see Discussion). In addition, the observed clustered morphology is dependent on salt. A previous report in the literature provides TEM images of DOBMP hydrated in 5 mM HEPES buffer pH 7.4 with a spherical morphology (17,18,34). We obtain consistent results when using buffer lacking 100 mM NaCl, and these results are shown in Fig. 4 C. On extrusion through 400-nM membranes, spherically shaped vesicles smaller than 200 nm in diameter are obtained for neutral pH in the absence of NaCl (Fig. 4 D).
Figure 4.
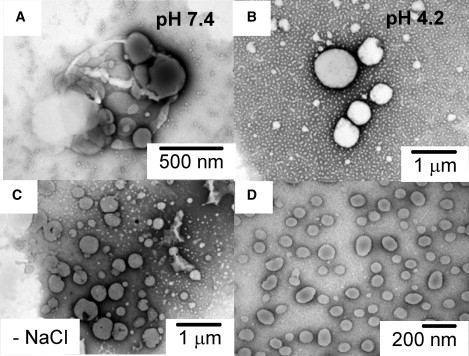
Negative-staining TEM images of DOBMP showing effects of pH and salt. (A) Dispersions hydrated in HEPES buffer with 100 mM NaCl. (B) Dispersions hydrated in NaOAc buffer with 100 mM NaCl. (C) Dispersions hydrated in HEPES buffer with no NaCl. (D) Same sample as in C but passed through 400-nm extrusion membranes. The clustered structure of the dispersions is not seen under acidic conditions or under low ionic strength. Magnifications vary and are indicated in each figure.
In addition, DOBMP forms “stable” small vesicle structures. Fig. 5 shows results from DLS measurements performed on 30-nm extruded vesicles of DOBMP and POPC over a 5-week period, with samples stored at room temperature. Because BMP hydrolyzes rapidly under acidic conditions, (evidence seen by TLC within 4 days after sample hydration), the stability data were collected only for pH 7.4. From the data in Fig. 5, we can clearly see that the POPC vesicles fuse to form larger structures as early as 2 weeks after extrusion. On the other hand, although the size distribution of the DOBMP 30-nm extruded vesicles increases, the average vesicle size is still near 50 nm, and the distribution tails off near 100 nm. To investigate the effects that the negative charge has on preventing vesicle fusion, we also examined the stability of extruded 30-nm POPG vesicles and find that fusion occurs 3 weeks after extrusion (data not shown). For all experiments, lipid integrity over this time period was validated by TLC analysis. Combined, the DLS and negative-staining TEM results indicate that BMP tends to form a small, stable vesicular mesophase.
Figure 5.
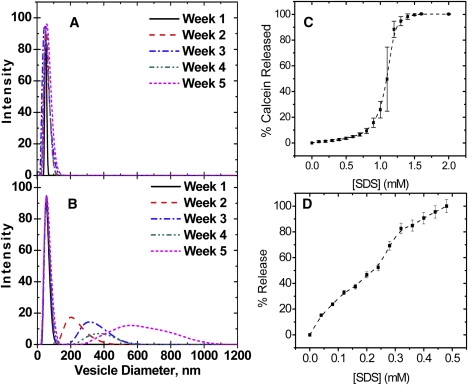
DLS measurements at 25°C of 30-nm extruded (A) DOBMP vesicles and (B) POPC vesicles as a function of time. For these experiments, lipids were hydrated only at neutral pH because lipid degradation (detected via TLC) occurs over the 5-week time period for DOBMP vesicles under acidic conditions. Results of SDS solubilization leakage assays of BMP 400-nm extruded vesicles (100 mM NaCl) loaded with (C) calcein, pH 7.4, and (D) ANTS/DPX, pH 4.2. Error bars represent the standard deviation from three different titration experiments. The dashed lines are guides for the reader. Note that the concentrations of the lipid solutions used in A and B were 200 μM and 50 μM, respectively, which accounts for the variation in concentration (x axis values), needed to solublize the vesicles.
BMP forms lamellar vesicles that have an interior volume
To verify that DOBMP forms liposomes containing an interior volume, fluorescence leakage assays were performed using calcein (33,35,36) for vesicles at neutral pH, and the fluorescence resonance energy transfer (FRET) pair of ANTS/DPX for vesicles at acidic pH (33,35). Fig. 5 C plots the percentage of calcein release for 400-nm extruded BMP vesicles loaded with calcein as a function of titrated SDS concentration. Because calcein enclosed within a LUV has low fluorescence emission because of collisional quenching, an increase in fluorescence intensity on SDS titration is interpreted as release of the fluorophore with SDS partitioning into the DOBMP LUV and eventual complete micellization (33,35,36). As a control (data not shown), the fluorescence intensity of calcein-loaded DOBMP vesicles was monitored over a 2-h period and showed <2% fluorescence intensity change over this time period. Hence, from these results, it is clear that extruded DOBMP vesicles contain an interior volume that can trap the calcein fluorophore.
The data from an analogous experiment under acidic conditions are shown in Fig. 5 D. Because the quantum yield of calcein is very low under acidic conditions, the FRET pair of ANTS/DPX was utilized, where ANTS and DPX were coentrapped within the vesicle (33,35). Again, control experiments over 2 h without addition of SDS show <2% increase in fluorescence intensity, indicating that the vesicles are stable during the time course of the titration experiment. On addition of SDS, liposome contents are released into the bulk solution and diluted, producing a dequenching of ANTS fluorescence. These results demonstrate that under acidic conditions, DOBMP-extruded vesicles are stable and contain an interior volume that can entrap molecules.
To obtain a microscopic view of the DOBMP molecular orientation, the solid-state 31P NMR spectrum was obtained for DOBMP hydrated at pH 7.4 and is shown in Fig. 6 A. (The 31P NMR spectrum for DOBMP under acidic conditions could not be obtained because of lipid hydrolysis seen via TLC analysis after data collection.) The NMR spectrum of DOBMP has the characteristic shape of a lamellar lipid mesophase (37) (note the relatively sharp feature of the parallel edge of the chemical shift powder pattern) with the span of the spectrum significantly narrowed (12 ± 1 ppm) compared to that of other typical lamellar phase lipids such as POPC (45 ± 1 ppm) and POPG (34 ± 1) at 27°C. For comparison, also shown is the 31P NMR spectrum obtained for a sample of POPC hydrated with the same buffer. The observed narrow chemical shift span of DOBMP can arise either from a different orientation of the phosphate group or from increased modes of motional averaging (38–40). A model for the DOBMP phosphate head group orientation based on the 12 ± 1 ppm span is given in the Discussion section. Taken together, the NMR results and fluorescence trapping results indicate that the mesophase structures formed by DOBMP have a lamellar arrangement of lipid molecules and form vesicle structures containing an interior volume that can trap molecules, which can be accessed by SDS detergent solubilization.
Figure 6.
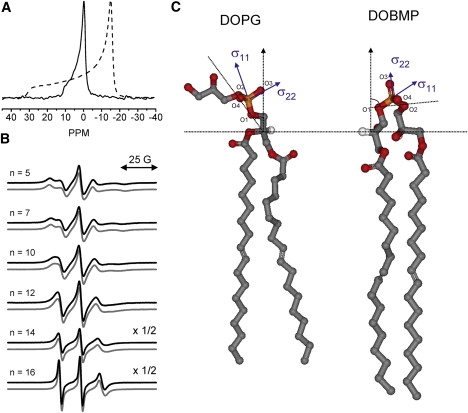
(A) 31P NMR spectrum of DOBMP dispersion (solid line) compared to POPC dispersion (dashed line), pH 7.4, T = 27 ± 1°C. Spectra are referenced to the isotropic chemical shift value of POPC. (B) Double-area normalized X-band EPR spectra for hydrated dispersions of BMP (black line) and POPC (gray line) containing 1 mol % n-doxyl spin-labeled lipid. Note that the y-axes for n = 14 and 16 are scaled by 2×. (C) Ball-and-stick model representations of DOPG and DOBMP showing the relative orientations of their phosphate head groups with respect to the bilayer normal (dotted lines). The orientation of the chemical shift tensor is taken from refs. 37, 41, and 42. Models were generated using WebLab Viewer Pro 5.0 with coordinates of individual lipid molecules with bonds rotated manually to best depict the orientation of the BMP head group proposed from molecular dynamic simulations (17) and orientations of the typical phospholipid head groups determined from NMR and x-ray models (41,42).
Acyl-chain packing in BMP LUVs
To investigate how the acyl-chain dynamics and packing in DOBMP compare to those in other model membranes, EPR spectra were collected for DOBMP hydrated dispersions containing 1 mol % of an n-doxyl spin-labeled phospholipid (n = 5, 7, 10, 12, 14, and 16) at pH 7.4 and 4.2 (with 100 mM NaCl). For comparison, spectra were also collected for n-doxyl spin labels incorporated into the following model membranes: POPC, DOPC, POPG, and DOPG (all samples were hydrated with HEPES buffer, pH 7.4, or NaOAc buffer, pH 4.2, and all spectra were recorded at a constant temperature of 27°C). Fig. 6 B shows double-integral area-normalized 100G X-band EPR spectra for n-doxyl lipids incorporated into DOBMP and POPC dispersions at pH 7.4. No significant difference in the line shapes of n-doxyl lipids can be seen for any position along the acyl chain, indicating that the packing and acyl-chain dynamics of DOBMP are similar to those seen in POPC. In fact, spectra collected for DOPC, POPG, and DOPG give nearly identical results (data not shown), and pH had no effect on the EPR spectral line shapes.
These results provide experimental evidence that the packing of the dioleoyl chains in DOBMP does not significantly deviate from that in POPC or other lamellar model bilayers and that, although pH is seen to alter the macroscopic morphology of the DOBMP vesicles, the acidic conditions do not alter the acyl-chain dynamics in the nanosecond time scale sampled by the doxyl spin probes.
Discussion
Because of the interesting structure of BMP and its role in small vesicle formation during endosome maturation, a handful of studies investigating the biophysical properties of various BMP isoforms have recently appeared in the literature (17,18,34). For example, the effects of the sn-1:sn1′ versus sn-3:sn-1′ stereochemistry of the glycerol backbones of BMP were investigated with differential scanning calorimetry, small angle x-ray scattering, and molecular dynamics simulations of DMBMP (17). From this investigation, it was speculated that the hydrogen-bonding interactions of the BMP head group were much stronger than in DMPG and that both DMBMP isoforms adopted lamellar mesophase structures with only slight differences in cooperativity of melting as a function of stereochemistry and slight changes in the average tilt angle of the phospholipids in the gel state at 5°C. From our spin-labeled EPR results of n-doxyl PC incorporated into DOBMP, we see that in the liquid lamellar state, the acyl-chain dynamics/packing in DOBMP is similar to that of the Lα state of other common phospholipids such as POPC, POPG, DOPC, and DOPG.
The solid-state 31P NMR spectrum of DOBMP also reports that BMP forms lamellar structures when hydrated; however, the spectrum is considerably narrower in span than for other hydrated phospholipids. The narrowed span (Δσ) (∼−12 ppm) of the 31P NMR spectrum of BMP (Fig. 6 A) agrees well with the average orientation of the DMBMP molecules determined from MD simulations (17). Fig. 6 C shows a cartoon representation comparing the orientation of the phosphate group in DOPG (10) to DOBMP (17). Depicted are the orientations of the σ11 and σ22 components of the phosphorus chemical shift tensor (20,41). For a PC or PG head group that tilts ∼30° from the director axis, Δσ values of −40 to −45 ppm are expected for Lα phase bilayers near room temperature (42). The small value of Δσ for BMP dispersions can be understood by comparing the structures of DOPG to DOBMP. Note that these two molecules are isoforms, with differing locations of attachment for the acyl chains. In traditional phospholipids, such as DOPG, the dioleoyl chains are attached to the sn-1 and sn-2 positions of the glycerol backbone while the glycerol head group projects into the aqueous solution. However, in the structure of DOBMP, the second acyl chain is not on the sn-2 position of the glycerol backbone but on the sn-1 position of the glycerol head group. Consider that if you start with the structure and orientation of the head group in DOPG and move the acyl chain to the sn-1 position, on insertion of this second acyl chain of DOBMP into the bilayer, the phosphate group rotates in such a manner such that the σ22 component of the phosphate chemical shift tensor (located between the nonesterified oxygen atoms) becomes nearly parallel to the director axis of rotation. By simply considering a parallel alignment of the σ22 component along the director axis and the disorder of the glycerol groups to be similar to that seen in other phospholipids, a value of Δσ ≈ −23 ppm is expected (20,41,42). Our experimentally determined span of −12 ppm is smaller than this value, and the increased averaging of the tensor may result from higher disorder or wobbling of the head group with the unique diglycerol structure, as compared to other typical phospholipids, or the −12 ppm span can be generated if the σ22 component orients with a tilt angle of ∼34° with respect to the bilayer normal when the same amount of wobble in the head group is assumed using S = 0.66 for the order parameter (40).
Interestingly, the NMR results show that the head group orientation of BMP differs from that of DOPG, but the spin-labeled EPR data indicate that regardless of head group orientation, the dynamics of the dioleoyl chains remains the same. Perhaps this altered orientation of the phosphate group provides a mechanism for enhanced hydrogen-bonding interactions leading to the higher melting temperatures observed for DMBMP in differential scanning calorimetry. Further, the enhanced head-group interactions may also provide the energy needed to stabilize small vesicle formation both in vitro and during VB formation in vivo in late endosomes.
The nonspherical clustered vesicle morphology observed in the TEM images of DOBMP hydrated under neutral pH in the presence of 100 mM NaCl differs from what was reported earlier for this lipid. However, we show that the absence of NaCl can account for the different morphology observed (Fig. 4). It is interesting that we observed a spherical vesicle shape under acidic conditions. In a 2004 Science report (8), the Gruenberg lab showed that intravesicular structures will spontaneously develop for lipid mixtures containing BMP when a pH gradient was established across the liposome with the interior compartment being acidic. Taken together, these data suggest that the physical properties of BMP, dictated by its unique dual glycerol structure and orientation of the phosphate group, provide a mechanism for stabilization of small vesicle structures in the maturing endosome as the lumen acidifies.
Acknowledgments
We are grateful to Dr. Randolph S. Duran for access to DLS instrumentation. The DLS instrument utilized was supported by the DARPA MODICE program. TEM images were obtained using instrumentation provided by the Interdisciplinary Center for Biotechology Research (ICBR) facility with the kind assistance of Donna Williams of the Department of Microbiology and Cell Science. We also thank Joanna R. Long and J. David Castle for helpful discussions.
The research herein was funded by National Institutes of Health R01GM077232 (G.E.F.).
Footnotes
Chad E. Mair's present address is Department of Chemistry, University of North Carolina, Chapel Hill, NC 27599-3290.
Thomas E. Frederick and Janetricks N. Chebukati contributed equally to this work.
References
- 1.Body D.R., Gray G.M. The isolation and characterization of phosphatidylglycerol and a structural isomer from pig lung. Chem. Phys. Lipids. 1967;1:254–263. [Google Scholar]
- 2.Kolter T., Sandhoff K. Principles of lysosomal membrane digestion: stimulation of sphingolipid degradation by sphingolipid activator proteins and anionic lysosomal lipids. Annu. Rev. Cell Dev. Biol. 2005;21:81–103. doi: 10.1146/annurev.cellbio.21.122303.120013. [DOI] [PubMed] [Google Scholar]
- 3.Kobayashi T., Beuchat M.H., Chevallier J., Makino A., Mayran N. Separation and characterization of late endosomal membrane domains. J. Biol. Chem. 2002;277:32157–32164. doi: 10.1074/jbc.M202838200. [DOI] [PubMed] [Google Scholar]
- 4.Kobayashi T., Stang E., Fang K.S., de Moerloose P., Parton R.G. A lipid associated with the antiphospholipid syndrome regulates endosome structure and function. Nature. 1998;392:193–197. doi: 10.1038/32440. [DOI] [PubMed] [Google Scholar]
- 5.Kobayashi T., Startchev K., Whitney A.J., Gruenberg J. Localization of lysobisphosphatidic acid-rich membrane domains in late endosomes. Biol. Chem. 2001;382:483–485. doi: 10.1515/BC.2001.059. [DOI] [PubMed] [Google Scholar]
- 6.Mullock B.M., Hinton R.H., Peppard J.V., Slot J.W., Luzio J.P. The preparative isolation of endosome fractions: a review. Cell Biochem. Funct. 1987;5:235–243. doi: 10.1002/cbf.290050402. [DOI] [PubMed] [Google Scholar]
- 7.Kobayashi T., Gu F., Gruenberg J. Lipids, lipid domains and lipid-protein interactions in endocytic membrane traffic. Semin. Cell Dev. Biol. 1998;9:517–526. doi: 10.1006/scdb.1998.0257. [DOI] [PubMed] [Google Scholar]
- 8.Matsuo H., Chevallier J., Mayran N., Le Blanc I., Ferguson C. Role of LBPA and Alix in multivesicular liposome formation and endosome organization. Science. 2004;303:531–534. doi: 10.1126/science.1092425. [DOI] [PubMed] [Google Scholar]
- 9.Gennis R.B. In: Biomembranes Molecular Structure and Function. Cantor C.R., editor. Springer-Verlag; New York: 1989. [Google Scholar]
- 10.Yeagle P.L. CRC Press; New York: 2005. The Structure of Biological Membranes. [Google Scholar]
- 11.Brotherus J., Renkonen O., Fischer W., Herrmann J. Novel stereoconfiguration in lyso-bis-phosphatidic acid of cultured BHK-cells. Chem. Phys. Lipids. 1974;13:178–182. doi: 10.1016/0009-3084(74)90034-6. [DOI] [PubMed] [Google Scholar]
- 12.Joutti A. The stereoconfiguration of newly formed molecules of bis(monoacylglycero)phosphate in BHK cells. Biochim. Biophys. Acta. 1979;575:10–15. doi: 10.1016/0005-2760(79)90125-5. [DOI] [PubMed] [Google Scholar]
- 13.Joutti A., Brotherus J., Renkonen O., Laine R., Fischer W. The stereochemical configuration of lysobisphosphatidic acid from rat liver, rabbit lung and pig lung. Biochim. Biophys. Acta. 1976;450:206–209. doi: 10.1016/0005-2760(76)90092-8. [DOI] [PubMed] [Google Scholar]
- 14.Joutti A., Renkonen O. The structure of phosphatidyl glycerol prepared by phospholipase D-catalyzed transphosphatidylation from egg lecithin and glycerol. Chem. Phys. Lipids. 1976;17(2–3 Special No.):264–266. doi: 10.1016/0009-3084(76)90071-2. [DOI] [PubMed] [Google Scholar]
- 15.Joutti A., Renkonen O. The stereoconfiguration of bis(monoacylglycero)phosphate synthesized in vitro in lysosomes of rat liver: comparison with the natural lipid. J. Lipid Res. 1979;20:840–847. [PubMed] [Google Scholar]
- 16.Joutti A., Renkonen O. The stereochemical configuration of lysosomal phosphatidylcholine and phosphatidylethanolamine: comparison with lysobisphosphatidic acid. J. Lipid Res. 1979;20:230–233. [PubMed] [Google Scholar]
- 17.Hayakawa T., Hirano Y., Makino A., Michaud S., Lagarde M. Differential membrane packing of stereoisomers of bis(monoacylglycero)phosphate. Biochemistry. 2006;45:9198–9209. doi: 10.1021/bi060722o. [DOI] [PubMed] [Google Scholar]
- 18.Hayakawa T., Makino A., Murate M., Sugimoto I., Hashimoto Y. pH-dependent formation of membranous cytoplasmic body-like structure of ganglioside G(M1)/bis(monoacylglycero)phosphate mixed membranes. Biophys. J. 2007;92:L13–L16. doi: 10.1529/biophysj.106.098657. [DOI] [PMC free article] [PubMed] [Google Scholar]
- 19.Boggs J.M., Hsia J.C. Orientation and motion of amphiphilic spin labels in hexagonal lipid phases. Proc. Natl. Acad. Sci. USA. 1973;70:1406–1409. doi: 10.1073/pnas.70.5.1406. [DOI] [PMC free article] [PubMed] [Google Scholar]
- 20.Herzfeld J., Griffin R.G., Haberkorn R.A. Phosphorus-31 chemical-shift tensors in barium diethyl phosphate and urea-phosphoric acid: model compounds for phospholipid head-group studies? Biochemistry. 1978;17:2711–2718. doi: 10.1021/bi00607a003. [DOI] [PubMed] [Google Scholar]
- 21.Hubbell W.L., McConnell H.M. Orientation and motion of amphiphilic spin labels in membranes. Proc. Natl. Acad. Sci. USA. 1969;64:20–27. doi: 10.1073/pnas.64.1.20. [DOI] [PMC free article] [PubMed] [Google Scholar]
- 22.Hubbell W.L., McConnell H.M. Molecular motion in spin-labeled phospholipids and membranes. J. Am. Chem. Soc. 1971;93:314–326. doi: 10.1021/ja00731a005. [DOI] [PubMed] [Google Scholar]
- 23.Seelig J. Deuterium magnetic resonance: theory and application to lipid membranes. Q. Rev. Biophys. 1977;10:353–418. doi: 10.1017/s0033583500002948. [DOI] [PubMed] [Google Scholar]
- 24.Trudell, J.R., W.L. Hubbell, and E.N. Cohen. Electron spin resonance studies with the volatile anesthetics on phospholipid model membranes. Ann. N.Y. Acad. Sci. 222:530–539. [DOI] [PubMed]
- 25.Seelig A., Seelig J. The dynamic structure of fatty acyl chains in a phospholipid bilayer measured by deuterium magnetic resonance. Biochemistry. 1974;13:4839–4845. doi: 10.1021/bi00720a024. [DOI] [PubMed] [Google Scholar]
- 26.Gruner S.M., Cullis P.R., Hope M.J., Tilcock C.P. Lipid polymorphism: the molecular basis of nonbilayer phases. Annu. Rev. Biophys. Biophys. Chem. 1985;14:211–238. doi: 10.1146/annurev.bb.14.060185.001235. [DOI] [PubMed] [Google Scholar]
- 27.Gaffney B.J., Drachman D.B., Lin D.C., Tennekoon G. Spin-label studies of erythrocytes in myotonic dystrophy: no increase in membrane fluidity. Neurology. 1980;30:272–276. doi: 10.1212/wnl.30.3.272. [DOI] [PubMed] [Google Scholar]
- 28.Marsh D., Watts A., Pates R.D., Uhl R., Knowles P.F. ESR spin-label studies of lipid-protein interactions in membranes. Biophys. J. 1982;37:265–274. doi: 10.1016/S0006-3495(82)84675-4. [DOI] [PMC free article] [PubMed] [Google Scholar]
- 29.Esmann M., Hideg K., Marsh D. Novel spin-labels for the study of lipid-protein interactions. Application to (Na+, K+)-ATPase membranes. Biochemistry. 1988;27:3913–3917. doi: 10.1021/bi00411a004. [DOI] [PubMed] [Google Scholar]
- 30.Korstanje L.J., van Faassen E.E., Levine Y.K. Reorientational dynamics in lipid vesicles and liposomes studied with ESR: effects of hydration, curvature and unsaturation. Biochim. Biophys. Acta. 1989;982:196–204. doi: 10.1016/0005-2736(89)90055-2. [DOI] [PubMed] [Google Scholar]
- 31.Bartucci R., Pali T., Marsh D. Lipid chain motion in an interdigitated gel phase: conventional and saturation transfer ESR of spin-labeled lipids in dipalmitoylphosphatidylcholine-glycerol dispersions. Biochemistry. 1993;32:274–281. doi: 10.1021/bi00052a035. [DOI] [PubMed] [Google Scholar]
- 32.Glasgow B.J., Gasymov O.K., Abduragimov A.R., Yusifov T.N., Altenbach C. Side chain mobility and ligand interactions of the G strand of tear lipocalins by site-directed spin labeling. Biochemistry. 1999;38:13707–13716. doi: 10.1021/bi9913449. [DOI] [PubMed] [Google Scholar]
- 33.Duzgunes N. Fluorescence assays for liposome fusion. Methods Enzymol. 2003;372:260–274. doi: 10.1016/S0076-6879(03)72015-1. [DOI] [PubMed] [Google Scholar]
- 34.Holopainen J.M., Soderlund T., Alakoskela J.M., Saily M., Eriksson O. Intermolecular interactions of lysobisphosphatidic acid with phosphatidylcholine in mixed bilayers. Chem. Phys. Lipids. 2005;133:51–67. doi: 10.1016/j.chemphyslip.2004.08.004. [DOI] [PubMed] [Google Scholar]
- 35.Ladokhin A.S., Wimley W.C., Hristova K., White S.H. Mechanism of leakage of contents of membrane vesicles determined by fluorescence requenching. Methods Enzymol. 1997;278:474–486. doi: 10.1016/s0076-6879(97)78025-x. [DOI] [PubMed] [Google Scholar]
- 36.Matsuzaki K., Harada M., Handa T., Funakoshi S., Fujii N. Magainin 1-induced leakage of entrapped calcein out of negatively-charged lipid vesicles. Biochim. Biophys. Acta. 1989;981:130–134. doi: 10.1016/0005-2736(89)90090-4. [DOI] [PubMed] [Google Scholar]
- 37.Neiderberger W., Seelig J. Phosphorus-31 chemical shift anisotropy in unsonicated phospholipid bilayers. J. Am. Chem. Soc. 1976;98:3704–3706. doi: 10.1021/ja00428a053. [DOI] [PubMed] [Google Scholar]
- 38.Seelig J., Macdonald P.M., Scherer P.G. Phospholipid head groups as sensors of electric charge in membranes. Biochemistry. 1987;26:7535–7541. doi: 10.1021/bi00398a001. [DOI] [PubMed] [Google Scholar]
- 39.Gally H.U., Niederberger W., Seelig J. Conformation and motion of the choline head group in bilayers of dipalmitoyl-3-sn-phosphatidylcholine. Biochemistry. 1975;14:3647–3652. doi: 10.1021/bi00687a021. [DOI] [PubMed] [Google Scholar]
- 40.Seelig J. 31P nuclear magnetic resonance and the head group structure of phospholipids in membranes. Biochim. Biophys. Acta. 1978;515:105–140. doi: 10.1016/0304-4157(78)90001-1. [DOI] [PubMed] [Google Scholar]
- 41.Griffin R.G., Powers L., Pershan P.S. Head-group conformation in phospholipids: a phosphorus-31 nuclear magnetic resonance study of oriented monodomain dipalmitoylphosphatidylcholine bilayers. Biochemistry. 1978;17:2718–2722. doi: 10.1021/bi00607a004. [DOI] [PubMed] [Google Scholar]
- 42.Scherer P.G., Seelig J. Electric charge effects on phospholipid headgroups. Phosphatidylcholine in mixtures with cationic and anionic amphiphiles. Biochemistry. 1989;28:7720–7728. doi: 10.1021/bi00445a030. [DOI] [PubMed] [Google Scholar]