

Abstract
Channelrhodopsin 2 (ChR2), a light-activated nonselective cationic channel from Chlamydomonas reinhardtii, has become a useful tool to excite neurons into which it is transfected. The other ChR from Chlamydomonas, ChR1, has attracted less attention because of its proton-selective permeability. By making chimeras of the transmembrane domains of ChR1 and ChR2, combined with site-directed mutagenesis, we developed a ChR variant, named ChEF, that exhibits significantly less inactivation during persistent light stimulation. ChEF undergoes only 33% inactivation, compared with 77% for ChR2. Point mutation of Ile170 of ChEF to Val (yielding “ChIEF”) accelerates the rate of channel closure while retaining reduced inactivation, leading to more consistent responses when stimulated above 25 Hz in both HEK293 cells and cultured hippocampal neurons. In addition, these variants have altered spectral responses, light sensitivity, and channel selectivity. ChEF and ChIEF allow more precise temporal control of depolarization, and can induce action potential trains that more closely resemble natural spiking patterns.
Introduction
Channelrhodopsins 1 and 2 (ChR1 and ChR2) from Chlamydomonas reinhardtii are small membrane channels gated directly by light (1,2). With both channels, the expression of the N-terminal transmembrane domains of the apoproteins Channelopsin 1 (Chop1) and Channelopsin 2 (Chop2) are sufficient for the formation of functional channels in mammalian cells when all-trans-retinal is present. Chop1 and Chop2 share 65% sequence homology in transmembrane domains (2), and there are several functional differences between them and the two ChRs. Significant photocurrent is detected through ChR1 only when extracellular pH is lowered, which led to the previous conclusion that ChR1 is more selective for protons than other cations (1). The action spectrum of ChR1 peaks at 500 nm and is red-shifted compared to the 460 nm peak for ChR2. In the presence of persistent light, ChR1 shows less inactivation than ChR2 (1,2).
Of the two ChR proteins from Chlamydomonas, ChR2 has been receiving the most attention as a neuroscientific tool because the heterologously expressed Chop2 naturally incorporates endogenous all-trans-retinal to form functional ChR2 in the mammalian nervous system, allowing experimenters to selectively excite genetically targeted neurons with blue light (3–5) and without exogenous cofactors. Several studies have demonstrated the utility of ChR2 for mapping neurocircuitry (3,6), inducing synaptic plasticity (7), restoring vision in rhodopsin-deficient animals (5), and studying behavior in free-moving animals (8). Although ChR2 has been shown to control neuronal excitability, one of the limitations of ChR2 arises from its rapid inactivation. ChR2 often fails to induce high-fidelity action potentials exceeding 30 Hz because the responses to subsequent light exposure decline significantly after the initial response due to the inactivation (3,4,9–11). The reduced inactivation of ChR1 is a more desirable property for ChR, as a lower level of inactivation leads to more consistent responses with repetitive stimulations. However, ChR1 is inadequate to control neuronal excitability because the number of protons that permeate the channel is insufficient to depolarize neurons above threshold at physiological pH.
In this study we aimed to engineer ChR variants with improved properties for control of neuronal excitability. We also characterized the basic properties of the variants and made parallel comparisons with ChR2 because these properties are important information for neuroscientists applying these tools. We engineered the ChR variants by making chimeras of Chop1 and Chop2 and mutating residues around the retinal-binding pockets of the chimeras. The chimera with a crossover site at loop E-F (ChEF) retains the reduced inactivation of ChR1 in the presence of persistent light, but allows the permeation of sodium and potassium ions in addition to protons. A variant of ChEF with isoleucine 170 mutated to valine (ChIEF) improves the kinetics of the channel by enhancing the rate of channel closure after stimulation. Both variants of ChRs exhibit more consistent response to repetitive light stimulation above 25 Hz, with ChIEF exhibiting the most distinct and consistent responses at 50 Hz and above. These ChR variants can control membrane depolarization with greater temporal precision than ChR2. To our knowledge, this is also the first demonstration of a ChR variant that has been artificially engineered to serve as an improved tool for neuroscientific research.
Materials and Methods
Molecular cloning
The Chop1 and Chop2 coding sequences, provided by Dr. Rene Meijer, were truncated at amino acids 349 and 319, respectively. The ChRs were fused to mCherry at the C-termini through an EcoRI site, and the construct was inserted into pcDNA3 vector between HindIII and XbaI sites. For the enhanced green fluorescence protein (EGFP) construct, EGFP was fused to the ChR with overlapping polymerase chain reaction (PCR) using Phusion (NEB, Woburn, MA) with an XhoI site between the EGFP and ChR coding sequences. The ChR chimera and point mutations were also made with overlapping PCR. For transfected neuron recordings, ChIEF fused to EGFP or mCherry was subcloned into a pCAGGS vector previously used for in utero electroporation of ChR2 into cortical neurons (6). The vector and codon-optimized ChR2/H134R were provided by Dr. Karel Svoboda, HHMI Janelia Farm Research Institute. For the experiment with lower expression (see Fig. 5), the two flanking introns of the pCAGGS vectors were removed.
Figure 5.
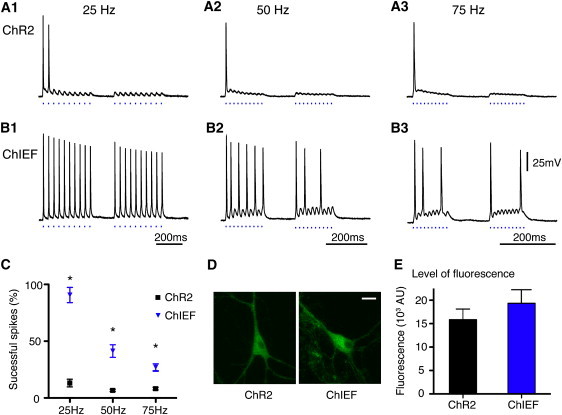
Comparisons of action potential inducing fidelity of ChR2 and ChIEF in transfected neurons. Typical responses of ChR2 (A) and ChIEF (B) transfected cultured hippocampal neurons to 25 Hz (A1 and B1), 50 Hz (A2 and B2), and 75 Hz (A3 and B3) of pulsed light stimulation (470 nm, 19.8 mW/mm2, 4 ms). (C) Summary of the percentage of successful action potentials induced in ChR2- and ChIEF-transfected neurons. (D) Maximum projection confocal images of ChR2-EGFP and ChIEF-EGFP expressing cultured hippocampal neurons. (E) The integrated fluorescence values of ChR2-EGFP (n = 10) and ChIEF-EGFP (n = 11) expressing neurons measured from a square 21.73μm2 area in the soma at the in-focus optical slice of the neurons at the interface between the cell and the coverslip. In C, ∗ indicates significance at the 0.01% level (ChR2, n = 10; ChIEF, n = 9). Scale bar in D: 20 μm.
Cell culture and electrophysiology recording
HEK293 cells were cultured in DMEM medium with 10% fetal bovine serum and 1% penicillin/streptomycin (Invitrogen, Carlsbad, CA) and plated on poly-D-lysine-coated coverslips for recordings. Cells were transfected using Fugene HD reagent (Roche, Basel, Switzerland) or calcium-phosphate precipitation (Clontech, Mountain View, CA) 2–3 days before recording was performed.
Hippocampal neurons were dissected from postnatal day 0 or 1 rat pups and plated on poly-D-lysine-coated glass coverslips. Transfection of neuronal cultures was performed with Amaxa Nucleofector (Gaithersburg, MD) electroporation before plating. Neurons were cultured in Neurobasal medium supplemented with B27 and Glutamax (Invitrogen). The neuronal recordings were performed after 19–22 days in culture to ensure maturation of firing properties.
Electrophysiological recordings of HEK293 were performed with an Axopatch 200A or 200B amplifier (Molecular Devices, Union City, CA) at room temperature. In most cells, the series resistance was compensated up to 75%. The signals were digitized with Digidata 1322A and recorded with pCLAMP 9 software (Molecular Devices) on a PC. Data analysis was done with AxoGraph X (AxoGraphX, Sydney, Australia) and/or pCLAMP 9. For most experiments, the standard extracellular solution consisted of (in mM) 145 NaCl, 3 KCl, 2 CaCl2, 1 MgCl2, 10 HEPES, and 20 glucose (pH 7.35, 310 mOsm). The intracellular solution consisted of (in mM) 110 Cs methanesulfonate, 30 tetraethylammonium chloride, 10 EGTA, 2 MgCl2, 0.1 CaCl2, and 10 mM HEPES (pH 7.25, 290 mOsm). The compositions of the extracellular solutions tested in the permeability experiment are listed in Table 1. The pH of the 5 mM [Na+]o/pH 7.032 solution was lowered by titration with HCl. The intracellular solution contained (in mM) 115 K-gluconate, 5 NaCl, 10 KCl, 10 K4BAPTA, 10 HEPES, 2 Na2ATP, and 0.15 Na3GTP (pH 7.3). Junctional potentials were measured and corrected offline. The permeability ratios were calculated with a modified Goldman-Hodgkin-Katz (GHK) equation (12), including terms for Na+, K+, H+, and Ca2+, but not Mg2+, since Mg2+ has been shown to be impermeable through ChR (2). The proton concentrations were calculated as (10-pH)/0.78, where 0.78 is the activity coefficient at 25°C. The permeability ratios were calculated by least-squares curve-fitting in MathCad (Needham, MA). Chang's (12) modification of the GHK equation was used to simplify the inclusion of Ca2+, but it assumes that divalent cations cause only a small perturbation of reversal potentials that remain dominated by monovalent ions. The reversal potentials calculated from the modified GHK equation with the fitted permeability ratios differed only slightly (<4.5 mV) from the reversal potentials calculated from the standard GHK equation (13) with the same permeability ratios, demonstrating that Chang's assumption was reasonably valid in our case.
Table 1.
Compositions of the extracellular solutions used in permeability experiments
| Solution description | NaCl (mM) | KCl (mM) | CaCl2 (mM) | MgCl2 (mM) | NMDG (mM) | HEPES (mM) | Glucose (mM) | pH |
|---|---|---|---|---|---|---|---|---|
| 145 mM [Na+]o | 145 | 3 | 0 | 0 | 4.5 | 10 | 20 | 7.35 |
| 5 mM [Na+]o | 5 | 3 | 0 | 0 | 144.5 | 10 | 20 | 7.35 |
| 5 mM [Na+]o, 25 mM [K+]o | 5 | 25 | 0 | 0 | 122.5 | 10 | 20 | 7.35 |
| 5 mM [Na+]o, pH 7.032 | 5 | 3 | 0 | 0 | 144.5 | 10 | 20 | 7.032 |
| 5 mM [Na+]o, 80 mM [Ca2+]o, | 5 | 3 | 80 | 0 | 24.5 | 10 | 20 | 7.35 |
| 118mM [Na+]o, 20 mM [Ca2+]o | 118 | 3 | 20 | 1 | 0 | 10 | 20 | 7.35 |
NMDG, N-methyl-D-glucamine.
Light stimulation was provided either by a Polychrome IV light source (T.I.L.L. Photonics GMBH, Grafelfing, Germany) with a mechanical shutter (Unibliltz VS25, Vincent Associates, Rochester, NY) or a custom-made light-emitting diode (LED) system (Luxeon, San Jose, CA). Light was reflected off a mirror to the specimen through a water immersion lens with numerical aperture of 1.13 (Nikon). In the experiments using the Polychrome IV light source, 570 nm or 550 nm light was used to “reset” the states of ChR 10 s before subsequent stimulation for consistent comparisons. For preliminary testing of the chimeras and preconditioning experiments, 11.5 mW/mm2 of 470 nm light from the Polychrome IV light source was used for stimulation. For measurement of the spectral response of the ChRs, a neutral density wheel (Thorlab, Newton, NJ) was fitted into the light path of the Polychrome IV light source and adjusted to provide the 1.707 × 10¹⁰ photon/s/μm2 at different wavelengths across the spectrum.
For nonstationary fluctuation analysis (14), transfected HEK cells were stimulated with 50–75 pulses (20 ms duration) of light with 10 s intervals. The mean response and trial-to-trial variance for each cell was calculated with AxographX and exported into Graphpad Prism 4.0 (Graphpad, San Diego, CA) and curve-fitted with a least-squares error algorithm.
Patch-clamp recordings of cultured hippocampal neurons were performed with an Axopatch 200B amplifier under current-clamp mode. For recordings, the pipette contained 125 mM potassium gluconate, 10 mM HEPES, 10 mM BAPTA tetrapotassium salt, 5 mM NaCl, 1 mM CaCl2, 2mM MgATP, and 0.3mM Na3GTP. The extracellular solutions were the same as in the HEK293 cells, with the addition of 10 μM NBQX, 10 μM bicuculline, and 50 μM APV (Tocris, Bristol, UK). ChRs in neurons were stimulated with 4 ms of 19.8 mW/mm2 blue LED light for low expression levels (e.g., see Fig. 5) and 0.25–0.5 ms of blue LED light at the indicated intensities (e.g., see Fig. 6) at high expression levels. Only cells that achieved action potential firing at the first stimulation pulse were included for analysis for both groups.
Figure 6.
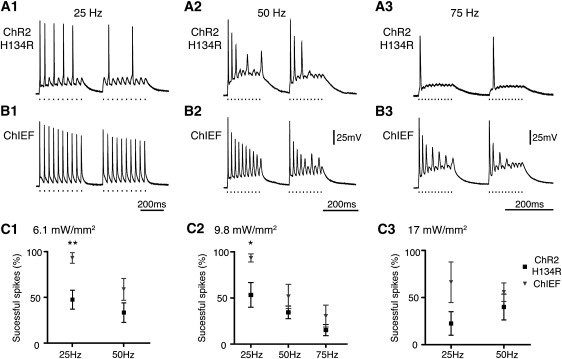
Comparisons of action potential inducing fidelity of ChR2/H134R and ChIEF in transfected neurons at high level of expression. Typical responses of ChR2/H134R (A) and ChIEF (B) transfected cultured hippocampal neurons to 25 Hz (A1 and B1), 50 Hz (A2 and B2), and 75 Hz (A3 and B3) of pulsed light stimulation (470 nm, 9.8 mW/mm2, 0.5 ms). (C) Summary of the percentage of successful action potentials induced in ChR2/H134R- and ChIEF-transfected neurons at 6.1 mW/mm2 (C1), 9.8 mW/mm2 (C2), and 17 mW/mm2 (C3) of stimulating light intensity. In C1, ∗∗ indicates significance at the 0.05% level; in C2, ∗ indicates significance at the 5% level.
Fura-2 calcium imaging, SNARF-5F pH imaging, and confocal imaging
Fura-2 AM (5μM; Invitrogen) was loaded at room temperature for 30 min. After loading, the cells were incubated in Hank's balanced salt solution during recovery. For imaging, the solution was replaced by an extracellular solution that consisted of (in mM) 80 CaCl2, 20 glucose, 23 N-methyl-D-glucamine, 5 NaCl, 3 KCl, 1 MgCl2, and 10 HEPES. ChR stimulation was provided by transillumination light filtered through a 470/40 nm filter (Chroma, Rockingham, VT). Fura-2 was excited with 350 and 380 nm of light through a 1% or 2.5% neutral density filter to avoid stimulation of ChR during imaging.
SNARF-5F AM (5 μM; Invitrogen) was loaded at room temperature for 30 min. After loading, the cells were washed with Hank's balanced salt solution during recovery. For imaging, the solution was replaced by an extracellular solution that consisted of (in mM) 1 CaCl2, 20 glucose, 145 NaCl, 3 KCl, 1 MgCl2, and 10 HEPES (pH 7.35). SNARF-5F and ChR-EGFP transfected cells were imaged in the following order: 653 nm (653/95 nm filter; 200 ms exposure time), 595 nm (595/50 nm filter; 500 ms exposure time), and 535 nm for EGFP (535/25 nm filter). A 495 nm excitation light (495/10 nm filter, 10% neutral density filter) was used to acquire all three images. For offline correction of EGFP fluorescence in the 595 nm and 653 nm channel, images of cytosolic EGFP expressing HEK293 cells were acquired with the same settings and used for correction. The validity of the correction algorithm was confirmed with cytosolic EGFP-expressing cells loaded with SNARF-5F AM, and the corrected pH values of EGFP-expressing cells were not significantly different from those of untransfected cells. The pH was calibrated with solutions (pH 6.5–8) containing 110 mM K-gluconate, 10 mM NaCl, 25 mM KCl, 1 mM MgCl2, 10 mM HEPES, and 20 μM nigericin (Invitrogen). Cells were allowed to equilibrate for 10–20 min before imaging for calibration.
For confocal imaging of ChR-mCherry fusions, transfected HEK cells were plated on poly-D-lysine-coated coverslips and imaged on a Zeiss LSM 5Live confocal microscope (Zeiss, Thornwood, NY). Relative levels of membrane expression in HEK293 cells were measured by tracing ∼20 μm of the in-focus cell membrane in a single optical slice (0.53 μm thick) and averaging the fluorescence intensity in the traces from multiple cells. Because the transfected neurons showed much more irregular perimeters than the HEK293 cells, the relative membrane expression of ChR-EGFP in neurons was assessed by integrating the pixel intensity of a 21.73 μm2 square in an optical slice (0.53 μm thick) that included the plasma membrane of the soma immediately above the coverslip.
Statistical analysis
All analyses were performed with Graphpad Prism 4.0 or Instat 3.0 (Graphpad, San Diego, CA). For comparisons of the mean current amplitudes and inactivation levels of ChR1, ChR2, and the three chimeras, a one-way analysis of variance (ANOVA) was used followed by Student's t-test with Bonferroni's correction between all pairs. For comparisons of kinetic and EC50 values, sigmoidal intensity-response profiles are fitted for each cell, and the estimated EC50, maximum, minimum values were averaged and compared. These values were compared by means of an ANOVA followed by Student's t-test with Bonferroni's correction between all pairs. For fitting of time constants, single-exponential fits were used for on-rate, off-rate, and rate of inactivation for simplicity. All graphs are shown as mean ± standard error of the mean (SEM).
Results
Three chimeras of Chop1 and Chop2 were constructed by retaining the N-terminal portion of Chop1 and replacing the C-terminal portion with the corresponding segment of Chop2. We chose Chop2 for the C-terminal segment because the bacteriorhodopsin crystal structure shows that most of the residues that mediate ion transfer are located on transmembrane helices F and G (15). The three crossover sites were chosen at the point of homology at helix D (chimera D or ChD), the loop between helices E and F (chimera E-F or ChEF), or near the end of helix F (chimera F or ChF) (Fig. 1 A). All three chimeras were fused at their cytoplasmic C-terminus to the red fluorescent protein mCherry (16), whose fluorescence verified expression at the plasma membrane (Fig. 1 B). Light-induced current was detected in all three chimeras, with responses of ChD and ChEF exceeding those of ChR1 (Fig. 1 C). ChF yielded only a small current at the condition tested, identical to the typical responses of wild-type ChR1 (Fig. 1 C). The results suggest that chimeras with helices F and G from Chop2 allow the permeation of ions other than protons. With 500 ms of 470 nm light stimulation, the sustained plateau of ChR2 current was 23.0% ± 1.4% of its initial maximum response (n = 11; Fig. 1, C1 and D2), i.e., 77% of the initial current was inactivated. With the same stimulation condition, ChD and ChEF plateau currents were 33.1% ± 1.4% (n = 9) and 66.5% ± 4.2% (n = 8) of their respective maximum responses (Fig. 1, C2 and D2). The amount of inactivation of ChEF is identical to that previously reported for ChR1 at low pH (2,17). To confirm that ChEF allows the permeation of cations other than protons, we measured reversal potentials of ChR2 and ChEF at varied [Na+]o and [K+]o concentrations at pH 7.35, and detected shifts in reversal potentials with both ChRs when [Na+]o and [K+]o were varied (Fig. 1 E and Table 2). These shifts of reversal potentials are clear indications that ChEF is permeable to sodium and potassium in addition to protons at physiological pH. We also altered extracellular chloride concentrations from 154 mM to 29 mM, but detected no significant difference in reversal potentials between ChR2 and ChEF, indicating that ChEF is impermeable to chloride, just as ChR2 is known to be (2). In previous ChR studies (1,17), the pH of the extracellular solutions was lowered to demonstrate proton permeability. Lowering the pH of the 5 mM [Na+]o solution from 7.35 to 7.032 shifted the reversal potential for ChR2 and ChEF by 14–21 mV (Table 2). To confirm proton permeability, we measured the intracellular pH of ChR2-EGFP and ChEF-EGFP transfected HEK293 cells with the pH-sensitive, ratiometric fluorescent indicator SNARF-5F. We acquired the two SNARF-5F images (595 nm and 653 nm) with excitation centered on 495 nm (total exposure time 700 ms) and assumed that the expressed ChRs were activated during the imaging of the dye. The pH of ChR2 transfected cells was 7.32 ± 0.06 (n = 16) vs. 7.63 ± 0.01 (n = 16 each; p < 0.0001) for neighboring untransfected cells. The corresponding values for ChEF-transfected versus neighboring untransfected cells were 7.23 ± 0.05 and 7.67 ± 0.03, respectively (n = 16 each; p < 0.0001). When the pH changes in the two groups were normalized to the mean membrane EGFP fluorescence of the ChR-transfected cells, the pH drops were not significantly different (0.39 ± 0.08 for ChR2 and 0.53 ± 0.09 for ChEF; p > 0.05).
Figure 1.
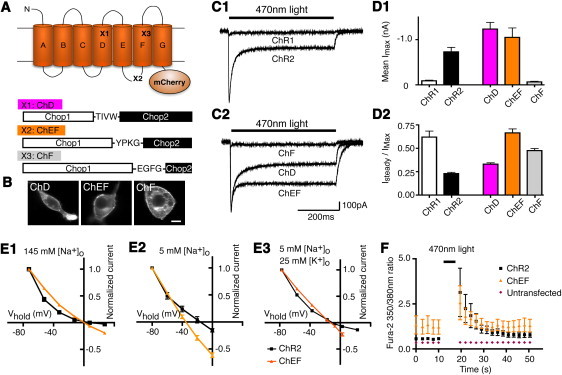
Schematic of ChR chimeras and their basic properties. (A) Schematic of ChR showing the sites of chimera crossings at the TIVW sequence of helix D (X1: ChD), VPKG sequence of the helix E-F loop (X2: ChEF), and EGFG sequence at transmembrane helix F (X3: ChF). (B) Confocal images of ChD, ChEF, and ChF expressing HEK cells with mCherry fluorescence at plasma membrane. (C) The typical responses of ChR2 (C1), ChR1 (C1), and the three chimeras (C2) in pH 7.35 saline to 500 ms of 470 nm light. The black bars above indicate the time of the light stimulation. (D) Summaries of the mean maximal response amplitudes (D1) and the plateau/maximum response ratio (D2) with ChR1 (n = 7), ChR2 (n = 11), ChD (n = 9), ChEF (n = 8), and ChF (n = 6). The mean response amplitudes of ChD and ChEF greatly exceed the mean ChR1 response but are identical to ChR2, and the level of inactivation of ChEF is comparable to ChR1 and ChF. (E) Current-voltage relationships of ChR2, and ChEF in the presence of 145 mM extracellular sodium (E1), 5 mM extracellular sodium ions (E2), and 5 mM extracellular sodium ions + 25 mM extracellular potassium (E3), showing the reversal potentials of ChR2 and ChEF at various extracellular sodium and potasium ion concentrations. (F) Fura-2 measurements of calcium in cells expressing ChR2 and ChEF to 5 s of 470 nm light in the presence of 80 mM extracellular calcium showing detectable elevation of intracellular calcium. Scale bar in B: 10 μm.
Table 2.
Summary of measured and fitted reversal potentials (Erev) of ChR2, ChEF, and ChIEF; means are ± SE
| ChR2 |
ChEF |
ChIEF |
|||
|---|---|---|---|---|---|
| Solution description | Measured Erev (mV) | Predicted Erev (mV) | Measured Erev (mV) | Predicted Erev (mV) | Measured Erev (mV) |
| 145 mM [Na+]o | 8.00 ± 0.55 (n = 5) | 8.27 | 1.37 ± 1.07 (n = 5) | 2.357 | 3.36 ± 1.70 (n = 5) |
| 5 mM [Na+]o | −21.89 ± 2.56 (n = 4) | −20.68 | −34.74 ± 1.96 (n = 5) | −29.42 | −38.62 ± 2.80 (n = 7) |
| 5 mM [Na+]o, 25 mM [K+]o | −10.12 ± 0.56 (n = 6) | −17.32 | −13.37 ± 1.11 (n = 6) | −23.51 | Not tested |
| 5 mM [Na+]o, pH 7.032 | −7.02 ± 1.75 (n = 3) | −3.15 | −13.72 ± 4.73 (n = 3) | −12.30 | Not tested |
| 5 mM [Na+]o, 80 mM [Ca2+]o, | −9.32 ± 3.74 (n = 4) | −9.30 | −14.01 ± 2.73 (n = 6) | −13.86 | Not tested |
| 118mM [Na+]o, 20 mM [Ca2+]o | 6.11 ± 3.05 (n = 5) | 5.98 | 1.45 ± 1.50 (n = 4) | 0.31 | Not tested |
ChR2 has also been reported to be permeable to calcium (2). We conducted Ca2+ imaging with fura-2 to test whether ChR2 and ChEF are permeable to Ca2+. Stimulation with 5 s of 470 nm light in 80 mM extracellular Ca2+ caused an increase in intracellular Ca2+ in cells expressing either ChR2 and ChEF (n = 8 cells in each group, ∼1.8- to 2.4-fold increase in fluorescence ratio; Fig. 1 F). We did not detect any voltage-gated Ca2+ channels in response to voltage steps in either transfected or untransfected HEK293 cells, indicating that the increase of Ca2+ was most likely mediated directly by ChRs. The responses were much reduced and less consistent when extracellular calcium was reduced to 20 mM or 2 mM. No calcium increase was detected in the six untransfected cells tested in the same field of view (Fig. 1 F). As further confirmation that calcium can permeate through the ChRs, replacement of 120 mM NMDG-chloride by 80 mM CaCl2 in the continued presence of 5 mM [Na+]o (Table 1) shifted the reversal potentials by +13 to +21 mV for ChR2 and ChEF (Table 2). We also measured the reversal potentials in a solution containing 20 mM Ca2+ (Table 2) and used those values for the subsequent calculation of relative permeability (see below).
Reversal potentials for the six extracellular solutions with varied sodium, potassium, proton, and calcium concentrations (Fig. 1 E and Table 2) were analyzed by least-squares fitting to the GHK equation as modified by Chang (12), assuming equilibration of intracellular [Na+], [K+], and [H+] with the patch pipette solution. The resulting estimates were PK/PNa = 0.427, PCa/PNa = 0.117, and PH/PNa = 1.062 × 10⁶ for ChR2, which are comparable to PK/PNa = 0.673, PCa/PNa = 0.149, and PH/PNa = 0.877 × 10⁶ for ChEF. The estimated permeability ratios of ChR2 are similar to previously reported values (2). The reversal potentials for ChR2 and ChEF back-predicted from these permeability ratios are listed in Table 2. These results indicate that transferring the last two transmembrane domains from ChR2 into ChR1 to generate ChEF confers permeability to both Na+ and K+, though the Na+:K+ selectivity remains slightly lower than that of ChR2.
ChEF's reduced level of inactivation is potentially beneficial, but after light is removed, ChEF closes noticeably more slowly than ChR2 (Fig. 1 C2, Table 3). We mapped residues around the retinal binding pocket of bacteriorhodopsin onto the ChR chimera and introduced further mutations in ChEF to improve its kinetics (15,18). Mutation of Ile170 of ChEF (corresponding to Ile131 of Chop2 and Leu93 of bacteriorhodopsin) to a Val (I170V) to generate “ChIEF” increased the rate of channel closure compared to ChEF (Fig. 2, B2 and B3) while preserving the reduced inactivation observed in ChEF (plateau 67.0% ± 2.4% of initial maximum, n = 15; Fig. 2 B3). The reversal potentials of ChIEF at 145 mM and 5 mM extracellular Na+ were identical to those of ChEF (Table 2), suggesting that the I170V mutation does not alter pore selectivity. In addition, the change of pH with prolonged activation measured with SNARF-5F (0.37 ± 0.05) is not significantly different from ChR2 and ChEF transfected cells when normalized to the mean EGFP membrane fluorescence intensity of ChR2 and ChEF.
Table 3.
Summary of the basic and kinetic properties of ChR2, ChR2 with H134R, ChD, ChEF, and ChIEF measured and estimated from the intensity-response curve projection from Figs. 2, S1, and S2
| Response spectra peak (nm) |
EC50 (mW/mm2) |
Opening rate τ (ms) |
Closing rate τ (ms) |
||||||
|---|---|---|---|---|---|---|---|---|---|
| Max. | Plateau | IPlateau / IMax | Max. | Plateau | 9.7mW /mm2 | 19.8mW/mm2 | 10 ms pulse | 500 ms pulse | |
| ChR2 (n = 7) | ∼470 | ∼450 | 0.215 ± 0.023 | 1.099 ±0.102 | 1.045 ±0.437 | 2.127 ±0.134 | 1.205 ±0.052 | 13.39 ±1.05 | 13.54 ±1.39 |
| ChR2 H134R (n = 7) | ∼450 | ∼450 | 0.387 ±0.019 ∗∗∗, ††† | 1.068 ±0.104 | 0.979 ±0.084 | 2.837 ±0.116 | 1.922 ±0.220 ∗∗∗ | 17.96 ±1.18 ∗, ††† | 17.92 ±1.37 †† |
| ChD (n = 7) | ∼450 | ∼450 | 0.306 ±0.011 ∗, ††† | 3.228 ±0.364 ∗∗∗, ††† | 1.016 ±0.119 | 2.416 ±0.179 | 1.486 ±0.081 | 7.88 ±0.34 ∗∗, ††† | 7.82 ±0.33 ∗, ††† |
| ChEF (n = 8) | ∼470 | ∼490 | 0.695 ±0.013 ∗∗∗ | 0.716 ±0.044 | 0.459 ±0.034 | 2.921 ±0.158 ∗ | 1.560 ±0.029 | 26.31 ±1.28 ∗∗∗ | 24.86 ±1.27 ∗∗∗ |
| ChIEF (n = 9) | ∼450 | ∼450 | 0.795 ±0.025 ∗∗∗,†† | 1.645 ±0.117 †† | 1.376 ±0.121 †† | 2.763 ±0.199 | 1.618 ±0.076 | 9.77 ±0.66 ††† | 11.95 ±1.01 ††† |
The mean projected maximum transient current responses of the five groups were not significantly different at −462.57 ± 154.34pA, −634.73 ± 204.01pA, −772.26 ± 157.62pA, −526.89 ± 153.51pA, and −753.44 ± 274.79pA for ChR2, ChR2/H134R, ChD, ChEF, and ChIEF respectively, suggesting that the expression levels of the five groups were comparable, assuming identical single-channel conductance. Although the Bonferroni method is used to compare all pairs of values after ANOVA, only significance at 5% (∗), 1% (∗∗), and 0.1% (∗∗∗) levels compared to ChR2, and significance at 1% (††) and 0.1% (†††) compared to ChEF are shown in the table. Values represent means ± SEM.
Figure 2.
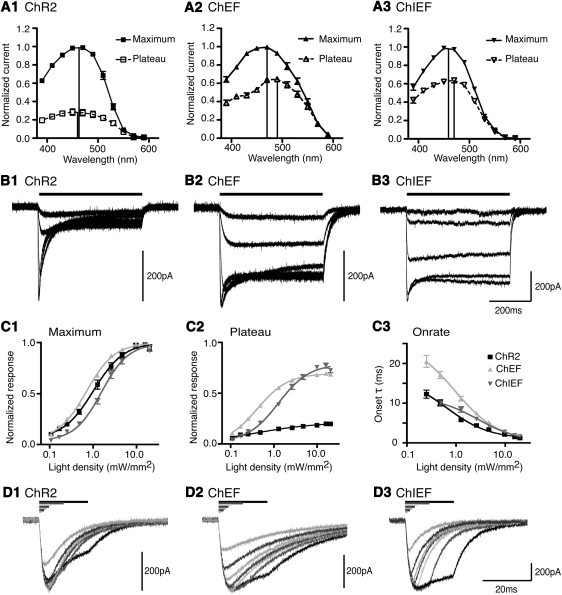
Spectral and kinetic properties of ChR variants to varying light density and duration. (A) Spectral responses of ChR2 (A1), ChEF (A2), and ChIEF (A3). The vertical lines indicate the estimated peaks. All responses normalized to the maximum response obtained from the cell tested at the various wavelengths (n = 5 for ChR2, ChEF; n = 6 for ChIEF). (B) Examples of ChR2 (B1), ChEF (B2), and ChIEF (B3) responses to 0.11, 0.48, 2.59, 9.64, and 19.81 mW/mm2 of light provided by an LED 470 nm light source. Note the faster channel closure after light removal for ChIEF compared to ChEF. (C1) The intensity-amplitude and intensity-onset (C3) relationship of ChR2 (black, n = 8), ChEF (light gray, n = 7), and ChIEF (dark gray, n = 11) for the maximum response (C1) and the plateau component of the response (C2) normalized to projected maximum response of the individual cell tested. Introduction of I170V (ChIEF) reduced the EC50 of ChEF by 2.3× (for the maximum response) and 3× (for the plateau response). (D) Responses of ChR2 (D1), ChEF (D2) and ChIEF (D3) to 1, 2, 3, 4, 5, 10, and 20 ms of light stimulation at ∼19.8 mW/mm2.
The mean maximum response amplitudes of ChR2, ChEF, and ChIEF (−731 ± 100 pA (n = 11), −1050 ± 210 pA (n = 8), and −802 ± 143 pA (n = 15), respectively) were not significantly different from each other in the transfected HEK cells (p > 0.05; Fig. 1 D1), suggesting that our ChR variants had channel conductances in a similar range. However, the amplitudes of the response are also dependent on the relative expression levels of the channels in HEK cells. We took two approaches to resolve this issue. First, we measured the relative membrane mCherry fluorescence of the various ChR-transfected cells. These values were not significantly different from each other (mean fluorescence of 364 ± 94 arbitrary units (AU) (n = 13), 524 ± 57AU (n = 20) and 411 ± 73AU (n = 14) for ChR2, ChEF, and ChIEF, respectively). However, estimating channel conductance with fluorescence measurements and total currents is prone to many errors. Variations in the precise membrane localization, properties of fused fluorescent proteins, contamination of membrane fluorescence signal with intracellular fluorescence, and fractions of nonfunctional channels in the membrane can introduce major errors. An independent second approach is to estimate the unitary channel currents of the three ChR variants from nonstationary fluctuation analysis (14), as this approach registers only functional channels in the plasma membrane during stimulation (Fig. 3). The ranges of the estimated unitary currents of ChR2, ChEF, and ChIEF were −0.020pA to −0.200 pA, −0.059 to −0.127 pA, and −0.042 to −0.186 pA, respectively. The respective means of −0.092 ± 0.022 pA (n = 8), −0.090 ± 0.012 pA (n = 6), and −0.106 ± 0.019 pA (n = 9) were not significantly different from each other. By measuring the reversal potentials and assuming the conductances to be ohmic, we estimated single-channel conductances to be ∼1.1 pS, with ranges from 0.25 to 2.42 pS for ChR2, 0.74 to 1.58 pS for ChEF, and 0.54 to 2.41 pS for ChIEF.
Figure 3.
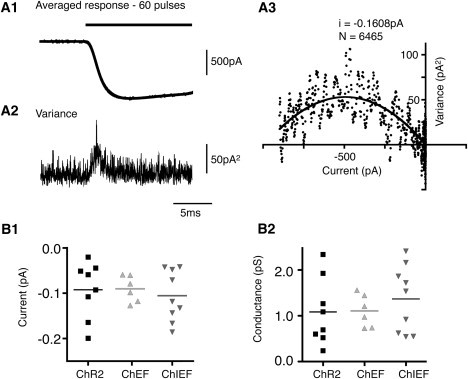
Nonstationary fluctuation analysis of ChR2, ChEF, and ChIEF. (A) An example of nonstationary fluctuation analysis of ChIEF. The mean (A1) and variance (A2) of ChIEF were obtained from 60 pulses of 470 nm light 10 s apart. (A3) The mean-variance plot and the least-squares fitted curve of ChIEF obtained from the up-slope of the response. (B) The estimated single-channel currents of ChR2 (−0.092 ± 0.022pA; n = 8), ChEF (−0.0965 ± 0.012pA; n = 6), and ChIEF (−0.113 ± 0.020 pA; n = 9) (B1) and estimated single-channel conductance calculated assuming ohmic conductance (1.084 ± 0.258 pS for ChR2, 1.185 ± 0.150 pS for ChEF and 1.463 ± 0.253 pS for ChIEF) (B2). The electromotive force used for estimating single-channel conductance was measured to be ∼87 mV for ChR2 and ∼82 mV for the chimeric channels.
ChR1 is reported to have a red-shifted response spectrum, with a peak in response at 500 nm compared to 460 nm for ChR2 (1,2). We stimulated ChR2, ChEF, and ChIEF with light pulses of constant photon intensity, 1.465 × 10¹⁰ photons/μm2/s, while varying wavelengths from 590 nm to 390 nm at 20 nm intervals. We measured the maximal response during the 500 ms of light stimulation at each wavelength and the response after 450 ms of persistent light (defined as the plateau response), and normalized each to the maximal response of the individual cell across the spectrum. The maximum responses of ChR2, ChEF, and ChIEF peaked at ∼460 nm, ∼470 nm, and ∼460 nm, whereas the plateau responses peaked at ∼450 nm, ∼490 nm, and ∼470 nm, respectively (Fig. 2 A). Overall, ChEF had a slightly red-shifted and wider response spectrum than ChR2, but ChIEF reverted toward ChR2. We also characterized ChD and the H134R mutant of ChR2, which was previously reported to have a reduced level of inactivation (19,20). The response spectra of ChR2/H134R (see Fig. S1 C in the Supporting Material) and ChD (Fig. S2 C) were generally similar to that of ChR2. However, ChD had a slightly narrower spectrum and reduced response in the UV range; its response to 390 nm light was 48% ± 1.6% (n = 3) of maximum, significantly less (p = 0.0005) than that for ChR2, 63% ± 1.1% (n = 4).
To investigate the kinetics and intensity dependence of ChRs more precisely, we switched to illumination with an LED with on/off times of 10 μs verified with a fast photodiode. The results are summarized in Table 3. The introduction of I170V increased the maximum and plateau EC50's of ChEF to light (Fig. 2 C). The H134R mutation modestly reduced the level of inactivation of ChR2 (Fig. S1 D2 and Table 3), but the improvement was much less than in ChEF or ChIEF. The onset rates of all ChR variants increased with increasing light intensity (Figs. 2 C3, S1 E, and S2 E). At 9.6 and 19.8 mW/mm2 light intensity, the activating time constants of all ChRs were below 3 and 2 ms, respectively. The rates of channel closure were independent of stimulus intensity (Fig. 2 B) or duration (Fig. 2 D), with closure time constants for ChD < ChIEF < ChR2 < ChR2/H134R < ChEF (Table 3). This result contradicts previous reports that the closure time constant for ChR2 depends on stimulus duration (9) and intensity (5). We also tested the effects of changing stimulus duration on the induced responses. All ChR variants reached maximum response with 10 ms of 19.8 mW/mm2 (Figs. 2D, S1 B, and S2 B). With 20 ms stimulation, ChR2, ChR2 with H134R, and ChD exhibited rapid inactivation during the presence of light after the peak responses were reached (Figs. 2 D, S1 B, and S2 B), whereas the inactivation was much slower with ChEF (Fig. 2 D2) and ChIEF (Fig. 2 D3).
We investigated the effect of varying interpulse intervals on recovery of the inactivated responses of ChR2, ChEF, and ChIEF. With ChR2, the recovery of the peak response was complete within 25 s, with 50% recovery at 5.3 s (Fig. 4 B). With ChEF and ChIEF, the maximum peak responses of ChEF and ChIEF never fully recovered to the level of the first stimulation in the dark, reaching only ∼80% of the initial maximum response (Fig. 4 B). The exponential projections of the recovery kinetics of the transient component suggest that the recovery plateaus at ∼65% of the initial response for ChEF and ChIEF after 30 s (not shown). In addition, the recoveries of ChEF and ChIEF response were complicated by the appearance of a small slow component after 15 s (arrow, Fig. 4 A). Despite the slow component, the plateau phase of the ChEF and ChIEF responses always reached the same level at the end of the 500 ms stimulation. With the combination of incomplete recovery of the transient component and the appearance of the slow component, the maximum amplitude of the second response after 25 s delay can sometimes be slightly smaller than the response after 15 s. The slow component of the response was previously observed for ChR1 (17), although it was not described in detail. We also found that conditioning ChR2, ChEF, and ChIEF with short-wavelength light (∼410 nm) before stimulation with 470 nm light leads to the appearance of an exaggerated slow component (Fig. S3, A4, B4, and C4). Illumination with long-wavelength light (570 nm for ChR2 and ChEF, and 550 nm for ChIEF) enhanced the recovery of the inactivated component, surpassing the 80% recovery obtainable in the dark for ChEF and ChIEF (Fig. S3, A3, B3, and C3).
Figure 4.
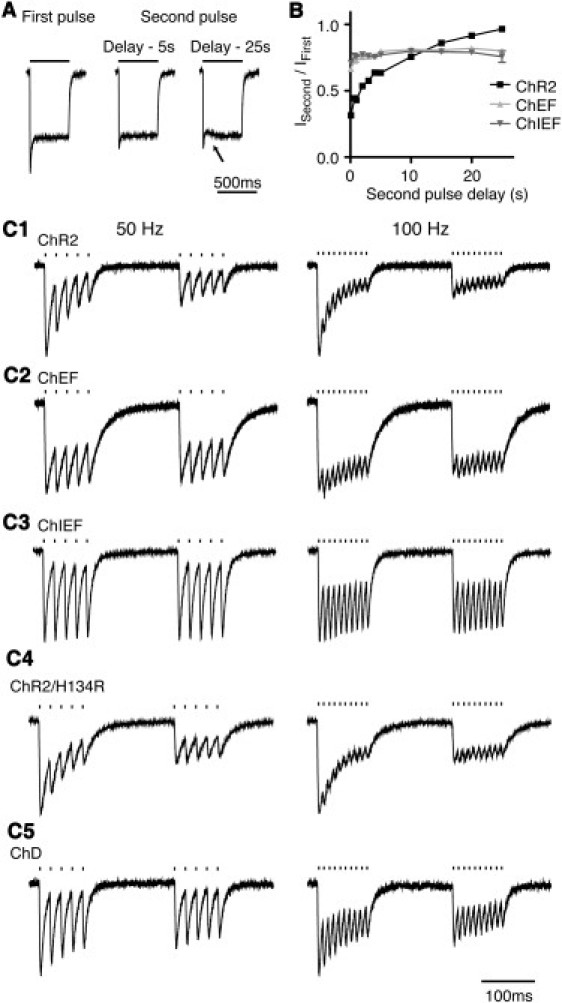
Recovery of ChRs from inactivation and the ChR response to 50 Hz and 100 Hz of burst stimulation. (A) Example of ChIEF-mediated responses to second stimulations after 5 s and 25 s delay. The response after 25 s delay exhibited incomplete recovery of the transient peak and appearance of a slow component (arrow). (B) The recovery of the three ChR variants at different interpulse intervals (ChR2, n = 11; ChEF, n = 10; ChIEF, n = 10). The recovery ratio is obtained by dividing the maximal amplitudes of the second response by the first. ChR2 showed near-complete recovery after 25 s, but ChEF and ChIEF reached only ∼80% of the initial response. (C) Currents resulting from 3 ms 470 nm light pulses (19.8 mW/mm2) delivered at 50 Hz (left column) and 100 Hz (right column) for 100 ms, then repeated 150 ms later, applied to ChR2 (C1), ChEF (C2), ChIEF (C3), ChR2/H134R (C4), and ChD (C5).
A major application of ChEF and ChIEF will be to stimulate neurons with temporal fidelity above 25 Hz. We stimulated the different ChRs with two episodes of burst stimulation with 19.8 mW/mm2 at 50 and 100 Hz in transfected HEK293 cells under voltage-clamp recordings to test ChR function independently of active membrane channels (Fig. 4 C). Both ChEF-based ChRs showed more consistent responses and less rundown than ChR2 and ChR2/H134R when stimulated at 50 Hz and 100 Hz (Fig. 4 C), although ChIEF outperformed ChEF. Surprisingly, ChD was second only to ChIEF in high-frequency response (Fig. 4 C), probably because ChD has the fastest off-rate of all ChRs tested (Table 3), combined with a slower rate of inactivation at this stimulus intensity (time constant of 34.1 ms, single-exponential fit) compared to ChR2 (22.9 ms, single-exponential fit).
We next tested cultured hippocampal neurons transfected with ChR2 and ChIEF and stimulated with 10 light pulses at 25 Hz or faster rates, repeated once more 150 ms later, to simulate bursting activity (Fig. 5). At 25 Hz, ChIEF-transfected neurons achieved significantly more light-triggered spikes (17.89 ± 1.65 spikes out of 20 pulses; n = 9) than ChR2 neurons (2.90 ± 0.80 spikes out of 20 pulses; n = 10, p < 0.0001). At higher frequencies (50 and 75 Hz) ChR2 often failed to drive spikes after the initial pulse (1.44 ± 0.24 and 1.71 ± 0.29 spikes for 50 and 75 Hz, respectively). In comparison, ChIEF was more successful in inducing spikes than ChR2 (7.88 ± 1.36 and 5.43 ± 0.72 spikes for 50 and 75 Hz, respectively, p < 0.0004, when compared to ChR2). The superiority of ChIEF over ChR2 was not due to differences in membrane properties of the recorded cells, because the membrane capacitance (68.74 ± 10.16 vs. 69.46 ± 11.49 pF), resistance (144.8 ± 26.5 vs. 169.0 ± 24.1 MΩ), and calculated membrane time constants (8.0 ± 1.3 ms, n = 9 vs. 10.0 ± 0.8 ms, n = 10 ms) were measured and found to be similar for ChR2 and ChIEF transfected neurons, respectively. We also measured the relative membrane expression of the ChRs by measuring the amount of fluorescence from the fused EGFP, and found these values not to be significantly different between the two groups (Fig. 5, D and E).
It may be possible to compensate for the inactivation of ChR2 by using the ChR2/H134R variant at a high expression level so that the noninactivated response will still be sufficient to depolarize the cells above threshold. We compared human-codon optimized ChR2/H134R-mCherry with our ChIEF-mCherry in vectors containing additional flanking introns to increase the level of expression (Fig. 6). At 25 Hz, ChIEF still induced more spikes at 25 Hz at stimulation intensities of 6.1 and 9.8 mW/mm2 (p < 0.05; Fig. 6). At 50 and 75 Hz, ChIEF drove more spikes than did ChR2, but because of increased variability, p exceeded 0.05. The membrane capacitance (85 ± 15 vs. 73 ± 10 pF), resistance (200 ± 43 vs. 186 ± 32 MΩ), and calculated membrane time constants (15.2 ± 3.0 ms, n = 8 vs. 12.2 ± 1.7 ms, n = 8) were measured and found to be similar for ChR2- and ChIEF-transfected neurons, respectively. At a stimulation intensity of 17 mW/mm2, the performance of both ChR2/H134R and ChIEF deteriorated because the cells often entered depolarization block (not shown). ChR2/H134R was less successful at inducing spiking than ChIEF at 17 mW/mm2, although the difference was not statistically significant because of the increased variability of ChIEF-transfected cells. We also tested the transfected neurons' response to a constant pulse of light (Fig. S4). The ChR2/H134R-transfected cells showed strong initial depolarization followed by reduced depolarization, as expected from a channel that exhibits inactivation, whereas ChIEF-transfected neurons showed a more exponential-shaped membrane charging profile, as expected from a rectangular current pulse (Fig. S4).
Discussion
Selectivity and conductance
Although ChRs share no homology with the known voltage- or ligand-gated ion channels, they do have ∼20% to 30% homology with microbial opsins, limited to the retinal binding pockets, with very little homology outside these regions. The 3D crystal structures of bacteriorhodopsin (21), halorhodopsin (22), and sensory rhodopsin II (23) are known; however, it is unclear how ChRs become conductive in response to light. By transplanting the last two transmembrane helices of Chop2 into Chop1, we were able to make a chimera (ChEF) that preserved many properties of ChR1 but became conductive to cations other than protons. This result suggests that the last two transmembrane helices have crucial roles in determining the ion selectivity. The transplantation of selectivity filter is imperfect, as shown by the differences in permeability ratio of different cations between ChR2 and ChEF, indicating that other parts of the protein contribute to the cation selectivity of ChR2. The reversal potentials calculated from our estimated permeability ratios differed by 0.02 to 10 mV from the measured values for both ChR2 and ChEF. We observed less deviation from predicted reversal potentials for both ChR2 and ChEF in the extracellular solutions with 3 mM [K+]o (difference < 6 mV), whereas the differences were both greater in 25 mM [K+]o solution (7.2 and 10.2 mV for ChR2 and ChEF, respectively). Although it is possible that the differences originated from imprecision or errors in the measurements or an incomplete exchange of the intracellular solution with the pipette solution, it is also possible that the GHK equation for calculating permeability ratios, modified by Chang (12) to include small contributions from divalent cations, may not accurately describe ChRs. The GHK equation assumes independence of permeable ions and nonsaturation of the channel pore. These assumptions may fail for ChRs, especially in conditions where the extracellular potassium level is elevated. It is not uncommon for the permeability of membrane channels to deviate from GHK predictions, as this has been observed with sodium channels, calcium channels, potassium channels, chloride channels, and glutamate receptors (24,25).
One of the surprising results is the change in intracellular pH observed in transfected cells given the low number of protons at pH near neutral range. However, the measured pHi in HEK293 cells (∼7.6) is slightly more alkaline than our extracellular solution (pH 7.35), resulting in a positive equilibrium potential at ∼19 mV for proton and greater electromotive force for proton entry. In small cells (such as HEK293 cells, where most cells are <20 pF in capacitance) with prolonged channel activation, sufficient protons enter to lower the intracellular pH significantly. Such acidification is seen with native ChR2, not just our new variants. Although this acidification is unlikely to prevent the use of ChRs as a neuroscience tool, it should not be forgotten as an intrinsic side effect of ChR stimulation.
The ChEF-based ChR variants are comparable to ChR2 in conductances, as indicated by the similar mean peak current amplitudes and unitary currents estimated by nonstationary fluctuation analysis. The single-channel conductances of ChR2, ChEF, and ChIEF are lower than any known ion channels in an unblocked state, except for the 15 fS of a voltage-gated proton channel (25,26), but are significantly higher than the previous estimate of 50 fS (1). A more recent estimation of the single-channel conductance of ChR2 was 300 fS (27), which overlaps with the lower range of our single-channel estimation (250 fS). The lowest estimation of single-channel conductances of ChEF and ChIEF are higher than ChR2 at ∼500–700 fS, although the mean of the three estimations were not different at ∼1 pS. The single-channel conductance of 250–300 fS would be in the range of the conductance of membrane transporters (28). However, single-channel conductance at this range is difficult to measure precisely and can be easily influenced by electrical noise or mechanical and electrical variability in the measurement and stimulation system. We did not use the membrane fluorescence to estimate the conductance of the channels, because this approach will not only introduce the same errors as described above, but may lead to additional problems such as nonfunctional/unavailable channels at the surface, and errors from the imaging system and calibration of proteins at the membrane.
Spectral properties
ChEF has a red-shifted response spectrum as described for ChR1, with detectable responses from ∼600 nm to UV wavelengths. An interesting observation is the separation of response spectra for the transient peak and the plateau responses, as the transient peak and the plateau of ChEF peaked at 470 nm and 490 nm, respectively. This also indicates that attempts to create red-shifted ChRs that respond only to yellow or orange light need to red-shift both photocycle states that are responsible for transient and plateau response. Although the results are not shown in this study, we created mutations around the retinal-binding pocket that resulted in greatly red-shifted transient but blue-shifted plateau responses. A recently published ChR from Volvox carteri, VChR1 (29), is reported to have a more red-shifted spectrum than other ChRs and is also capable of conducting cations other than protons. However, the published action spectrum of VChR1 shows two peaks, one above 500 nm and one around 460 nm, which explains its broader response spectrum compared to other ChRs. It is difficult to make direct comparisons of the action spectrum of VChR1 with our results, since the action spectra were measured by different methods.
Kinetic properties and photocycle states
The introduction of I170V into ChEF improved the channel closure rate of the channel but also somewhat reduced the sensitivity to light. These results indicate that this mutation destabilizes the channel in the open state, leading to the higher energy requirement for channel opening and faster transition back to the nonconducting state after removal of light. The correlation of light sensitivity to faster channel closure is also observed in ChD, which has the fastest channel closure rate, but is also the least sensitive to light. Fortunately, the amount of light required to achieve significant activation of ChIEF is still within the range (∼10 mW/mm2) easily achieved with current light-delivering technology (8,20,30).
Two interesting observations regarding ChEF and ChIEF are their incomplete recovery and the appearance of the slow component. These observations suggest additional nonconducting states within the photocycle after activation. The incomplete recovery suggests that the protein can enter a previously undescribed nonconducting state that is unresponsive to blue light after initial activation (2,17,27). The protein exits this state when illuminated at 550/570 nm, suggesting that this inactivated state absorbs in this wavelength range but not in the blue. The appearance of the slow component during recovery suggests complex dark states of the protein, as the protein enters this “slow” state slowly during recovery in the dark. “Conditioning” with 410 nm light exaggerates this slow component, indicating that the transition into this “slow” state can be enhanced by short wavelengths. Previous models of ChR photocycles (2,17,27) do not explain these phenomena. The induction of a slow component by 410 nm light and enhancement of recovery by 570 nm of light are also observed with ChR2 (see Fig. 4), indicating that the same photocycle states exist in ChR2 and are likely to be common among the ChRs. Although these properties may have only small implications for the use of ChRs in neuroscientific research, they are likely to have greater implications for comparing the different ChR properties, as some of the responses may not fully recover after initial stimulation without conditioning, or enter into other photocycle states after prior illumination, which can make comparisons invalid if the order of stimuli and intervals between tests are not controlled.
ChRs for controlling neuron spiking patterns
The transmission of information between neurons in the brain is encoded by the pattern of action potential trains and the temporal/spatial summation of synaptic potentials. The use of light to control neuronal excitability has great advantages over traditional electrode-based approaches because it is less intrusive and can be genetically encoded to stimulate selected cell types. Most studies of ChR have claimed ChR2 to be “temporally precise” and reported light-induced phase-locked action potential trains at high fidelity up to a 25–30 Hz stimulation frequency (3,4,9–11). Although most cortical neurons fire sparsely at low rates in vivo, bursts of action potentials above 25 Hz are required to achieve functions such as induction of plasticity (31), or information encoding in other fast-spiking systems (32). Temporally precise stimulation above 15 Hz with ChR2 has been difficult to achieve because of its inactivation and slow off-rate when repetitively stimulated. Most studies involving ChR2 have overexpressed the channel to achieve sufficient depolarization when stimulated repetitively by blue light to compensate for the inactivation of the channel. We tested ChIEF at two expression levels and consistently observed a superior performance over ChR2 or ChR2/H134R in terms of inducing temporally precise spiking, as expected from the channel properties. Using overexpression to compensate for inactivation is also not ideal, as we found that a high level of ChR expression often leads to depolarization block after stimulation at high frequencies (see Fig. 6, A2, A3, B2, and B3). In addition, overexpression of microbial opsins can lead to toxicity and disturb membrane function (33–36). We engineered ChIEF to achieve more consistent responses to repetitive stimulation at higher rates, enabling photostimulation of action potential trains at higher rates. However, to achieve high-fidelity stimulation above 25 Hz, neuron properties such as the membrane time constant and membrane resistance, and levels of sodium and potassium channel expression will also affect the speed and degree of polarization necessary for triggering action potentials at high rates. In cultured hippocampal neurons, we have found it difficult to induce action potential trains consistently at 50 Hz or above even with current injection, as reported previously (30). The difficulty of triggering action potential in cultured hippocampal neurons at high frequency can be attributed to weak potassium channel expression and long membrane time constants (∼8–15 ms), which results in slow discharging of the membrane when the neurons are stimulated by wide-field illumination. Even so, we saw improved fidelity of light-triggered spiking above 25 Hz. We also predict that the differences of ChR2 and ChIEF will become more apparent in cell types that have low membrane resistance (requiring larger inward currents to achieve threshold) and are naturally capable of firing at higher rates, such as Purkinje cells of the cerebellum. The other chimera generated, ChD, may also be useful in inducing temporally precise fast-burst firings, as this channel has the fastest off-rate. However, eventual inactivation will likely limit ChD to experiments where it is desirable to induce short (<200 ms) bursts of spikes.
Another recently developed method that uses photoswitchable glutamate (MAG) in combination with genetically modified iGluR6 can be used to reliably induce action potentials at 50 Hz in cultured hippocampal neurons (37). However, the MAG approach requires both a chemical and a genetic component, in addition to the requirement of two wavelengths to control the opening and closing of the channel, which complicates its use in vivo. Our ChIEF retains the simplicity of ChR2 but has improved channel properties that allow higher-frequency stimulation with higher fidelity than ChR2. We believe our ChR variants can be particularly useful in nervous systems where there is a need for more temporally precise control of depolarization and action potential firing.
Acknowledgments
J.Y. Lin designed and constructed the chimera channels and its variants, and performed the electrophysiological characterization in cultured HEK293 cells and neurons. P. Steinbach designed and modified the required optical hardware for the stimulation and characterization, and also assisted in the imaging experiments. M.Z. Lin provided assistance with the molecular-biological techniques and analysis of retinal binding residues, provided the primary hippocampal cultures, and edited the manuscript. R.Y. Tsien assisted with the interpretation and analysis of the results, provided funding, supervised the project, and co-wrote the manuscript. J.Y. Lin was funded by a postdoctoral fellowship from the Foundation of Research, Science and Technology of New Zealand. M.Z. Lin is funded by a Jane Coffin Childs Fellowship. The project was supported by grants to R.Y.T. from the National Institutes of Health (NS027177) and Howard Hughes Medical Institute.
Footnotes
This is an Open Access article distributed under the terms of the Creative Commons-Attribution Noncommercial License (http://creativecommons.org/licenses/by-nc/2.0/), which permits unrestricted noncommercial use, distribution, and reproduction in any medium, provided the original work is properly cited.
Supporting Material
References
- 1.Nagel G., Ollig D., Fuhrmann M., Kateriya S., Musti A.M. Channelrhodopsin-1: a light-gated proton channel in green algae. Science. 2002;296:2395–2398. doi: 10.1126/science.1072068. [DOI] [PubMed] [Google Scholar]
- 2.Nagel G., Szellas T., Huhn W., Kateriya S., Adeishvili N. Channelrhodopsin-2, a directly light-gated cation-selective membrane channel. Proc. Natl. Acad. Sci. USA. 2003;100:13940–13945. doi: 10.1073/pnas.1936192100. [DOI] [PMC free article] [PubMed] [Google Scholar]
- 3.Wang H., Peca J., Matsuzaki M., Matsuzaki K., Noguchi J. High-speed mapping of synaptic connectivity using photostimulation in Channelrhodopsin-2 transgenic mice. Proc. Natl. Acad. Sci. USA. 2007;104:8143–8148. doi: 10.1073/pnas.0700384104. [DOI] [PMC free article] [PubMed] [Google Scholar]
- 4.Arenkiel B.R., Peca J., Davison I.G., Feliciano C., Deisseroth K. In vivo light-induced activation of neural circuitry in transgenic mice expressing channelrhodopsin-2. Neuron. 2007;54:205–218. doi: 10.1016/j.neuron.2007.03.005. [DOI] [PMC free article] [PubMed] [Google Scholar]
- 5.Bi A., Cui J., Ma Y.P., Olshevskaya E., Pu M. Ectopic expression of a microbial-type rhodopsin restores visual responses in mice with photoreceptor degeneration. Neuron. 2006;50:23–33. doi: 10.1016/j.neuron.2006.02.026. [DOI] [PMC free article] [PubMed] [Google Scholar]
- 6.Petreanu L., Huber D., Sobczyk A., Svoboda K. Channelrhodopsin-2-assisted circuit mapping of long-range callosal projections. Nat. Neurosci. 2007;10:663–668. doi: 10.1038/nn1891. [DOI] [PubMed] [Google Scholar]
- 7.Zhang Y.P., Oertner T.G. Optical induction of synaptic plasticity using a light-sensitive channel. Nat. Methods. 2007;4:139–141. doi: 10.1038/nmeth988. [DOI] [PubMed] [Google Scholar]
- 8.Huber D., Petreanu L., Ghitani N., Ranade S., Hromadka T. Sparse optical microstimulation in barrel cortex drives learned behaviour in freely moving mice. Nature. 2008;451:61–64. doi: 10.1038/nature06445. [DOI] [PMC free article] [PubMed] [Google Scholar]
- 9.Ishizuka T., Kakuda M., Araki R., Yawo H. Kinetic evaluation of photosensitivity in genetically engineered neurons expressing green algae light-gated channels. Neurosci. Res. 2006;54:85–94. doi: 10.1016/j.neures.2005.10.009. [DOI] [PubMed] [Google Scholar]
- 10.Li X., Gutierrez D.V., Hanson M.G., Han J., Mark M.D. Fast noninvasive activation and inhibition of neural and network activity by vertebrate rhodopsin and green algae channelrhodopsin. Proc. Natl. Acad. Sci. USA. 2005;102:17816–17821. doi: 10.1073/pnas.0509030102. [DOI] [PMC free article] [PubMed] [Google Scholar]
- 11.Boyden E.S., Zhang F., Bamberg E., Nagel G., Deisseroth K. Millisecond-timescale, genetically targeted optical control of neural activity. Nat. Neurosci. 2005;8:1263–1268. doi: 10.1038/nn1525. [DOI] [PubMed] [Google Scholar]
- 12.Chang D.C. Dependence of cellular potential on ionic concentrations. Data supporting a modification of the constant field equation. Biophys. J. 1983;43:149–156. doi: 10.1016/S0006-3495(83)84335-5. [DOI] [PMC free article] [PubMed] [Google Scholar]
- 13.Jan L.Y., Jan Y.N. L-glutamate as an excitatory transmitter at the Drosophila larval neuromuscular junction. J. Physiol. 1976;262:215–236. doi: 10.1113/jphysiol.1976.sp011593. [DOI] [PMC free article] [PubMed] [Google Scholar]
- 14.Sigworth F.J. The variance of sodium current fluctuations at the node of Ranvier. J. Physiol. 1980;307:97–129. doi: 10.1113/jphysiol.1980.sp013426. [DOI] [PMC free article] [PubMed] [Google Scholar]
- 15.Lanyi J.K., Luecke H. Bacteriorhodopsin. Curr. Opin. Struct. Biol. 2001;11:415–419. doi: 10.1016/s0959-440x(00)00226-8. [DOI] [PubMed] [Google Scholar]
- 16.Shaner N.C., Campbell R.E., Steinbach P.A., Giepmans B.N., Palmer A.E. Improved monomeric red, orange and yellow fluorescent proteins derived from Discosoma sp. red fluorescent protein. Nat. Biotechnol. 2004;22:1567–1572. doi: 10.1038/nbt1037. [DOI] [PubMed] [Google Scholar]
- 17.Hegemann P., Ehlenbeck S., Gradmann D. Multiple photocycles of channelrhodopsin. Biophys. J. 2005;89:3911–3918. doi: 10.1529/biophysj.105.069716. [DOI] [PMC free article] [PubMed] [Google Scholar]
- 18.Henderson R., Baldwin J.M., Ceska T.A., Zemlin F., Beckmann E. Model for the structure of bacteriorhodopsin based on high-resolution electron cryo-microscopy. J. Mol. Biol. 1990;213:899–929. doi: 10.1016/S0022-2836(05)80271-2. [DOI] [PubMed] [Google Scholar]
- 19.Nagel G., Brauner M., Liewald J.F., Adeishvili N., Bamberg E. Light activation of channelrhodopsin-2 in excitable cells of Caenorhabditis elegans triggers rapid behavioral responses. Curr. Biol. 2005;15:2279–2284. doi: 10.1016/j.cub.2005.11.032. [DOI] [PubMed] [Google Scholar]
- 20.Campagnola L., Wang H., Zylka M.J. Fiber-coupled light-emitting diode for localized photostimulation of neurons expressing channelrhodopsin-2. J. Neurosci. Methods. 2007;169:27–33. doi: 10.1016/j.jneumeth.2007.11.012. [DOI] [PubMed] [Google Scholar]
- 21.Mitsuoka K., Hirai T., Murata K., Miyazawa A., Kidera A. The structure of bacteriorhodopsin at 3.0 A resolution based on electron crystallography: implication of the charge distribution. J. Mol. Biol. 1999;286:861–882. doi: 10.1006/jmbi.1998.2529. [DOI] [PubMed] [Google Scholar]
- 22.Kolbe M., Besir H., Essen L.O., Oesterhelt D. Structure of the light-driven chloride pump halorhodopsin at 1.8 A resolution. Science. 2000;288:1390–1396. doi: 10.1126/science.288.5470.1390. [DOI] [PubMed] [Google Scholar]
- 23.Royant A., Nollert P., Edman K., Neutze R., Landau E.M. X-ray structure of sensory rhodopsin II at 2.1-A resolution. Proc. Natl. Acad. Sci. USA. 2001;98:10131–10136. doi: 10.1073/pnas.181203898. [DOI] [PMC free article] [PubMed] [Google Scholar]
- 24.Begenisich T.B., Cahalan M.D. Sodium channel permeation in squid axons. I: Reversal potential experiments. J. Physiol. 1980;307:217–242. doi: 10.1113/jphysiol.1980.sp013432. [DOI] [PMC free article] [PubMed] [Google Scholar]
- 25.Hille B. Sinauer Associates; Sunderland, MA: 2001. Ion Channels of Excitable Membranes. [Google Scholar]
- 26.Cherny V.V., Murphy R., Sokolov V., Levis R.A., DeCoursey T.E. Properties of single voltage-gated proton channels in human eosinophils estimated by noise analysis and by direct measurement. J. Gen. Physiol. 2003;121:615–628. doi: 10.1085/jgp.200308813. [DOI] [PMC free article] [PubMed] [Google Scholar]
- 27.Bamann C., Kirsch T., Nagel G., Bamberg E. Spectral characteristics of the photocycle of channelrhodopsin-2 and its implication for channel function. J. Mol. Biol. 2008;375:686–694. doi: 10.1016/j.jmb.2007.10.072. [DOI] [PubMed] [Google Scholar]
- 28.Sonders M.S., Amara S.G. Channels in transporters. Curr. Opin. Neurobiol. 1996;6:294–302. doi: 10.1016/s0959-4388(96)80111-5. [DOI] [PubMed] [Google Scholar]
- 29.Zhang F., Prigge M., Beyriere F., Tsunoda S.P., Mattis J. Red-shifted optogenetic excitation: a tool for fast neural control derived from Volvox carteri. Nat. Neurosci. 2008;11:631–633. doi: 10.1038/nn.2120. [DOI] [PMC free article] [PubMed] [Google Scholar]
- 30.Aravanis A.M., Wang L.P., Zhang F., Meltzer L.A., Mogri M.Z. An optical neural interface: in vivo control of rodent motor cortex with integrated fiberoptic and optogenetic technology. J. Neural Eng. 2007;4:S143–S156. doi: 10.1088/1741-2560/4/3/S02. [DOI] [PubMed] [Google Scholar]
- 31.Nevian T., Sakmann B. Spine Ca2+ signaling in spike-timing-dependent plasticity. J. Neurosci. 2006;26:11001–11013. doi: 10.1523/JNEUROSCI.1749-06.2006. [DOI] [PMC free article] [PubMed] [Google Scholar]
- 32.Murphy G.J., DuLac S. Postnatal development of spike generation in rat medial vestibular nucleus neurons. J. Neurophysiol. 2001;85:1899–1906. doi: 10.1152/jn.2001.85.5.1899. [DOI] [PubMed] [Google Scholar]
- 33.Gradinaru V., Thompson K.R., Zhang F., Mogri M., Kay K. Targeting and readout strategies for fast optical neural control in vitro and in vivo. J. Neurosci. 2007;27:14231–14238. doi: 10.1523/JNEUROSCI.3578-07.2007. [DOI] [PMC free article] [PubMed] [Google Scholar]
- 34.Zhang F., Wang L.P., Brauner M., Liewald J.F., Kay K. Multimodal fast optical interrogation of neural circuitry. Nature. 2007;446:633–639. doi: 10.1038/nature05744. [DOI] [PubMed] [Google Scholar]
- 35.Gradinaru V., Thompson K.R., Deisseroth K. eNpHR: a Natronomonas halorhodopsin enhanced for optogenetic applications. Brain Cell Biol. 2008;36:129–139. doi: 10.1007/s11068-008-9027-6. [DOI] [PMC free article] [PubMed] [Google Scholar]
- 36.Zimmermann D., Zhou A., Kiesel M., Feldbauer K., Terpitz U. Effects on capacitance by overexpression of membrane proteins. Biochem. Biophys. Res. Commun. 2008;369:1022–1026. doi: 10.1016/j.bbrc.2008.02.153. [DOI] [PubMed] [Google Scholar]
- 37.Szobota S., Gorostiza P., DelBene F., Wyart C., Fortin D.L. Remote control of neuronal activity with a light-gated glutamate receptor. Neuron. 2007;54:535–545. doi: 10.1016/j.neuron.2007.05.010. [DOI] [PubMed] [Google Scholar]
Associated Data
This section collects any data citations, data availability statements, or supplementary materials included in this article.