

Abstract
The nuclear factor of activated T-cell (NFAT) transcription factors play an important role in many biological processes, including pathological cardiac hypertrophy. Stimulated by calcium signals, NFAT is translocated to the nucleus where it can regulate hypertrophic genes (excitation-transcription coupling). In excitable cells, such as myocytes, calcium is a key second messenger for multiple signaling events, including excitation-contraction coupling. Whether the calcium signals due to excitation-contraction and excitation-transcription coupling coincide or how they can be differentiated is currently unclear. Here we construct a mathematical model of NFAT cycling fitted to skeletal myocyte and baby hamster kidney cell data. The model replicates key behavior with respect to sensitivity to calcineurin overexpression and to calcium oscillations. Finally, we measure the sensitivity of the system to a simulated hypertrophic calcium signal, against a background excitation-contraction coupling calcium oscillation. We find that NFAT cycling is sensitive to excitation-transcription coupling even when both calcium signals are in the same cellular compartment, thus showing that separation of the signals may not be necessary in vitro.
Introduction
The nuclear factor of activated T cell (NFAT) transcription factors are important in a number of signal transduction pathways, having been implicated in a diverse range of functions such as bone maintenance (1), memory formation (2), immune response (3), and cell differentiation (4). NFAT is also involved in pathological cardiac hypertrophy (5), which in turn is a risk factor for heart failure (6).
While NFAT binds only weakly with DNA, it interacts with a range of other factors stimulated from multiple intracellular pathways to accomplish hypertrophic gene expression (7). Thus NFAT complexes function as crucial “signal integrators” (8) for the progression of the disease.
NFAT resides in the cytoplasm until it is dephosphorylated by calcineurin, in response to a calcium signal. During dephosphorylation, calcineurin binds to NFAT and the complex is translocated into the nucleus. There NFAT can bind to DNA and upregulate hypertrophic genes, before being rephosphorylated and exported from the nucleus in what appears to be a “futile cycle”.
In this article, we develop a generic mathematical model for NFAT cycling on activation of calcineurin, using data from mouse skeletal muscle and baby hamster kidney (BHK) cells. We apply this model to the consideration of the cardiac myocyte. The stimulation of NFAT cycling by calcium in the cardiac myocyte raises significant questions about how two calcium signals may be differentiated by the cell—the first due to excitation-contraction coupling (calcium-induced calcium release) in the beating myocyte, and the second due to a rise in calcium from hypertrophic signal transduction. Understanding how the cell can respond to a calcium signal induced by hypertrophic signal transduction when intracellular calcium is also oscillating has been recognized as a significant challenge in cardiac calcium research (9), leading to the hypothesis that the two calcium signals may be localized to different compartments in the cell.
Here we use our model to explore whether such compartmentalization is necessary, using the information currently available on NFAT translocation kinetics. We have already employed such modeling to reveal insights about the hypertrophic pathway upstream of NFAT (10), and in recent years, a number of mathematical models have been constructed to explore facets of NFAT cycling. Shen et al. (11) explored the role of kinases in the nuclear export process in skeletal muscle. While their model revealed useful insights, it is phenomenologically based and not easily extended to a general exploration of NFAT cycling. A more biophysically based model is presented by Fisher et al. (12), which focuses on the role of the cotranslocation of calcineurin into the nucleus in T lymphocytes. Arron et al. (13) presented an extended NFAT cycling model, but the timescale considered is much longer than is required here (being approximately hours), as they explore the possible feedback of NFAT-stimulated gene expression on cytosolic NFAT dephosphorylation. Shin et al. (14) presented an NFAT cycling model postulating the dual regulatory role of an endogenous inhibitor. While useful, this model required a large number (>15) of estimated parameters. Given the lack of data in this part of the pathway, a parsimonious approach to model formulation seems appropriate. Tomida et al. (15) took such an approach in their investigation of the effect of calcium oscillations in BHK cells. However, none of these models addresses the question of interest here.
To explore the likely effect of calcium signaling in cardiac myocyte NFAT cycling, a parsimonious mathematical model consisting of the core NFAT cycling reactions is developed. The model has six unknown parameters which are fitted by constraining the model to the mouse skeletal myocyte data from Shen et al. (11) (cardiac myocyte-specific data being unavailable), and BHK-derived transient data from Tomida et al. (15). The model exhibits similar effects to those observed in the NFAT cycle in Jurkat T lymphocytes, showing a cytosolic buildup of dephosphorylated NFAT, and proves to be more efficient when subjected to an oscillating calcium signal than a constant signal, at low average calcium concentrations. Thus, it provides a plausible description of how this cycle works in general, and therefore in the cardiac myocyte on stimulation by calcium signals.
Once constructed, the model is used to determine how large a signal might be required from signal transduction to stimulate increased NFAT cycling, given that an oscillating signal (from excitation-contraction coupling) is already present. In particular, the question of whether a cytosolic signal transduction-induced signal gets washed-out by an oscillating cytosolic calcium signal is explored.
Methods
NFAT cycling model formulation
The mathematical model of the NFAT cycle developed here is shown in schematic form in Fig. 1. The phosphatase calcineurin is complexed with calmodulin (together referred to as N for the purposes of this model), and activated by calcium (Ca). Activated calcineurin attaches to and dephosphorylates cytosolic NFAT (NFATpc), forming a cytosolic dephosphorylated complex (NFATNc) via reaction R1. The dephosphorylation causes the exposure of a nuclear localization signal domain (16) on NFAT, leading to the binding of importins and ferrying of NFAT through nuclear pores via the Ran cycle (17) into the nucleus (reaction R2). Nuclear dephosphorylated NFAT (NFATNn) is free to bind to the DNA (hence, is DNA-ready) cooperatively with other transcription factors and invoke a hypertrophic response. Inside the nucleus there are a number of kinases that rephosphorylate NFAT (shown by reaction R3), and it is thought that the primary enzymes in myocytes are GSK-3β, CK1, and CK2 (11). This phosphorylation of nuclear NFAT (to NFATpn) is inhibited by the complexed activated calcineurin, which is cotranslocated with NFAT into the nucleus (18). Hence, NFAT cycling is also affected by nuclear calcium, due to its inhibition of NFAT rephosphorylation via continued calcineurin activation. Once NFAT is rephosphorylated, a nuclear export signal domain is exposed (19), and NFAT is exported from the nucleus (shown as reaction R4), via exportins and the Ran cycle, to become cytosolic phosphorylated NFAT (NFATpc) again.
Figure 1.

Schematic of the NFAT cycling model. Calcium (Ca) and calmodulin (not shown) activates calcineurin (N), which binds to and dephosphorylates cytosolic NFAT (NFATpc). The calcineurin-bound cytosolic NFAT (NFATNc) translocates to the nucleus where it (now NFATNn) can bind DNA cooperatively with other factors to transcribe hypertrophic genes. NFAT may also be rephosphorylated (to NFATpn), and exported from the nucleus in an apparent “futile cycle”.
The model consists of molecular species in two compartments—the cytosol and the nucleus. In rat ventricular and mouse atrial cells, the nucleus is ∼2% of cell volume (Table 3 in Bers (20)). This is included in the model by a conversion factor Ccn (converting cytosolic molar fluxes to nuclear molar fluxes) set at 50.
To make a parsimonious yet biologically meaningful model, a number of simplifying assumptions were made. Since the timescale of calcium-dependent calcineurin activation and deactivation when calcium is varied (seconds, as in (21) and (22), respectively) is much faster than NFAT translocation (tens of minutes (11)), we employ a steady-state calcineurin activation model, in which calcineurin activation is instantaneous with increasing calcium. The assumption is made here that calcium ions can freely diffuse freely into the nucleus via nuclear pores (23), consistent with experimental findings (24), and that the timescale is sufficiently fast compared to NFAT translocation (being in the order of hundreds of milliseconds in rat leukemia cells (25)) that nuclear calcium can be assumed to be equal to cytosolic calcium. Without any information to the contrary, it is also assumed that for the purposes of calcineurin activation, the total calmodulin concentration inside the nucleus is equal to that in the cytosol. To test the effect of these assumptions on our model, we also conducted a sensitivity analysis for the nuclear calcium, nuclear calmodulin, and the ratio of cytosolic/nuclear volume. We varied each parameter by −50%, −10%, +10%, and +50% of their original values and checked our fits to the datasets derived by Shen et al. (11) and Tomida et al. (15) (see Supporting Material). Due to the protocols used, model fits were insensitive to these parameters, and our model predictions in response to calcium stimulations were conserved.
Importins, exportins, and Ran cycle component concentrations are assumed to be sufficiently constant so as not to be rate-affecting, and therefore do not require explicit modeling as separate molecular pools. Concentrations of these species are instead abstracted into the rate constants for the reactions that use them: reaction R2 for nuclear import, and R4 for nuclear export.
It is assumed that any synthesis of NFAT is balanced by degradation, and that (on the timescale of the simulation) the total amount of NFAT available in the cell is constant at 1 μM. Since this model will be fitted to data measuring relative NFAT species proportions, knowledge of the exact concentration is not critical.
The details of GSK-3β, CK1 and CK2 kinases, and perhaps other priming kinases such as PKA (26), are not known with enough detail to model them as separate species. In this formulation, it is assumed that these kinases exist in the nucleus and provide a rephosphorylation rate by virtue of lumped rate constants for reaction R3.
The NFAT phosphorylation and dephosphorylation reactions are both modeled as single steps, although in reality there may be a large number of phosphorylation sites involved. Research suggests there may be 14 sites in all and perhaps 13 of these are dephosphorylated during NFAT cycling (27). There is currently no conclusive evidence pointing to exactly which residues are involved and, considering again the likely timescale of successive phosphorylation/dephosphorylation events compared with that for NFAT translocation, for the purposes of this model, a single step is assumed.
Finally, it was assumed that both the cytosolic and nuclear phosphorylation-dephosphorylation reactions (R1 and R3) are reversible. It should be noted that the existence of the associated back-reactions is not experimentally confirmed. The nuclear import-export reactions (R2 and R4, respectively) do not have back reactions, as these use the Ran cycle and are active processes and therefore unlikely to run backward in this context.
With these assumptions, reactions R1–4 were formulated according to the law of mass action. Reaction R1 depicts the binding to and dephosphorylation of NFATpc by activated calcineurin to form the complex NFATNc,
where Nactive is the amount of activated calcineurin, determined by the relation
where actN is the fraction of activated calcineurin,
Here Ca is intracellular calcium concentration; n is the calcineurin activation Hill coefficient; Km, N is the half-maximal activation concentration of calcium for calmodulin activation for a given concentration of calmodulin (M); and Kd, 1 is the calcineurin-calmodulin dissociation constant (see the Supporting Material for the derivation of this equation). The back-reaction embodies the deactivation of calcineurin (which is dependent on the calcium concentration) and dissociation of the calcineurin-NFAT complex allowing NFAT to be rephosphorylated. In this formulation, these are modeled as a single step, where the amount of NFAT/calcineurin complex available to be dissociated is proportional to (1-actN). The flux equation for this reaction is, therefore,
Similarly, the nuclear rephosphorylation reaction (R3) is
(note that since the predominant direction for reaction R3 is right-to-left in Fig. 1, this reaction appears backward compared to the figure) and is formulated by scaling the appropriate reactants by actN and (1 − actN), to yield the flux equation,
The nuclear import and export reactions are modeled using simple kinetics, consisting of first-order rate equations. The import process (R2) is
giving the flux
Similarly, the export reaction (R4) is
giving the flux
Having defined the fluxes for each of the reactions in the model, one can derive expressions for the rates of change of the molecular species. The cytosolic phosphorylated NFAT is involved in both reactions R1 and R4, thus
The scaling by Ccn on nuclear export adjusts for the difference in volume of the nucleus compared to the cytosol. The cytosolic dephosphorylated NFAT is involved in both reactions R1 and R2, thus
The nuclear dephosphorylated NFAT is involved in both reactions R2 and R3, thus
The nuclear phosphorylated NFAT is involved in both reactions R3 and R4, thus
This gives a simple mathematical formulation of the NFAT cycle. Six rate parameters (kf,1, kr,1, kf,2, kf,3, kr,3, and kf,4) are unknown. The model was therefore fitted to experimental data to determine whether this formulation could act in a physiologically meaningful way.
Model fitting
Experimental nuclear NFAT transients in skeletal myocytes are presented in the recent study of Shen et al. (11). The researchers make a number of measurements of total nuclear NFAT to explore the nuclear export system under various conditions (experimental measurements distinguishing between dephosphorylated and phosphorylated nuclear NFAT do not appear to have been conducted, as yet, in any cell type). Since other available studies of this type are in nonexcitable cells (for example, (15,28)) this skeletal myocyte data was chosen as the primary dataset to fit the model to, being derived from the closest available cell type to the cardiac myocyte.
Shen et al. applied electrical stimulation (mimicking that found during physiological activation of slow muscle fibers) for 60 min, and measured NFAT translocation to the nucleus with a range of different protein inhibitors to determine the major effectors of NFAT nuclear efflux during the resulting calcium oscillations. The measure is expressed as a percentage of nuclear NFAT compared to the value at 60 min. Translocation was stimulated for 60 min, after which time a calcineurin inhibitor was introduced leading to a decline in nuclear NFAT (11). Nuclear NFAT transients varied between experiment, so to provide measures of NFAT translocation under normal conditions, control data from 12 of their figures (specifically (11), and their Figs. 2 B, 3 A, 3 C, 4 A, 4 B, 4 C, 5 A, 5 B, 6 A, 9 A, 9 C, and 9 D) were digitized and aggregated.
The simulation protocol in the study of Shen et al. (11) applied 5 s trains of 10 Hz electrical pulses, occurring with a period of 50 s. The calcium response to the electrical pulse was assumed to be similar to previous studies from which the protocol was derived (29,30) in skeletal muscle fibers. In those experiments, a 93 nM baseline calcium rose to 1121 nM in 16 ms before returning to baseline levels in ∼120 ms. During the 10-Hz pulse train in the study of Shen et al., the calcium would not have enough time, post-stimulation, to return to baseline levels; however, it would, at the experimentally determined rate of decline, reach 291 nM before rising again. Hence, a sawtooth pattern rising from 291 nM to 1121 nM in 16 ms, and declining again to 291 nM in 84 ms, was used to approximate the calcium levels during stimulation trains (see Appendix for equations describing the calcium stimulation, and the Supporting Material for a graphical depiction).
The calcium protocol was imposed for 60 min after which calcineurin inhibitor was added. This inhibition was assumed to follow first-order kinetics,
which leads to exponential decay of the calcineurin activity,
where stimEndTime = 3600 s and τN is an unknown calcineurin inhibition time constant, included as an additional parameter in the fitting process. This inhibition reduces the influence of calcineurin in both the cytosol and the nucleus on the addition of inhibitor, leading to a decline in nuclear NFAT.
It has also been shown recently by Tomida et al. (15) that, during NFAT cycling, the reaction rates from one state to another are such that dephosphorylated NFAT (NFATNc in Fig. 1) builds up in the cytosol before being translocated to the nucleus. To ensure that the model replicates this behavior, data from Tomida et al. for both cytosolic dephosphorylated NFAT and nuclear NFAT, produced under a constant calcium stimulation, were digitized and used in the fitting process.
The protocol used in the experiments of Tomida et al. consisted of a constant calcium stimulation. The authors of that study suggested simulating with a transient similar to theirs ((15); Fig. 1 D, that article; and personal communication, 2007). Digitizing values from this, calcium was modeled as a step increase from 60 nM, causing an initial rise to 576 nM falling to 334 nM gradually over 18 min, then holding at that level until 30 min of stimulation had elapsed.
In terms of nuclear percentage NFAT, the two datasets taken together give inconsistent results. Since the dataset of Shen et al. (11) is the primary model fitting set, a scaling factor was applied to the data of Tomida et al. (15) to make the datasets more compatible (see Supporting Material for details).
Parameter fitting was then performed by replicating the calcium protocols from each of the studies (11,15), and using the Levenburg-Marquardt algorithm (implemented as the “levmar” nonlinear least-squares fitting package, obtained from http://www.ics.forth.gr/∼lourakis/levmar). The model was run to steady state with first 93 nM (11) and then 60 nM (15) calcium, and fitting to both protocols was done, respectively, from the appropriate steady-state value with each unknown kinetic rate constant allowed to vary between 1 × 10⁻¹² and 1 × 10⁻¹. Goodness-of-fit was calculated as the sum of the squared percentage differences between target and simulated values.
The best fit was achieved with the parameters listed in Table 2, giving a good fit to the data of Shen et al. under that protocol, as shown in Fig. 2. In addition, the fit to the data of Tomida et al. was qualitatively similar to experiments, as shown in Fig. 3. This shows that cytosolic dephosphorylated NFAT is buffered before declining, while nuclear NFAT occurs as a steady rise, similar to the effect observed experimentally (15). Model equations and fitted parameters can be found in the Appendix and Table 2, respectively.
Table 2.
NFAT cycling model parameters and initial conditions
|
Symbol |
Units |
Value |
Source |
|---|---|---|---|
| Ccn | Dimensionless | 50.0 | (see Methods) |
| Kd,1 | nM | 1760 | (see Supporting Material) |
| kf,1 | nM−1.s−1 | 7.69 × 10⁻⁶ | (Fitted value) |
| kr,1 | s−1 | 1.93 × 10⁻² | (Fitted value) |
| kf,2 | s−1 | 1.44 × 10⁻³ | (Fitted value) |
| kf,3 | s−1 | 3.62 × 10⁻⁴ | (Fitted value) |
| kr,3 | nM−1.s−1 | 4.71 × 10⁻⁵ | (Fitted value) |
| kf,4 | s−1 | 4.45 × 10⁻⁴ | (Fitted value) |
| Km,N | nM | 535 | (see Supporting Material) |
| M | nM | 6000 | (21) |
| n | Dimensionless | 2.92 | (see Supporting Material) |
| Ntot | nM | 1000 | (21) |
| Steady-state values of the NFAT species depend on the protocol applied. | |||
| For the protocol of Shen et al. (11) and the dual-calcium protocol, use | |||
| NFATpc | nM | 9.83 × 10⁻¹ | (Steady-state) |
| NFATpn | nM | 2.76 × 10⁻¹ | (Steady-state) |
| NFATNc | nM | 1.70 × 10⁻³ | (Steady-state) |
| NFATNn | nM | 5.09 × 10⁻¹ | (Steady-state) |
| For the protocol of Shen et al. (11) only | |||
| τN | s | 7.01 × 10⁻² | (Fitted value) |
| tN, inhib | s | 3600 | (Protocol) |
| trainPeriod | s | 50.0 | (Protocol) |
| stimEnd | s | 3600 | (Protocol) |
| For the dual-calcium protocol only | |||
| period | s | > 0.017 | (User-defined) |
| For the protocol of Tomida et al. (15), use | |||
| NFATpc | nM | 9.96 × 10⁻¹ | (Steady-state) |
| NFATpn | nM | 7.79 × 10⁻² | (Steady-state) |
| NFATNc | nM | 4.81 × 10⁻⁴ | (Steady-state) |
| NFATNn | nM | 1.09 × 10⁻¹ | (Steady-state) |
| stimEnd | s | 1800 | (Protocol) |
Figure 2.
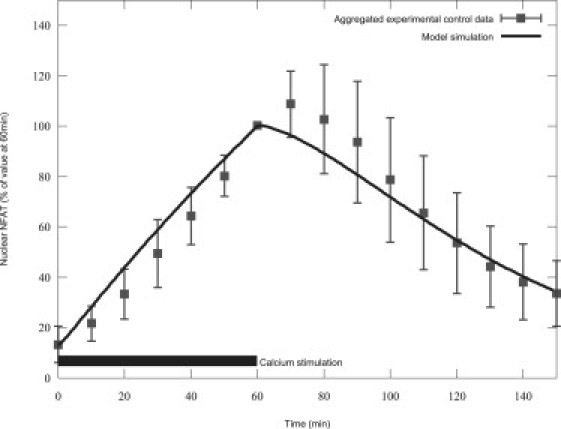
Simulated NFAT fits experimental results from Shen et al. (11). The bar in the lower left shows calcium stimulation duration.
Figure 3.
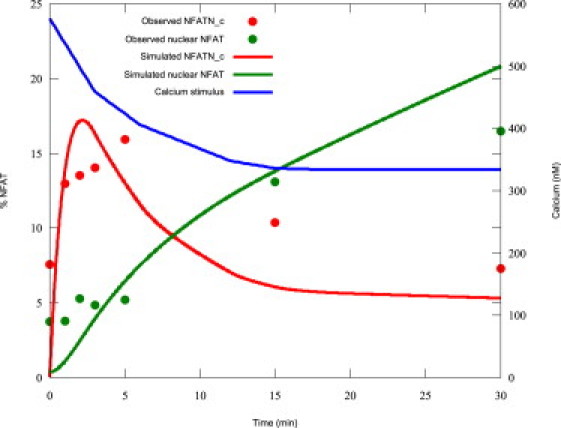
Simulated NFAT and calcium transients during the protocol of Tomida et al. (15).
A complete list of mathematical equations for the NFAT cycling model under the experimental protocols (derived from (11,15), and under dual calcium signals as discussed below) is given in the Appendix. Parameters and initial conditions are listed in Table 2, where “(Fitted value)” denotes that the parameter value was derived from the fitting process described above. For convenience, computer- and human-readable implementations of the model in modularized CellML (31) for all three protocols can be found in the online CellML Repository (http://www.cellml.org/models).
Note that in Table 2 the nuclear NFAT concentrations (NFATNn and NFATpn) are given in terms of the nuclear volume. The model steady-state values are used as initial conditions (rather than the initial conditions from one of the experimental datasets), as it is the transient behavior that is of interest, and this best assessed from steady state.
Results
Model behavior was compared with experimental results to assess the validity of the model. Specifically, the effects of calcineurin overexpression, constituent activation and calcium oscillations were investigated.
While elucidating the link between calcineurin and NFAT cycling, it was noted (32) that NFAT activation (as measured by a reporter gene) occurs more readily with overexpressed calcineurin even when the level of calcium is held constant. Additionally, research has shown that NFAT cycling occurs in the absence of calcium when calcineurin is engineered to be constituently active (33,34). These effects were explored in the model by setting the calcium level to a resting state of 100 nM, then increasing Ntot in the case of calcineurin overexpression, or by setting Nact to 1.0 to simulate the constituently active enzyme, respectively. As a proxy for NFAT activation, the amount of available dephosphorylated (and hence DNA-ready) NFAT in the nucleus (state NFATNn) was used. As can be seen in Fig. 4, the experimental findings are qualitatively replicated by model simulations of calcineurin overexpression (DNA-ready NFAT rises to 100% as calcineurin is overexpressed).
Figure 4.

Simulated DNA-ready NFAT increases as calcineurin is overexpressed.
In the case of constituently active calcineurin, simulations showed that dephosphorylation of nuclear NFAT is completely inhibited and the percentage of active NFAT is 100%, even with no calcium in the system (data not shown), as one would expect from the aforementioned experimental results.
In nonexcitable cells such as lymphocytes, NFAT cycling is stimulated by calcium oscillations. Dolmetsch et al. (28) measured NFAT translocation via the percentage of a population of cells exhibiting NFAT-induced expression of a lacZ reporter gene, and discovered that for low levels of calcium, oscillating calcium concentrations stimulate NFAT cycling more efficiently than a constant calcium signal of the same average concentration (see (28), and Fig. 2 c in that article). This result can be replicated in the model. Digitizing calcium spikes provided in Dolmetsch et al. (28) to determine the mean peak for two given average calcium concentrations—a 776 nM peak for an average of 227 nM, and 1272 nM for an average of 340 nM. Approximating the calcium pulses by a step function from the average basal value (57 nM) and using the information that pulses were of 100-ms duration, an estimation of peak time for the step function of 23.5 ms was made (in both cases, this gives the appropriate average calcium level). The required peak for each measured oscillating-calcium data point in the Dolmetsch experiment could then be calculated, to give the appropriate average as per the experimental protocol.
The peak concentration of oscillating calcium required to replicate the experiment having been determined, the model was run to steady state for a variety of both constant and oscillating calcium treatments. The results are displayed in Fig. 5, showing very similar qualitative behavior to the experimental results (compare also our simulated curves with the lines of best fit in (28), and in Fig. 2 c, that article). While the absolute level of activation is higher, the curves appear similarly shaped and crossover at approximately the same level of average calcium: at ∼365 nM in the simulated results, compared to the experimentally measured figure of 375 nM (estimated from (28), and Fig. 2 c, that article).
Figure 5.

Simulated NFAT activation for oscillating and constant calcium levels is qualitatively similar to experimental results, with simulated lines matching best-fit lines in ((28), and Fig. 2c, that article). Experimental data is from that same figure.
This comparative efficiency when stimulated by oscillations is due to the balance of the kinetics of the system. Cytosolic dephosphorylated NFAT (NFATNc) translocates to the nucleus relatively slowly and builds up during stimulation. When stimulation is removed during the oscillation cycle, this NFAT reduces again but does not have time to return to the same level as at the start of the oscillation. The next oscillation can therefore push the peak cytosolic dephosphorylated NFAT even higher. This iterative increase has a similar knock-on effect on the levels of dephosphorylated nuclear (DNA-ready) NFAT (NFATNn). Thus while the average level of calcium may remain the same as in a constant signal, the system can take some advantage of the higher peak calcium provided by an oscillatory protocol.
The activation of NFAT also decreases as the period of the oscillation increases, as shown experimentally by Dolmetsch et al. ((28), and Fig. 3 b, that article). This effect is replicated by the model simulation results in Fig. 6 and is qualitatively similar to the experimental findings, although the model was not quite as sensitive to changes in oscillation period as was observed in the experimental data.
Figure 6.

Simulated % DNA-ready NFAT with increasing calcium oscillation period is qualitatively similar to experimental results. Experimental data is from ((28), and Fig. 3b, that article).
Sensitivity to signal transduction
In nonexcitable cells such as lymphocytes, the IP3/calcineurin pathway is known to stimulate calcium oscillations (28). In contrast, the cardiac myocyte already exhibits calcium oscillations (35) from ∼100 nM to 1 μM, due to the excitation-contraction coupling mechanism of the cardiac myocyte beat (20).
Different types of myocytes have different excitation-contraction coupling calcium transients and signal transduction calcium transients. Experiments in neonatal rat cardiac myocytes indicate that stimulation with hypertrophic agonist in the periodically stimulated cardiac myocyte leads to a sustained rise in both diastolic and systolic calcium levels ((36), and Fig. 3 b, that article), essentially adding a constant rise in calcium concentration from extracellular calcium. There is also strong evidence for a rise in intracellular calcium from outside the cell in rat adult ventricular myocytes (37).
To simulate these signals, calcium-induced calcium-release calcium oscillations (CaBeat) and a stepwise constant increase in cytosolic calcium due to signal transduction (CaSigTrans) were imposed on the model, redefining calcium as
Cardiac myocyte calcium oscillations due to excitation-contraction coupling differ between species. For the purposes of this investigation, the oscillations were assumed to follow the same waveform as that used above in the protocol of Shen et al. ((11), and see Appendix, this article, for details). To explore the sensitivity of the model to constant hypertrophic signals against a background of oscillating beat calcium, CaSigTrans was varied from 0 μM (no hypertrophic stimulation) to 1 μM for a range of CaBeat pacing frequencies and the system run to steady state for each condition. The proportion of NFAT in the DNA-ready state NFATNn (nuclear, dephosphorylated) was used as a proxy for hypertrophic DNA activation.
Fig. 7 shows the increasing sensitivity of DNA-ready NFAT production to step increases in calcium concentration during calcium oscillations. The increase to nearly 100% production over the first 500 nM of calcium for a range of pacing frequencies shows that the NFAT cycling system is sensitive to the type of calcium signal one might expect from the hypertrophic pathway, even against an oscillating background.
Figure 7.

Simulated NFAT cycling sensitivity to CaSigTrans during calcium oscillations.
Discussion
The parsimonious model developed above was able to fit experimental results in the skeletal myocyte, and the fitted model exhibits behavior (with respect to total nuclear and cytosolic-dephosphorylated NFAT) qualitatively similar to that measured in lymphocytes. In addition, the model qualitatively replicates experimentally observed behavior during constitutive activation by calcineurin, oscillating calcium, and variation of calcium oscillation period. When stimulated by two calcium signals, one corresponding to the cardiac myocyte beat and the other corresponding to a hypertrophic signal, the system is shown to be sensitive to the second signal, even when both calcium signals are in the same cellular compartment.
Some researchers have postulated that the hypertrophic pathway is always “on” to some degree even without hormonal stimulation (38), due to this background oscillation. The result shown in Fig. 7 supports this view, as some percentage of NFAT is always DNA-ready. More surprisingly, the figure also indicates that under the assumptions of the model, the NFAT system is very sensitive to a sustained step change in calcium with a background oscillating calcium level.
This is likely to be due to the sensitivity of calcineurin to calcium over the range tested. Stemmer and Klee (39) illustrated that for physiological (in the cardiac myocyte) values of calmodulin, the calcineurin activation curve is most sensitive to calcium ions between pCa 6.7 and 5.8 (∼200 nM to 1.58 μM). The average calcium level under the protocol applied here varies as shown in Table 1. The table shows that the protocol explores this sweet spot in the calcineurin activation curve.
Table 1.
Nact variation with increasing CaSigTrans
| CaSigTransnM | Average calcium nM | Average pCa | Average Nact % |
|---|---|---|---|
| None | 154 | 6.82 | 2.00 |
| 100 | 254 | 6.60 | 8.07 |
| 250 | 404 | 6.39 | 25.4 |
| 500 | 654 | 6.18 | 58.2 |
The average calcium level increases markedly as the hypertrophic signal raises both systolic and diastolic calcium levels. Additionally, the sensitivity of calcineurin to calcium over this range (shown by Nact) increases nonlinearly, particularly for CaSigTrans values <250 μM. The short timescale for calcineurin activation, coupled with the nonlinear sensitivity to calcium levels, ensures that NFAT cycling is influenced by relatively small signal transduction-induced rises even in the presence of a background oscillating calcium signal.
The model developed in this study does have several limitations. Firstly, the model was fitted to noncardiac data. We have used myocyte data as our primary dataset (skeletal muscle), combined with qualitative fits to BHK data, and replication of key behaviors from other cell types. Model precision could, however, be enhanced by fitting to explicitly cardiac-derived data under similar protocols to those used in Shen et al. (11) and Tomida et al. (15), as such data becomes available. There may also be species differences—for example, in rabbit ventricular myocytes, α-adrenergic stimulation seems to increase systolic, but not diastolic, calcium (40), whereas there is evidence for sustained calcium elevation in adult rat ventricular myocytes (37). Additionally, stimulation in experiments in adult ventricular myocytes yields a calcium spike of sufficient magnitude to affect NFAT cycling, which has not been modeled here. It is therefore possible that a more complete picture of adult ventricular myocyte NFAT cycling could be derived by accounting for these effects. Here we considered a simple case, which adequately explores the question of interest.
Currently, since the exact concentration of free versus NFAT-bound calcineurin is not explicitly tracked, there is no possibility of calcineurin becoming saturated with NFAT and being unable to dephosphorylate any more. This saturation may occur if the total NFAT concentration was greater than the total calcineurin concentration (which was set to 1 μM). There is no reliable measure of NFAT concentration in cardiac myocytes, but if it was found to be higher than that value, then this limitation should be addressed. The simplest way would be to track calcineurin separately in both nuclear and cytosolic compartments. One modeling study (21) indicates that calcineurin activation may, at high calcium oscillation frequencies, be an accumulative process. Given further experimental research in this area, these extensions, if applicable, would require a time-dependent model of calcium activation of calcineurin, and a more explicit formulation of the communication of free calcineurin between the cytosol and nucleus. These have not been done in this study so as not to complicate the model with extra processes containing high levels of uncertainty.
While model results fit the data from Shen et al. (11) when that data is considered in aggregate, many of the experiments suggest that post-stimulation (after the 60-min mark) nuclear NFAT continues to rise before declining. The model does exhibit this behavior to a small degree (too small to see clearly in Fig. 2), but it is possible that this feature should be emphasized to reflect the reality in vivo. A possible mechanistic reason for this effect could be the cytosolic dephosphorylated NFAT buffering shown by the experiments ((15), and Fig. 2 b, that article), which was not as great in our fitted simulations, and would provide more import-ready NFAT to increase the nuclear transient after stimulation had ceased.
A feature of the dataset of Tomida et al. (15), which has not been replicated by the model above, is the cytosolic dephosphorylated NFAT (NFATNc) transient's apparent return to pre-calcium-stimulated levels after ∼30 min even though calcium is still raised (see (15), and Fig. 2 b, that article). This raises the intriguing possibility of the presence of an adaptive mechanism in the cytosol with respect to NFAT cycling. There has been a recent focus on an endogenous calcineurin inhibitor MCIP (modulatory calcineurin interacting protein), although this protein is known also to facilitate hypertrophy under certain conditions, with recent modeling work hypothesizing a critical nuclear NFAT threshold necessary to cause MCIP to act as a calcineurin inhibitor in the cytosol (14). If that is true, MCIP may perhaps be a candidate for an adaptive mechanism. The details of MCIP activity remain somewhat speculative, and so have not been included in this model. If NFAT transient data were collected from cardiac myocytes and this apparently adaptive effect was also shown, the inclusion of MCIP in the model formulation may drive further fruitful investigation.
Finally, the modeled system is slightly more sensitive to calcium oscillations than was reported in the experimental results. Fig. 5 shows efficiency even at low calcium of ∼88%, whereas experimental results indicate an activation level of ∼38% ((28), and Fig. 2 c, that article). It is possible that this may be because two different effects are being measured—the simulation results measure the percentage of NFAT available to bind to the DNA (the proportion in the NFATNn state), while the experimental data shows the percentage of cells expressing a reporter gene under those conditions. In reality, between these two measures lie the actual binding of NFAT to the DNA and transcription and translation of the reporter sequences. Incorporation of these additional biological processes is expected to reduce the model's apparent oversensitivity.
While some evidence is emerging that nuclear calcium transients may be involved (41,42), the model is used to explore the implications of both calcium signals being in the same compartments. In the model, full DNA-ready NFAT production occurs within the first 500 nM of signal transduction-induced calcium. An exact calibrated figure for the average calcium concentration rise due to hypertrophic stimulation is not available from the literature, but this work strongly indicates that in the cardiac myocyte, even a small increase in calcium due to signal transduction has a large effect on NFAT activation. The excitation-contraction calcium transient does not wash out the hypertrophic calcium signal, and separate compartments for excitation-contraction and excitation-transcription coupling calcium signals may not be required. Conversely, if it was found that nuclear localization does indeed play a part, the reason for this may not be the intuitively simple one of keeping the two calcium signals separated.
Here we have imposed a calcium oscillation to investigate the impact on hypertrophic signal. Further insights might be gained by the analysis of future models coupling all cytosolic calcium signal pathways in the cardiac myocyte, examining the effect of the hypertrophic signal on other cellular processes that produce or consume calcium.
Acknowledgments
M.T.C. was supported by a Bright Futures Doctoral Scholarship from the Foundation for Research, Science and Technology of New Zealand, and a Doctoral Scholarship from the University of Auckland. P.H. and E.J.C. are grateful for support from the Wellcome Trust and a Maurice Wilkins Center grant from the New Zealand Tertiary Education Committee.
Appendix—Formulation of CaBeat
The ability to define the period of the oscillations in milliseconds was added, by introducing a parameter period (measured in seconds). The inverse of this is the variable ms_in_pulse defined as the number of milliseconds the system is into a pulse of period, designated period. The protocol assumes an upstroke of 16-ms duration, followed by a return to baseline levels during the remaining time of the oscillation:
stimGradient and baseline are calculated from the period. The term baseline is the resting calcium level, and is dependent on period as rapid oscillations (<120 ms_in_pulse) will mean that calcium would not have time to reach the basal level of 93 nM again before the next upstroke. To account for this, if the period is <120 ms, the model calculates the oscillation baseline calcium from the known gradient (−9.88 nM.ms−1 (3 significant figures)) of the downstroke multiplied by the time between the peak and the end of the period (the peak is 16 ms after the start of the rise):
The gradient of the rise phase from this baseline therefore varies to reach 1121 nM in 16 ms,
where stimGradient is measured in nM.ms−1. The resulting calcium transient for several values of period (and CaSigTrans, other component of Ca) are shown in Fig. 8.
Figure 8.

Simulated calcium oscillations for several values of period and CaSigTrans.
Note that CaBeat as formulated is only valid for oscillation periods of ≥17 ms (∼59 Hz). However, this should be flexible enough for any mammal of interest.
Myocyte NFAT model equations for Shen et al. (11), Tomida et al. (15), and dual-calcium protocols
For the protocol of Shen et al. only, add
Also, replace actN in Eqs. 1 and 2 (due to calcineurin inhibitor introduction).
The calcium equations depend on the protocol being used.
For the protocol of Shen et al., use
For the protocol of Tomida et al., use
For the dual-calcium protocol, use
Supporting Material
References
- 1.Sun L., Blair H.C., Peng Y., Zaidi N., Adebanjo O.A. Calcineurin regulates bone formation by the osteoblast. Proc. Natl. Acad. Sci. USA. 2005;102:17130–17135. doi: 10.1073/pnas.0508480102. [DOI] [PMC free article] [PubMed] [Google Scholar]
- 2.Graef I.A., Mermelstein P.G., Stankunas K., Neilson J.R., Deisseroth K. L-type calcium channels and GSK-3 regulate the activity of NFATc4 in hippocampal neurons. Nature. 1999;401:703–708. doi: 10.1038/44378. [DOI] [PubMed] [Google Scholar]
- 3.Janeway C.A.J., Travers P., Walport M., Shlomchik M.J. 6th Ed. Garland Press; New York: 2005. Immunobiology: The Immune System in Health and Disease. [Google Scholar]
- 4.Larrieu D., Thiebaud P., Duplaa C., Sibon I., Theze N. Activation of the Ca2+/calcineurin/NFAT2 pathway controls smooth muscle cell differentiation. Exp. Cell Res. 2005;310:166–175. doi: 10.1016/j.yexcr.2005.07.021. [DOI] [PubMed] [Google Scholar]
- 5.Molkentin J.D., Lu J.-R., Antos C.L., Markham B., Richardson J. A calcineurin-dependent transcriptional pathway for cardiac hypertrophy. Cell. 1998;93:215–228. doi: 10.1016/s0092-8674(00)81573-1. [DOI] [PMC free article] [PubMed] [Google Scholar]
- 6.Heineke J., Molkentin J.D. Regulation of cardiac hypertrophy by intracellular signaling pathways. Nat. Rev. Mol. Cell Biol. 2006;7:589–600. doi: 10.1038/nrm1983. [DOI] [PubMed] [Google Scholar]
- 7.Wilkins B.J., Molkentin J.D. Calcium-calcineurin signaling in the regulation of cardiac hypertrophy. Biochem. Biophys. Res. Commun. 2004;322:1178–1191. doi: 10.1016/j.bbrc.2004.07.121. [DOI] [PubMed] [Google Scholar]
- 8.Crabtree G.R., Olson E.N. NFAT signaling: choreographing the social lives of cells. Cell. 2002;109:S67–S79. doi: 10.1016/s0092-8674(02)00699-2. [DOI] [PubMed] [Google Scholar]
- 9.Berridge M.J., Bootman M.D., Roderick H.L. Calcium signaling: dynamics, homeostasis and remodeling. Nat. Rev. Mol. Cell Biol. 2003;4:517–529. doi: 10.1038/nrm1155. [DOI] [PubMed] [Google Scholar]
- 10.Cooling M., Hunter P., Crampin E.J. Modeling hypertrophic IP3 transients in the cardiac myocyte. Biophys. J. 2007;93:3421–3433. doi: 10.1529/biophysj.107.110031. [DOI] [PMC free article] [PubMed] [Google Scholar]
- 11.Shen T., Cseresnyes Z., Liu Y., Randall W.R., Schneider M.F. Regulation of the nuclear export of the transcription factor NFATc1 by protein kinases after slow fiber type electrical stimulation of adult mouse skeletal muscle fibers. J. Physiol. 2007;579:535–551. doi: 10.1113/jphysiol.2006.120048. [DOI] [PMC free article] [PubMed] [Google Scholar]
- 12.Fisher W., Yang P.-C., Medikonduri R., Jafri M. NFAT and NFkB activation in T lymphocytes: a model of differential activation of gene expression. Ann. Biomed. Eng. 2006;34:1712–1728. doi: 10.1007/s10439-006-9179-4. [DOI] [PMC free article] [PubMed] [Google Scholar]
- 13.Arron J.R., Minslow M.M., Polleri A., Chang A., Chang C.-P. NFAT dysregulation by increased dosage of DSCR1 and DYRK1A on chromosome 21. Nature. 2006;441:595–600. doi: 10.1038/nature04678. [DOI] [PubMed] [Google Scholar]
- 14.Shin S.Y., Choo S.M., Kim D., Baek S.J., Wolkenhauer O. Switching feedback mechanisms realize the dual role of MCIP in the regulation of calcineurin activity. FEBS Lett. 2006;580:5965–5973. doi: 10.1016/j.febslet.2006.09.064. [DOI] [PubMed] [Google Scholar]
- 15.Tomida T., Hirose K., Takizawa A., Shibasaki F., Iino M. NFAT function as a working memory of Ca2+ signals in decoding Ca2+ oscillation. Eur. Mol. Biol. Org. J. 2003;22:3825–3832. doi: 10.1093/emboj/cdg381. [DOI] [PMC free article] [PubMed] [Google Scholar]
- 16.Shibasaki F., Price E.R., Milan D., McKeon F. Role of kinases and the phosphatase calcineurin in the nuclear shuttling of transcription factor NF-AT4. Nature. 1996;382:370–373. doi: 10.1038/382370a0. [DOI] [PubMed] [Google Scholar]
- 17.Peters R. Introduction to nucleocytoplasmic transport. In: Liu X.J., editor. Xenopus Protocols. Methods in Molecular Biology. Humana Press; Totowa, NJ: 2006. [DOI] [PubMed] [Google Scholar]
- 18.Zhu J., McKeon F. NF-AT activation requires suppression of Crm1-dependent export by calcineurin. Nature. 1999;398:256–260. doi: 10.1038/18473. [DOI] [PubMed] [Google Scholar]
- 19.Zhu J., McKeon F. Nucleocytoplasmic shuttling and the control of NF-AT signaling. Cell. Mol. Life Sci. 2000;57:411–420. doi: 10.1007/PL00000703. (CMLS) [DOI] [PMC free article] [PubMed] [Google Scholar]
- 20.Bers D.M. 2nd Ed. Kluwer Academic Publishers; Dordrecht, The Netherlands: 2002. Excitation-Contraction Coupling and Cardiac Contractile Force. [Google Scholar]
- 21.Tavi P., Pikkarainen S., Ronkainen J., Niemela P., Ilves M. Pacing-induced calcineurin activation controls cardiac Ca2+ signaling and gene expression. J. Physiol. 2004;554:309–320. doi: 10.1113/jphysiol.2003.053579. [DOI] [PMC free article] [PubMed] [Google Scholar]
- 22.Quintana A.R., Wang D., Forbes J.E., Waxham M.N. Kinetics of calmodulin binding to calcineurin. Biochem. Biophys. Res. Commun. 2005;334:674–680. doi: 10.1016/j.bbrc.2005.06.152. [DOI] [PubMed] [Google Scholar]
- 23.Melchior F., Gerace L. Two-way trafficking with Ran. Trends Cell Biol. 1998;8:175–179. doi: 10.1016/s0962-8924(98)01252-5. [DOI] [PubMed] [Google Scholar]
- 24.Lipp P., Thomas D., Berridge M.J., Bootman M.D. Nuclear calcium signaling by individual cytoplasmic calcium puffs. EMBO J. 1997;16:7166–7173. doi: 10.1093/emboj/16.23.7166. [DOI] [PMC free article] [PubMed] [Google Scholar]
- 25.Allbritton N.L., Oancea E., Kuhn M.A., Meyer T. Source of nuclear calcium signals. Proc. Natl. Acad. Sci. USA. 1994;91:12458–12462. doi: 10.1073/pnas.91.26.12458. [DOI] [PMC free article] [PubMed] [Google Scholar]
- 26.Beals C.R., Sheridan C.M., Turck C.W., Gardner P., Crabtree G.R. Nuclear export of NF-ATc enhanced by glycogen synthase kinase-3. Science. 1997;275:1930–1933. doi: 10.1126/science.275.5308.1930. [DOI] [PubMed] [Google Scholar]
- 27.Okamura H., Aramburu J., Garcia-Rodriguez C., Viola J.P.B., Raghavan A. Concerted dephosphorylation of the transcription factor NFAT1 induces a conformational switch that regulates transcriptional activity. Mol. Cell. 2000;6:539–550. doi: 10.1016/s1097-2765(00)00053-8. [DOI] [PubMed] [Google Scholar]
- 28.Dolmetsch R.E., Xu K., Lewis R.S. Calcium oscillations increase the efficiency and specificity of gene expression. Nature. 1998;392:933–936. doi: 10.1038/31960. [DOI] [PubMed] [Google Scholar]
- 29.Cofan M., Nicolas J.M., Fernandez-Sola J., Robert J., Tobias E., Sacanella E. Acute ethanol treatment decreases intracellular calcium-ion transients in mouse single skeletal muscle fibers in vitro. Alcohol Alcohol. 2000;35:134–138. doi: 10.1093/alcalc/35.2.134. [DOI] [PubMed] [Google Scholar]
- 30.Liu Y., Randall W.R., Schneider M.F. Activity-dependent and -independent nuclear fluxes of HDAC4 mediated by different kinases in adult skeletal muscle. J. Cell Biol. 2005;168:887–897. doi: 10.1083/jcb.200408128. [DOI] [PMC free article] [PubMed] [Google Scholar]
- 31.Cooling M.T., Hunter P., Crampin E.J. Modeling biological modularity with CellML. IET Sys. Biol. 2008;2:73–79. doi: 10.1049/iet-syb:20070020. [DOI] [PubMed] [Google Scholar]
- 32.Clipstone N.A., Crabtree G.R. Identification of calcineurin as a key signaling enzyme in T-lymphocyte activation. Nature. 1992;357:695–697. doi: 10.1038/357695a0. [DOI] [PubMed] [Google Scholar]
- 33.Goldfeld A.E., Tsai E., Kincaid R., Belshaw P.J., Schrieber S.L. Calcineurin mediates human tumor necrosis factor. α-gene induction in stimulated T and B cells. J. Exp. Med. 1994;180:763–768. doi: 10.1084/jem.180.2.763. [DOI] [PMC free article] [PubMed] [Google Scholar]
- 34.O'Keefe S.J., Tamura J., Kincaid R., Tocci M.J., O'Neill E.A. FK-506- and CsA-sensitive activation of the interleukin-2 promotor by calcineurin. Nature. 1992;357:692–694. doi: 10.1038/357692a0. [DOI] [PubMed] [Google Scholar]
- 35.Touyz R.M., Fareh J., Thibault G., Schiffrin E.L. Intracellular Ca2+ modulation by angiotensin II and endothelin-1 in cardiomyocytes and fibroblasts from hypertrophied hearts of spontaneously hypertensive rats. Hypertension. 1996;28:797–805. doi: 10.1161/01.hyp.28.5.797. [DOI] [PubMed] [Google Scholar]
- 36.Hunton D.L., Lucchesi P.A., Pang Y.I., Cheng X., Dell'Italia L.J. Capacitative calcium entry contributes to nuclear factor of activated T-cells nuclear translocation and hypertrophy in cardiomyocytes. J. Biol. Chem. 2002;277:14266–14273. doi: 10.1074/jbc.M107167200. [DOI] [PubMed] [Google Scholar]
- 37.Hunton D.L., Zou L.-Y., Pang Y., Marchase R.B. Adult rat cardiomyocytes exhibit capacitative calcium entry. Am. J. Physiol. Heart Circ. Physiol. 2004;286:H1124–H1132. doi: 10.1152/ajpheart.00162.2003. [DOI] [PubMed] [Google Scholar]
- 38.Wilkins B.J., Molkentin J.D. Calcineurin and cardiac hypertrophy: Where have we been? Where are we going? J. Physiol. 2002;541:1–8. doi: 10.1113/jphysiol.2002.017129. [DOI] [PMC free article] [PubMed] [Google Scholar]
- 39.Stemmer P.M., Klee C.B. Dual calcium ion regulation of calcineurin by calmodulin and calcineurin B. Biochemistry. 1994;33:6859–6866. doi: 10.1021/bi00188a015. [DOI] [PubMed] [Google Scholar]
- 40.Fujita S., Endoh M. Effects of endothelin-1 on [Ca2+]i-shortening trajectory and Ca2+ sensitivity in rabbit single ventricular cardiomyocytes loaded with Indo-1/AM: comparison with the effects of phenylephrine and angiotensin II. J. Card. Fail. 1996;2:S45–S56. doi: 10.1016/s1071-9164(96)80058-3. [DOI] [PubMed] [Google Scholar]
- 41.Wu X., Zhang T., Bossuyt J., Li X., McKinsey T.A. Local InsP3-dependent perinuclear Ca2+ signaling in cardiac myocyte excitation-transcription coupling. J. Clin. Invest. 2006;116:675–682. doi: 10.1172/JCI27374. [DOI] [PMC free article] [PubMed] [Google Scholar]
- 42.Zima A.V., Bare D.J., Mignery G.A., Blatter L.A. IP3-dependent nuclear Ca2+ signaling in the mammalian heart. J. Physiol. 2007;584:601–611. doi: 10.1113/jphysiol.2007.140731. [DOI] [PMC free article] [PubMed] [Google Scholar]
Associated Data
This section collects any data citations, data availability statements, or supplementary materials included in this article.