Abstract
To study stability and inheritance of two different transgenes in barley, we crossed a homozygous T8 plant, having uidA (or gus) driven by the barley endosperm-specific B1-hordein promoter (localized in the near centromeric region of chromosome 7H) with a second homozygous T4 plant, having sgfp(S65T) driven by the barley endosperm-specific D-hordein promoter (localized on the subtelomeric region of chromosome 2H). Both lines stably expressed the two transgenes in the generations prior to the cross. Three independently crossed F1 progeny were analyzed by PCR for both uidA and sgfp(S65T) in each plant and functional expression of GUS and GFP in F2 seeds followed a 3:1 Mendelian segregation ratio and transgenes were localized by FISH to the same location as in the parental plants. FISH was used to screen F2 plants for homozygosity of both transgenes; four homozygous plants were identified from the two crossed lines tested. FISH results showing presence of transgenes were consistent with segregation ratios of expression of both transgenes, indicating that the two transgenes were expressed without transgene silencing in homozygous progeny advanced to the F3 and F4 generations. Thus, even after crossing independently transformed, homozygous parental plants containing a single, stably expressed transgene, progeny were obtained that continued to express multiple transgenes through generation advance. Such stability of transgenes, following outcrossing, is an important attribute for trait modification and for gene flow studies.
Keywords: Barley, Crossing, FISH, Hordein promoter, Transgene expression stability, Transgene inheritance
Introduction
Rapid progress in tissue culture and transformation technologies has allowed successful production of transgenic plants in most cereal crops (Lemaux et al. 1999; Vasil 2007; Ganeshan et al. 2008). For practical application of these technologies, such as trait improvement and gene flow studies, it is essential that introduced genes of interest be stably expressed and transmitted intact during generation advance and following outcrossing. Transgene instability (gene silencing and/or loss) can be the result of a number of factors, e.g., methylation, copy number, chromosomal insertion site, genome rearrangement and homology of the transgene with endogenous genes (Finnegan and McElroy 1994; Flavell 1994; Stam et al. 1997; Meng et al. 2006).
Numerous studies of transgene behavior have revealed that instability of expression and inheritance is common in transgenic plants (for review, Iyer et al. 2000). For example, in one study in wheat, expression of transgenes driven by a constitutive promoter showed frequent gene silencing (Demeke et al. 1999). That is, in F2 progeny from a cross of the transgenic parent with the nontransgenic parental plant, expression from uidA and nptII, both controlled by a rice actin1 promoter, was unstable, the result of methylation. In another study, wheat transgenes, driven by the constitutive maize ubiquitin1 promoter, were silenced in most (20/24) wheat lines in the T1 or T2 generations (Anand et al. 2003). In a study in barley one of two transgenic sublines, homozygous for both bar and uidA under the control of the maize ubiquitin promoter and expressing in T3, experienced silencing of both transgenes in all T6 progeny (Meng et al. 2003).
In contrast to these studies, stable expression and inheritance of transgenes driven by a seed-specific promoter in transgenic barley were observed up to the T5 generation (Cho et al. 1999; Horvath et al. 2001). In a more recent study, expression of both uidA and sgfp(S65T), driven by barley endosperm-specific promoters, B1- and D-hordein, respectively, was more stable than expression from bar driven by the maize ubi1 promoter (Choi et al. 2003). Transgene expression under the control of seed-specific promoters was stable in nearly all (93%; 14/15) transgenic barley lines in T4 and later generations, while only 60% (9/15) of lines with bar under control of the maize ubi1 promoter had stable transgene expression.
Although two or more genes can be introduced into plant cells during transformation, expression levels of each gene may not be equally stable or at the levels needed to achieve the desired result(s). One approach to avoid such undesirable outcomes is to select transgenic plants stably expressing individual transgenes at desired levels in an advanced generation and cross them to obtain plants expressing multiple transgenes. In the present study, two different transgenic barley plants, each of which stably expressed either uidA or sgfp(S65T) driven by different barley endosperm-specific promoters, were crossed and functional expression of both transgenes were analyzed in progeny up to the F4 generation. Plants were screened in F2 for homozygosity of both uidA and sgfp(S65T) using fluorescence in situ hybridization (FISH).
Materials and methods
Crossing of transgenic barley plants
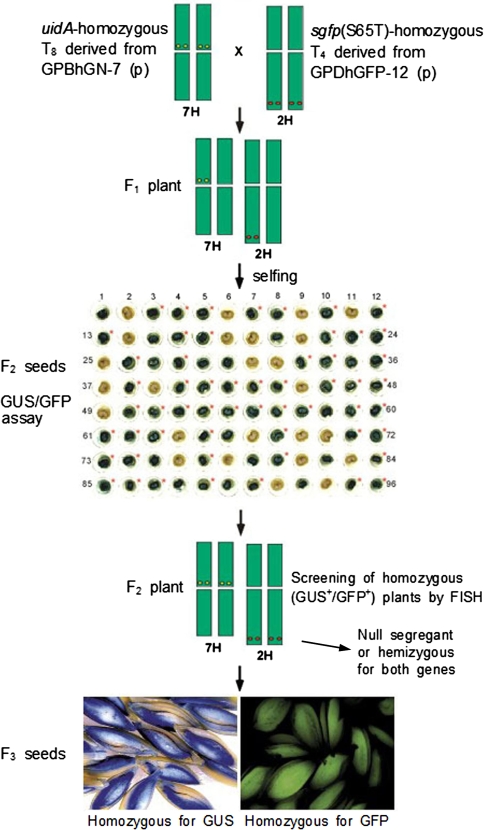
Transgenic lines, GPBhGN-7 and GPDhGFP-12, were obtained via microprojectile bombardment of immature embryos of a spring cultivar, Golden Promise, of barley (Hordeum vulgare L.; 2n = 2x = 14) (Cho et al. 1999, 2002). p16 (Sørensen et al. 1996) was used for production of transgenic line GPBhGN-7 (Cho et al. 1999), while pDhsGFP-1 was used for production of transgenic line GPDhGFP-12 (Cho et al. 2002). p16 contains uidA under the control of the barley endosperm-specific B1-hordein promoter. pDhsGFP-1 contains the synthetic gene [sgfp(S65T)] encoding the green fluorescent protein (GFP) under control of the barley endosperm-specific D-hordein promoter. Homozygous transgenic plants derived from GPBhGN-7 (T8) and GPDhGFP-12 (T4) were grown in the greenhouse and used for crosses (Fig. 1). Homozygous plants were identified using PCR, FISH and segregation ratios of transgene expression (Choi et al. 2002).
Fig. 1.
Screening of homozygous plants using GUS/GFP assay and FISH from crossed transgenic barley plants. F1 seeds were obtained from the cross of two parental plants, a homozygous T8 plant derived from GPBhGN-7 and a homozygous T4 plant derived from GPDhGFP-12; three F1 plants were tested for GUS/GFP activities. GFP expression in F2 seeds was performed using cross-sectioned half-seeds without immature embryos; GUS assay was then performed using the same materials. Expression of sgfp(S65T) is marked by an asterisk. Half-seeds with embryos expressing both GFP and GUS were saved and grown for next generations. Numbers indicate the seed number examined (Table 1). FISH technique was employed to screen the homozygous [uidA and sgfp(S65T)] F2 plants by direct mapping of transgenes on the chromosomes (Table 2; Fig. 3). Inserted uidA and sgfp(S65T) genes were localized on the centromeric region of chromosome 7H and on the subtelomeric region of chromosome 2H, respectively. Homozygous F3 generation seeds were obtained by analyzing segregation ratios of transgenes
Genomic DNA isolation and polymerase chain reaction (PCR)
To test the presence of uidA in F1 plants and their progeny, 500 ng of genomic DNA purified from leaf tissues was used in PCR amplifications using the primer set, UIDA1 (5′-agcggccgcaTTACGTCCTGTAGAAACC-3′) and UID2R (5′-agagctcTCATTGTTTGCCTCCCTG-3′) (Lemaux et al. 1996); small underlined letters indicate restriction enzyme sites used for subcloning. Presence of sgfp(S65T) in pGPDhGFP-12-derived transformants was determined using the primer set, DhorsGFP1 (5′-ACGAGTCTAGACCATGGTGA-3′) and sGFP4R (5′-agaggtaccTTACTTGTACAGCTCGTC-3′) (Cho et al. 2002). Amplifications were performed in a 25-μl reaction as described (Cho et al. 1998) with modifications, i.e., Taq DNA polymerase (Qiagen, Valencia, CA, USA) with Q-solution was used.
Fluorescence in situ hybridization
The Fluorescence in situ hybridization (FISH) procedure used was as described previously (Choi et al. 2002, 2003) with modifications. The 1.8-kb uidA fragment from p16 and the 0.72-kb sgfp(S65T) fragment from pDhsGFP-1 were labeled with biotin-16-dUTP by nick translation according to manufacturer’s instructions (Boehringer Mannheim, Indianapolis, IN, USA). In some cases, the entire plasmid was used for probe labeling. After detection and photography of the first probing (uidA/FITC-avidin D), coverslips were carefully removed and the slides washed with 2× SSC three times for 5 min, and further washed with detection buffer (4× SSC/0.2% Tween 20) three times for 60 min at room temperature. Slides were dehydrated in an alcohol series and the second probe for sgfp(S65T), Cy3-avidin, was applied. Slides were examined with a Zeiss 510 confocal laser-scanning microscope with filter sets 02, 10 and 15. Representative FISH images were captured using Adobe Photoshop version 5.0.
Functional GFP and GUS assays of individual immature seeds
Functional assays of GFP and GUS in immature seeds were performed using cross-sectioned F1 half-seeds without embryos (Fig. 1). Individual half-seeds were placed in 96-well ELISA plates and corresponding half-seeds with immature embryos were labeled and saved in another ELISA plate for germination. GFP expression was observed using a Zeiss Axiophot epifluorescence microscope equipped with a Chroma filter containing a 450-490 excitation filter and an LP520 emission barrier filter (Cho et al. 2002). After the nondestructive GFP activity assay, samples were used for histochemical GUS assays (Jefferson et al. 1987) using 5-bromo-4-chloro-3-indoxyl-β-d-glucuronic acid (X-gluc). Saved half-seeds with immature embryos, positive for both GFP and GUS expression, were germinated on hormone-free rooting medium (BCI-DM−) and a week after germination, F2 plantlets were transferred to soil and used for further analyses.
Quantitative assays of GUS activity and western blotting of GFP
Quantitative measurements of GUS activity were performed (Jefferson et al. 1987) using a 4-methylumbellifery-β-d-glucuronide (MUG) substrate (Sigma, St. Louis, MO, USA). From each line, ten, single mature seeds were ground and GUS extraction buffer added. After centrifugation supernatant fractions were used to determine GUS activity. Protein concentrations in extracts were measured (Bradford 1976) using Bio-Rad reagent (Bio-Rad, Richmond, CA, USA). Fluorescence of 4-methylumbelliferone (4-MU) was measured on a TKO 100-dedicated min fluorometer (Hoefer Scientific Instruments, San Francisco, CA, USA) at an excitation wavelength of 365 nm and an emission wavelength of 460 nm (Cho et al. 1999).
For immunological detection of GFP expression, five mature seeds from each transgenic line were ground with a mortar and pestle, mixed with 0.4 ml protein extraction buffer (50 mM Tris, 500 mM NaCl, pH 7.5) containing protease inhibitor cocktail (Roche, Indianapolis, IN, USA), and incubated on ice for 30 min. After centrifugation (10,000×g for 10 min, 4°C), the supernatant was used for immunoblot analyses. Twenty micrograms of total soluble protein from each line and 20 ng of purified GFP protein (Clontech, Mountain View, CA, USA) as a positive control were separated on SDS-PAGE using 10–20% Tris-glycine gel (Invitrogen, Carlsbad, CA, USA) and transferred to nitrocellulose membrane (Molecular Probe, Eugene, OR, USA). After transfer, the membrane was blocked in TBS-T (10 mM Tris–HCl, pH 8.0, 150 mM NaCl, 0.1% Tween 20) + 5% nonfat dried milk for 1 h. After washing (2 × 15 min) in TBS-T, rabbit polyclonal GFP antibody (Santa Cruz Biotechnology, Inc., Santa Cruz, CA, USA) (1:2,000 dilution in blocking buffer) was added and incubated for 2.5–3 h. After washing in TBS-T, the membrane was incubated in goat anti-rabbit HRP conjugate IgG (Santa Cruz Biotechnology, Inc.) at 1:5,000 dilution for 1 h at room temperature and washed as indicated above. Labeling was monitored by chemiluminescence (Pierce Biotechnology, Inc., Rockford, IL, USA) according to manufacturer’s instructions. GFP signal was quantified using Quantity One Quantitation Software (Bio-Rad, Hercules, CA, USA). This experiment was repeated twice.
Results
Production of F1 plants by crossing and segregation of uidA and sgfp(S65T) in F2 progeny
To obtain homozygous transgenic plants containing both uidA and sgfp(S65T) genes, homozygous transgenic plants derived from GPBhGN-7 and GPDhGFP-12 (Fig. 1) were crossed. GPBhGN-7 is a line with uidA driven by the barley endosperm-specific B1-hordein promoter (Cho et al. 1999); a homozygous T8 progeny plant was used for crossing. This transgenic line has both uidA and bar genes, but only uidA was stably expressed to the T9 generation (Choi et al. 2003). GPDhGFP-12 is a line with sgfp(S65T) driven by the barley endosperm-specific D-hordein promoter (Cho et al. 2002); a homozygous T4 plant was used for crossing. This transgenic line has both sgfp(S65T) and bar, but only sgfp(S65T) expression was stable to the T6 generation (Choi et al. 2003).
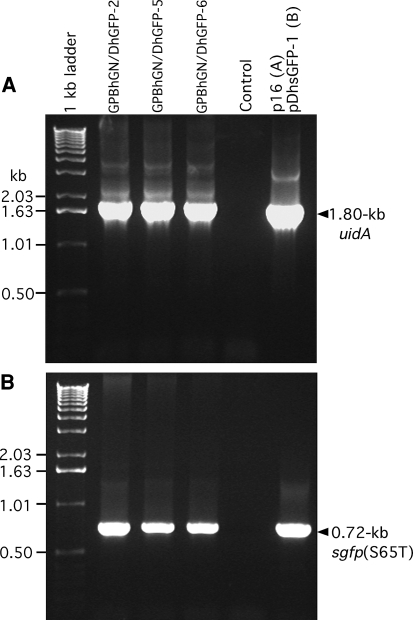
After crossing the transgenic plants, three F1 plants (GPBhGN/DhGFP-2, GPBhGN/DhGFP-5 and GPBhGN/DhGFP-6) were tested for both uidA and sgfp(S65T) by PCR (Fig. 2); the three F1 plants were positive for both transgenes (Table 1). Functional assays of GUS and GFP in F2 immature seeds, using cross-sectioned half-seeds without embryos, were performed to screen for seeds expressing from both uidA and sgfp(S65T) (Fig. 1). All three crossed lines showed a 3:1 Mendelian segregation ratio for both GUS and GFP expression (Table 1).
Fig. 2.
PCR analysis of genomic DNA from nontransgenic control and from three F1 lines from crosses. a 1.8-kb uidA fragment. b 0.72-kb sgfp(S65T) fragment. Plasmids, p16 (a) and pDhsGFP-1 (b) were used in positive control reactions; water was used in negative control reactions (Control). Molecular weights in kb are indicated on left
Table 1.
Analysis of expression and inheritance of two endosperm-specific transgenes [uidA and sgfp(S65T)] after crossing between transgenic barley plants, GPBhGN-7 (T8) and GPDhGFP-12 (T4)
| Crossed line | F1 plant | Expression in F2 seed | ||
|---|---|---|---|---|
| uidA/sgfp(S65T) PCR (±) | # of seeds examined | GUS (+/−) | GFP (+/−) | |
| GPBhGN/DhGFP-2 | +/+ | 96 | 71/25† | 77/19† |
| GPBhGN/DhGFP-5 | +/+ | 96 | 80/16† | 78/18† |
| GPBhGN/DhGFP-6 | +/+ | 96 | 70/26† | 70/26† |
†Analyses of transgene segregation ratio of F2 seed using χ2-test were not significantly different from 3:1 (at a = 0.05)
Screening of homozygous F2 plants by FISH
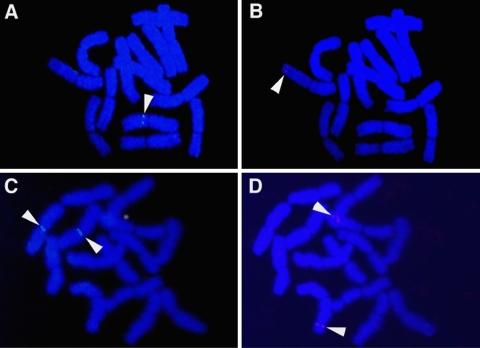
The FISH technique was applied to screen for F2 progeny homozygous for both uidA and sgfp(S65T), in two out of the three crossed F1 plants (Table 2; Figs. 3, 4). Both transgenes were localized on metaphase chromosomes in GPBhGN/DhGFP-2 and GPBhGN/DhGFP-5. As expected, uidA was localized in F1 plants near the centromeric region of chromosome 7H while sgfp(65T) was localized on the subtelomeric region of chromosome 2H, the same localization observed in parental plants (Choi et al. 2002). Hemizygous plants for both uidA and sgfp(S65T) had only a single signal on one of the homologous chromosomes (Fig. 3a, b), while homozygous plants had doublet signals on both homologous chromosomes (Fig. 3c, d). Based on FISH analysis of seven F2 plants derived from GPBhGN/DhGFP-2, two (GPBhGN/DhGFP-2-7 and GPBhGN/DhGFP-2-10) were homozygous for both uidA and sgfp(s65T) (Table 2). The remaining plants were either hemizygous for both uidA and sgfp(s65T) or homozygous for only one of the two transgenes. In another F1 plant (GPBhGN/DhGFP-5), two (GPBhGN/DhGFP-5-4 and GPBhGN/DhGFP-5-11) out of seven F2 plants tested, were homozygous for both uidA and sgfp(S65T) (Table 2).
Table 2.
Screening of homozygous plant using FISH in F2 plants and expression of transgenes in F3/F4 seeds
| Crossed plant line | # of FISH signals on the homologous chromosome in F2 plant | Expression in F3 seed | Expression in F4 seed | |||||
|---|---|---|---|---|---|---|---|---|
| # of seeds examined | GUS (+/−) | GFP (+/−) | # of seeds examined | GUS (+/−) | GFP (+/−) | |||
| uidA | sgfp(S65T) | |||||||
| GPBhGN/DhGFP-2-3 | 1 | 2 | 50 | 38/12† | 50/0 | |||
| GPBhGN/DhGFP-2-4 | 1 | 1 | 34 | 21/13† | 27/7† | |||
| GPBhGN/DhGFP-2-7a | 2 | 2 | 37 | 37/0 | 37/0 | |||
| GPBhGN/DhGFP-2-7-1a | 58 | 58/0 | 58/0 | |||||
| GPBhGN/DhGFP-2-7-2a | 53 | 53/0 | 53/0 | |||||
| GPBhGN/DhGFP-2-7-3a | 46 | 46/0 | 46/0 | |||||
| GPBhGN/DhGFP-2-10a | 2 | 2 | 76 | 76/0 | 76/0 | |||
| GPBhGN/DhGFP-2-12 | 2 | 1 | 54 | 54/0 | 43/11† | |||
| GPBhGN/DhGFP-2-16 | 1 | 1 | 40 | 31/9† | 27/13† | |||
| GPBhGN/DhGFP-2-22 | 1 | 1 | 32 | 22/10† | 27/5† | |||
| GPBhGN/DhGFP-5-1 | 2 | 1 | 44 | 44/0 | 32/12† | |||
| GPBhGN/DhGFP-5-3 | 1 | 2 | 33 | 24/9† | 33/0 | |||
| GPBhGN/DhGFP-5-4a | 2 | 2 | 39 | 39/0 | 39/0 | |||
| GPBhGN/DhGFP-5-5 | 1 | 1 | 54 | 39/15† | 44/10† | |||
| GPBhGN/DhGFP-5-6 | 1 | 2 | 44 | 38/6† | 44/0 | |||
| GPBhGN/DhGFP-5-7 | 1 | 1 | 38 | 25/13† | 29/9† | |||
| GPBhGN/DhGFP-5-11a | 2 | 2 | 33 | 33/0 | 33/0 | |||
| GPBhGN/DhGFP-5-11-1a | 53 | 53/0 | 53/0 | |||||
| GPBhGN/DhGFP-5-11-2a | 53 | 53/0 | 53/0 | |||||
| GPBhGN/DhGFP-5-11-3a | 45 | 45/0 | 45/0 | |||||
aHomozygous for both uidA and sgfp(S65T) genes
†Analyses of transgene segregation ratio of F3 heterozygous seed using χ2-test were not significantly different from 3:1 (at a = 0.05)
Fig. 3.
FISH of transgenes [uidA and sgfp(S65T)] in F2 plants. a, b. Hemizygous plant with both (a) a single signal of uidA (arrow) inserted on the centromeric region of chromosome 7H and (b) a single signal of sgfp(S65T) (arrow) inserted on the subtelomeric region of chromosome 2H. c, d Homozygous plant with both (c) doublet signals of uidA and (d) sgfp(S65T) on homologous chromosomes (Fig. 4)
Fig. 4.
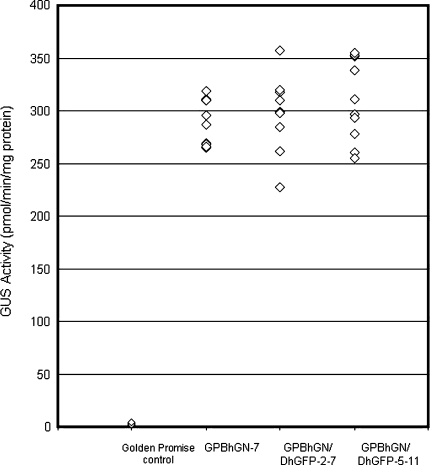
GUS activities in mature transgenic seeds. GUS activity was determined by fluorometric assays on protein extracts from ten, single mature seeds derived from each homozygous plant. T9 seeds derived from a parental GUS homozygote, GPBhGN-7, and F3 seeds from two homozygotes for both GUS and GFP, GPBhGN/DhGFP-2-7 and GPBhGN/DhGFP-5-11, were used for GUS activity measurements
Stable expression of both uidA and sgfp(S65T) genes in F3 and F4 progeny
Homozygous plants for both uidA and sgfp(S65T) were obtained in F2 progeny from the cross of two parental homozygous plants; FISH results showed physical presence of both transgenes in transgenic metaphase chromosomes (Fig. 3). Both transgenes were stably expressed in F3 and F4 seeds and segregation ratios based on expression of both transgenes were in agreement with FISH results in F2 plants (Table 2). All four putative homozygous plants (GPBhGN/DhGFP-2-7, GPBhGN/DhGFP-2-10, GPBhGN/DhGFP-5-4 and GPBhGN/DhGFP-5-11) were also confirmed to be homozygous by segregation ratios and functional expression of transgenes.
Expression levels of transgenes in progeny from crosses
Quantitative GUS-activity measurements were performed using ten, single mature seeds from each line. As shown in Fig. 4, seeds from transgenic plants, GPBhGN/DhGFP-2-7 and GPBhGN/DhGFP-5-11, showed GUS activities similar to T9 seeds from a homozygous parental GUS line derived from GPBhGN-7.
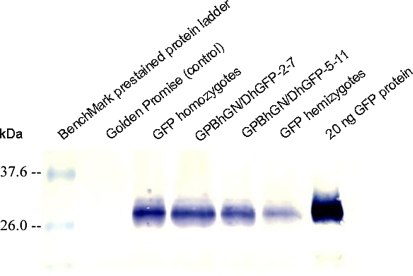
GFP expression in transgenic plants was determined by western analysis using five mature seeds from each line. GPBhGN/DhGFP-2-7 (3.09 ng) and GPBhGN/DhGFP-5-11 (1.79 ng) showed similar or slightly lower levels of GFP expression, compared with that of T5 seeds from parental transgenic GFP homozygotes (3.23 ng) derived from GPDhGFP-12 (Fig. 5). GPBhGN/DhGFP-2-7 (3.09 ng) and GPBhGN/DhGFP-5-11 (1.79 ng) showed much higher levels of GFP expression than the GFP hemizygotes (0.57 ng). Thus, the GPBhGN/DhGFP-2-7 line had similar expression levels of both GUS and GFP, compared with their homozygous parental plants containing a single transgene (Figs. 4, 5).
Fig. 5.
GFP expression levels in mature transgenic seeds. GFP quantification was determined with western blot hybridization analysis using protein extracts from five mature seeds derived from each line. T5 seeds derived from a parental GFP homozygote, GPDhGFP-12, and F3 seeds from two homozygotes for both GUS and GFP, GPBhGN/DhGFP-2-7 and GPBhGN/DhGFP-5-11, were used for GFP expression level measurements. Lane 1 BenchMark™ prestained protein ladder, lane 2 Golden Promise, lane 3 GFP homozygotes, lane 4 GPBhGN/DhGFP-2-7, lane 5: GPBhGN/DhGFP-5-11, lane 6 GFP hemizygotes, lane 7 20 ng GFP protein
Discussion
Expression of two or more genes is sometimes needed to enable, for example, an entire metabolic pathway to function properly, as with the cytosolic isoprenoid pathway leading to production of the antimalarial agent, artemisinin (for review, Liu et al. 2005), or to achieve desired levels of a trait, like vitamin A (Paine et al. 2005). Even though multiple genes can be transformed into plant cells, instability of expression of one or more transgenes frequently occurs in transgenic plants (Chen et al. 1998; Melander et al. 2006; Tobias et al. 2007) resulting in one transgene in the plant not reaching and/or maintaining levels needed to achieve the trait phenotype. One approach to avoiding this situation is to select transgenic plants at an advanced generation that are each stably expressing an individual transgene at the desired level and to cross them to obtain progeny expressing multiple transgenes.
The question then arises as to the stability of transgene expression following outcrossing. To address this question, a homozygous T8 plant from GPBhGN-7 (Cho et al. 1999) was crossed in this study with another homozygous plant (T4) from GPDhGFP-12 (Cho et al. 2002). These lines were chosen because the transgenes in the two lines were localized on different chromosomes and could be screened with FISH for homozygosity of both transgenes in the same plant. Progeny from the crosses of the two homozygous barley lines that individually expressed either uidA or sgfp(S65T) in late-generation plants, were analyzed for physical and expression stability up to the F4 generation. After crossing the two homozygous plants, three F1 plants (GPBhGN/DhGFP-2, GPBhGN/DhGFP-5 and GPBhGN/DhGFP-6) were positive for both uidA and sgfp(S65T) (Table 1). Expression of both genes in progeny of crosses showed a 3:1 Mendelian segregation ratio in F2 seeds (Table 1).
Physical presence of inserted genes was observable by FISH and was used to establish homozygosity in early generations without the necessity of establishing segregation ratios or conducting further molecular analyses (Pedersen et al. 1997; Salvo-Garrido et al. 2001; Svitashev et al. 2000; Carlson et al. 2001; Bourdon et al. 2002; Choi et al. 2002, 2003). In the present study F2 progeny plants, positive for both uidA and sgfp(S65T) by PCR (Fig. 2), were screened by FISH for homozygous plants (Fig. 3). Four plants (GPBhGN/DhGFP-2-7, GPBhGN/DhGFP-2-10, GPBhGN/DhGFP-5-4 and GPBhGN/DhGFP-5-11) homozygous for both uidA and sgfp(S65T) were obtained using FISH analysis from the two crossed F2 progeny populations (GPBhGN/DhGFP-2 and GPBhGN/DhGFP-5) examined. All four plants were confirmed as homozygous based on DNA segregation and functional transgene expression ratios in F3 seeds (Table 2; Figs. 4, 5). Thus, FISH was useful for early screening to obtain homozygous plants (Choi et al. 2002, 2003). Expression of both uidA and sgfp(S65T) was stably inherited in F2, F3 and F4 progenies (Table 2), with no evidence of gene silencing.
Expression levels of GUS and GFP were measured in F3 seeds derived from two F2 progeny plants homozygous for both uidA and sgfp(S65T), GPBhGN/DhGFP-2-7 and GPBhGN/DhGFP-5-11. GUS expression in both was similar to that of the homozygous parental GUS line derived from GPBhGN-7 (Fig. 4). GPBhGN/DhGFP-2-7 and GPBhGN/DhGFP-5-11 showed similar and slightly lower levels of GFP expression, respectively, compared to the parental, transgenic GFP homozygotes derived from GPDhGFP-12 (Fig. 5). The GPBhGN/DhGFP-2-7 line had similar expression levels of both GUS and GFP, comparable to their homozygous parental plants containing a single transgene (Figs. 4, 5), confirming transgene expression stability following outcrossing.
The results presented in this study suggest that transgenic plants stably expressing two or more transgenes at the desired levels can be generated by crossing independently transformed plants. Further, homozygous plants to be used for such crosses can be identified in early generations using FISH. This approach can be used when expression of multiple genes is needed in a plant to realize the desired phenotype, like nutritional improvement of abiotic and biotic stress tolerance, or to increase expression levels of the same transgene driven by the same or different promoters by mimicking a gene dosage effect. Increasingly important is the identification of a reliable means to quantify transgene flow, for example the utilization of visual markers has been proposed (Shen and Petolino 2006). Irrespective of the marker used, however, it is important that transgene expression is stable following outcrossing in order to accurately quantitate gene flow. In this study demonstration of stability of expression of two marker genes driven by endosperm-specific promoters following crossing in a primarily self-pollinated species provides important information for the design of gene flow studies that insure stability of transgene expression following crossing and accurate assessments of gene flow frequencies.
Open Access
This article is distributed under the terms of the Creative Commons Attribution Noncommercial License which permits any noncommercial use, distribution, and reproduction in any medium, provided the original author(s) and source are credited.
Abbreviations
- ELISA
Enzyme-linked immunosorbent assay
- FISH
Fluorescence in situ hybridization
- GFP
Green fluorescent protein
- GUS
β-Glucuronidase
- SDS-PAGE
Sodium dodecyl sulfate-polyacrylamide gel electrophoresis
- SSC
Sodium chloride-sodium citrate
References
- Anand A, Trick HN, Gill BS, Muthukrishnan S (2003) Stable transgene expression and random gene silencing in wheat. Plant Biotechnol J 1:241–251 [DOI] [PubMed]
- Bourdon V, Ladbrooke Z, Wickham A, Lonsdale D, Harwood W (2002) Homozygous transgenic wheat plants with increased luciferase activity do not maintain their high level of expression in the next generation. Plant Sci 163:297–305 [DOI]
- Bradford MM (1976) A rapid and sensitive method for the quantitation of microgram quantities of protein utilizing the principle of protein-dye binding. Anal Biochem 72:248–254 [DOI] [PubMed]
- Carlson AR, Letarte J, Chen J, Kasha KJ (2001) Visual screening of microspore-derived transgenic barley (Hordeum vulgare L.) with green-fluorescent protein. Plant Cell Rep 20:331–337 [DOI]
- Chen L, Marmey P, Taylor NJ, Brizard J, Espinoza C, D’Cruz P, Huet H, Zhang S, de Kochko A, Beachy RN, Fauquet CM (1998) Expression and inheritance of multiple transgenes in rice plants. Nat Biotechnol 16:1060–1064 [DOI] [PubMed]
- Cho M-J, Jiang W, Lemaux PG (1998) Transformation of recalcitrant barley cultivars through improvement in regenerability and decreased albinism. Plant Sci 138:229–244 [DOI]
- Cho M-J, Choi HW, Buchanan BB, Lemaux PG (1999) Inheritance of tissue-specific expression of hordein promoter-uidA fusions in transgenic barley plants. Theor Appl Genet 98:1253–1262 [DOI]
- Cho M-J, Choi HW, Jiang W, Ha CD, Lemaux PG (2002) Endosperm-specific expression of green fluorescent protein driven by the hordein promoter is stably inherited in transgenic barley (Hordeum vulgare L.) plants. Physiol Plant 115:144–154 [DOI] [PubMed]
- Choi HW, Lemaux PG, Cho M-J (2002) Use of fluorescence in situ hybridization for gross mapping of transgenes and screening of homozygous plants in transgenic barley (Hordeum vulgare L.). Theor Appl Genet 106:92–100 [DOI] [PubMed]
- Choi HW, Lemaux PG, Cho M-J (2003) Long-term stability of transgene expression driven by barley endosperm-specific hordein promoters in transgenic barley. Plant Cell Rep 21:1108–1120 [DOI] [PubMed]
- Demeke T, Hucl P, Båga M, Caswell K, Leung N, Chibbar RN (1999) Transgene inheritance and silencing in hexaploid spring wheat. Theor Appl Genet 99:947–953 [DOI]
- Finnegan J, McElroy D (1994) Transgene inactivation: plant fight back!. Bio/Technol 12:883–888 [DOI]
- Flavell RB (1994) Inactivation of gene expression in plants as a consequence of specific sequence duplication. Proc Natl Acad Sci USA 91:3490–3496 [DOI] [PMC free article] [PubMed]
- Ganeshan S, Dahleen LS, Tranberg J, Lemaux PG, Chibbar RN (2008) Barley. In: Kole C, Hall TC (eds) Compendium of transgenic crop plants: transgenic cereals and forage grasses. Blackwell Publishing, Oxford, UK, pp 101–138
- Horvath H, Jensen LG, Wong OT, Kohl E, Ullrich SE, Cochran J, Kannangara CG, Wettstein D (2001) Stability of transgene expression, field performance and recombination breeding of transformed barley lines. Theor Appl Genet 102:1–11 [DOI]
- Iyer LM, Kumpuatla SP, Chandrasekharan MB, Hall TC (2000) Transgene silencing in monocots. Plant Mol Biol 43:323–346 [DOI] [PubMed]
- Jefferson RA, Kavanagh TA, Bevan MW (1987) GUS fusions: β-glucuronidase as a sensitive and versatile gene fusion marker in plants. EMBO J 6:3901–3907 [DOI] [PMC free article] [PubMed]
- Lemaux PG, Cho M-J, Louwerse J, Williams R, Wan Y (1996) Bombardment-mediated transformation methods for barley. Bio-Rad US/E.G. Bull 2007:1–6
- Lemaux PG, Cho M-J, Zhang S, Bregitzer P (1999) Transgenic cereals: Hordeum vulgare (barley). In: Vasil IK (ed) Molecular improvement of cereal crops. Kluwer, Dordrecht, pp 255–316
- Liu Y, Wang H, Ye H-C, Li G-F (2005) Advances in the Plant Isoprenoid Biosynthesis Pathway and its Metabolic Engineering. J Integr Plant Biol 47:769–782 [DOI]
- Melander M, Kamnert I, Happstadius I, Liljeroth E, Bryngelsson T (2006) Stability of transgene integration and expression in subsequent generations of doubled haploid oilseed rape transformed with chitinase and β-1, 3-glucanase genes in a double-gene construct. Plant Cell Rep 25:942–952 [DOI] [PubMed]
- Meng L, Bregitzer P, Zhang S, Lemaux PG (2003) Methylation of the exon/intron region in the Ubi1 promoter complex correlates with transgene silencing in barley. Plant Mol Biol 53:327–340 [DOI] [PubMed]
- Meng L, Ziv M, Lemaux PG (2006) Nature of stress and transgene locus influences transgene expression stability in barley. Plant Mol Biol 62:15–28 [DOI] [PubMed]
- Paine JA, Shipton CA, Chaggar S, Howells RM, Kennedy MJ, Vernon G, Wright SY, Hinchliffe E, Adams JL, Silverstone AL, Drake R (2005) Improving the nutritional value of Golden Rice through increased pro-vitamin A content. Nat Biotechnol 23:482–487 [DOI] [PubMed]
- Pedersen C, Zimny J, Becker D, Jähne-Gärtner A, Lörz H (1997) Localization of introduced genes on the chromosomes of transgenic barley, wheat and triticale by fluorescence in situ hybridization. Theor Appl Genet 94:749–757 [DOI]
- Salvo-Garrido H, Travella S, Schwarzacher T, Harwood WA, Snape JW (2001) An efficient method for the physical mapping of transgenes in barley using in situ hybridization. Genome 44:104–110 [DOI] [PubMed]
- Shen LY, Petolino JF (2006) Pigmented maize seed via tissue-specific expression of anthocyanin pathway gene transcription factors. Mol Breed 18:57–67 [DOI]
- Sørensen MB, Müller M, Skerrit J, Simpson D (1996) Hordein promoter methylation and transcriptional activity in wild type and mutant barley endosperm. Mol Gen Genet 250:750–760 [DOI] [PubMed]
- Stam M, Mol JNM, Kooter JM (1997) The silence of genes in transgenic plants. Ann Bot 79:3–12 [DOI]
- Svitashev S, Ananiev E, Pawlowski WP, Somers D (2000) Association of transgene integration sites with chromosome rearrangements in hexaploid oat. Theor Appl Genet 100:872–880 [DOI]
- Tobias DJ, Manoharan M, Pritsch C, Dahleen LS (2007) Co-bombardment, integration and expression of rice chitinase and thaumatin-like protein genes in barley (Hordeum vulgare cv. Conlon). Plant Cell Rep 26:631–639 [DOI] [PubMed]
- Vasil IK (2007) Molecular genetic improvement of cereals: transgenic wheat (Triticum aestivum L.). Plant Cell Rep 26:1133–1154 [DOI] [PubMed]


