Abstract
Efficient mixing is difficult to achieve in miniaturized devices due to the nature of low Reynolds number flow. Mixing can be intentionally induced, however, if conducting or nonconducting obstacles are embedded within the microchannel. In the case of conducting obstacles, vortices can be generated in the vicinity of the obstacle due to induced charge electro-osmosis (ICEO) which enhances mixing of different streams: the obstacle shape affects the induced zeta potential on the conducting surface, which in turn influences the flow profile near the obstacle. This study deals with optimization of the geometric shape of a conducting obstacle for the purpose of micromixing. The obstacle boundary is parametrically represented by nonuniform rational B-spline curves. The optimal obstacle shape, which maximizes the mixing for given operating conditions, is found using genetic algorithms. Various case studies at different operating conditions demonstrated that the near right triangle shape provides optimal mixing in the ICEO flow dominant regime, whereas rectangular shape is the optimal shape in diffusion dominant regime. The tradeoff between mixing and transport is examined for symmetric and nonsymmetric obstacle shapes.
INTRODUCTION
Lab on a chip (LOC) is the generic term for miniaturized devices capable of carrying out conventional analytical laboratory tests. Such devices offer significant benefits over traditional laboratory tests in terms of device size, sample∕reagent usage, and can provide much faster results for chemical and biochemical analyses. Because of these advantages, LOC devices are considered a promising option for the development of miniaturized devices for environmental and defense monitoring, chemical synthesis and biomedical applications.1, 2, 3, 4 Like their larger counterparts, however, LOC systems require integration of various subcomponents such as pumps, mixers, reactors, and dilution chambers. It is therefore not surprising that the study of fluid flow in miniaturized geometries—a field known as microfluidics—has become central to the development of LOC devices.5, 6, 7 For LOC devices, micromixers are often a vital component as mixing is required for fast analyses in many applications (e.g., biochemical analysis, complex enzyme reactions, etc.)
The most common nonmechanical means of driving fluid flow in microdevices is electro-osmosis. When a charged solid surface comes in contact with an electrolyte, an electric double layer (EDL) of ions is formed due to the interplay between electrical and diffusive forces. The flow of liquids containing dissolved ions under the influence of electrical body forces is known as electro-osmosis; it is a subject treated in depth in the electrokinetic transport literature.8 Electro-osmosis is often preferred over pressure-driven flows due to the ease of control and integration with microdevices. In the context of this paper, traditional electro-osmosis is referred as “fixed charge electro-osmosis”9 (FCEO), as the charges are fixed on the solid nonconducting wall∕surface and are independent of the applied electric field. When fluid transport is due to FCEO, the velocity profile is effectively plug flow in the thin EDL limit. Such low Reynolds number flows are, by nature, very difficult to mix and the predominant mechanism of equalizing concentration differences is often diffusion—a relatively slow form of mass transfer. If mixing were desired in such situations, external devices must be added. The mixers used in microdevices can be categorized into active or passive mixers. Active mixers utilize external energy—via pressure, electrokinetic disturbance, etc.—to induce transverse flows (which are a prerequisite for effective mixing). On the other hand, diffusion and chaotic advection are the dominant mixing mechanisms in passive mixers. An excellent review of various micromixer types and their comparison is provided by Nguyen and Wu.10 Another review which focuses on electrokinetic mixing techniques is due to Chang and Yang.11
The most basic type of passive micromixer is a T- or Y-mixer, with two different streams flowing adjacently in the same direction and mixing is due primarily to transverse diffusion. There are various modifications reported in the literature for enhancing mixing performance of such mixers. A sequential injection strategy followed by an expansion chamber is demonstrated by Coleman and Sinton.12 Biddiss et al.13 utilized patterned heterogeneous surface charge along the walls for efficient mixing. Some of the other reported methods include sequential grooved patterns on the channel base14 and instability mixing due to electrical conductivity gradients.15 Another mixing approach is to introduce obstacles within the flow channel. Chen and Cho16 employed nonconducting wavy surface as obstacles. Other obstacles made of conducting materials have also been utilized to enhance mixing performance; these include triangular hurdles17, 18 and semicircular protrusions.19
Conducting obstacle-based mixers are also known as induced charge electro-osmotic (ICEO) mixers, as the charges are induced on polarizable and electrically conducting surfaces by an externally applied electric field. Initially, the electric field lines intersect the conducting surface at right angles and induce surface charges on the conducting surface. When electrolyte solution is present, due to the nature of induced charges, a bipolar EDL is formed near the conducting surface. At steady state, the electric field lines are expelled from the EDL due to the screening charges contained within it; thus, the bulk profile is that of an insulator. The distribution of induced charges over the conducting surface at steady state is nonuniform and the net induced charge is equal to zero. The magnitude of induced charges is proportional to the applied field strength, which makes ICEO flow field nonlinear and due to its quadratic dependence on electric field, steady ICEO flows persist in dc and ac fields. Initially, this effect is studied by Gamayunov et al.20 and Murtsovkin21 when they conducted theoretical and experimental investigations of nonlinear flow field near the polarized particles in the presence of an electric field. Recently, such a phenomenon was studied with reference to microfluidic applications by various researchers. Gonzalez et al.22 studied this effect by applying ac field directly on the microelectrodes and the flow is termed as ac electro-osmosis. In an extensive review, Bazant and co-workers studied ICEO around a polarizable metal cylinder in ac and dc electric fields.9, 23, 24, 25 The effect of hydrodynamic and electrostatic forces on polarizable cylindrical particles adjacent to a wall is examined by Zhao and Bau.26 Wu and Li17, 18 proposed a numerical correction method to estimate the steady state induced zeta potential on the conducting surface and demonstrated the use of conducting triangles embedded within the microchannel for mixing and flow regulation. A similar study by Jain et al.19 proposed the use of semicircular conducting obstacles for enhancing mixing while solving the full Poisson–Nernst–Planck model. Both the correction method and Poisson–Nernst–Planck model are compared by Jain et al.19 and the modeling results are found to be comparable.
In this numerical study, we seek the optimal shape for a conducting obstacle which provides the best mixing performance. The organization of this article is as follows: The following section provides a brief description of the nonuniform rational B-spline (NURBS) curves. Next, the mathematical model and optimization approach used for this numerical study are described. In Sec. 4, the optimal obstacle shape is presented and compared with the other geometric shapes. Finally, the effect of obstacle shape on the tradeoff between flow rate and mixing performance is examined.
BASICS OF NURBS
NURBS curves are the generalization of both Bézier curves and B-splines. It is a piecewise polynomial curve which evolves in a one-variable parametric space, with the parameter typically denoted by u. Any NURBS curve is defined by three components: (a) control points, (b) polynomial degree or curve order, and (c) knot vector. The knot vector divides the parametric space into intervals known as knot spans. A pth degree NURBS curves is defined as follows:
| (1a) |
 |
In the above equation, k is the number of control points Pi, wi are the corresponding weights, and {Ni,P(u)} are the pth degree B-spline basis functions defined on the nonuniform knot vector U. Here, nonuniformity refers to the unequal spacing of the knots ui within the knot vector. The number of knots in a knot vector (m) is always equal to the number of control points (k) plus the order of the curve, where curve order is defined as the polynomial degree (p) plus one.
From an optimization perspective, NURBS curves are an excellent option as it can represent a variety of shapes with the minimum number of parameters. Other very interesting property of NURBS is the control it offers in attaining the desired degree of smoothness and discontinuity. A NURBS curve can represent smooth surfaces, sharp corners, etc., depending on the values in the knot vector and control points. A number of same-value knots in the knot vector are referred as a knot with a certain multiplicity; this has implications on the continuity of the resulting curve and its higher derivative. The other properties of NURBS curves are local control, strong convex hull property, etc. Some of the NURBS properties are demonstrated with the help of various figures in the next paragraph. An extensive description of NURBS curves, their mathematical properties, and examples of application can be found in Piegl and Tiller.27
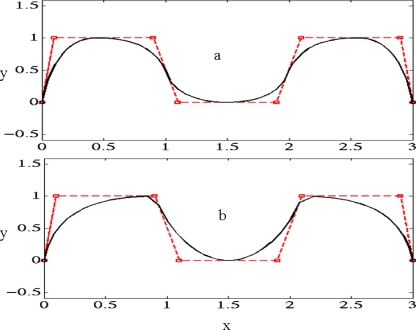
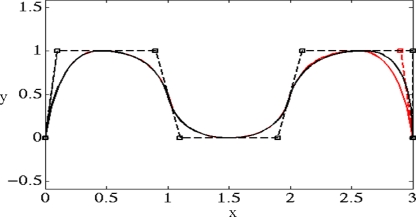
Consider a NURBS curve represented by quadratic polynomials with control points (marked as square) in Fig. 1a. The knot vector for Fig. 1a is given by {U=[0,0,0,0.2,0.4,0.5,0.6,0.8,1,1,1]}. The NURBS curve in Fig. 1a is smooth, however, if we introduce knot multiplicity in the knot vector as follows: {U=[0,0,0,0.2,0.2,0.5,0.8,0.8,1,1,1]}, the resulting curve is shown in Fig. 1b. The sharp corners are visible near third and sixth control points in Fig. 1b. It should be noted, however, that knot multiplicity does not always cause discontinuities in the curve.27 Another property of local control of NURBS curve is demonstrated in Fig. 2. The control point P7 is moved from (2.9,1) to (3,1) and the resulting NURBS curve is modified locally only as opposed to a Bézier curve where the change in control point leads to a change in the entire curve. This local modification property is also important for shape optimization and it can be used to fine tune the shape locally without changing the shape in a global way. Another approach to fine tune a NURBS curve is to alter the weights associated with the control points.
Figure 1.
Effect of knot multiplicity on NURBS curve (a) smooth curve and (b) nonsmooth curve with sharp corners around P3 and P6 control points.
Figure 2.
Local control property for a NURBS curve demonstrated as local modification is observed when control point P7 is moved from (2.9,1) to (3,1).
OPTIMIZATION APPROACH AND MATHEMATICAL MODEL
The steady ICEO flow problem can be solved using two approaches: (1) The Poisson–Nernst–Planck model and (2) correction potential method–slip velocity model. The Poisson–Nernst–Planck model resolves the EDL and solves for electrolyte ion concentration distributions. This approach is used by Zhao and Bau26 and Jain et al.19 for modeling steady ICEO flow. The correction method, proposed by Wu and Li,17, 18 is a numerical approach for estimating the induced zeta potential on a conducting surface and further utilizes it to estimate the slip velocity at a conducting surface (adopting the Smoluchowski limit for thin EDL). Although the Poisson–Nernst–Planck model can be used for both thin and thick EDLs and accounts for surface conduction, it is very much computationally intensive as compared to the correction method. Since optimization problem requires repeated solutions of ICEO flow problem, the correction method proposed by Wu and Li17 is used in this study. When compared to PNP model, correction method provides equivalent results for smaller field strengths∕induced zeta potential values.19 For higher field strengths∕induced zeta potential values, the disagreement between the two modeling approaches increases with increasing field strength. Recently, Wu and Li18 reported a reasonable agreement between experimental data and numerical modeling results based on the correction potential modeling approach.
The problem domain can be reduced from a 3D problem to a 2D problem using the assumption of homogeneous nonconducting top and bottom channel walls.17, 18 The top view of the ICEO mixer design is shown in Fig. 3. The design consists of a pair of conducting obstacles embedded on opposite sides of the channel wall. The shape of the conducting surface is represented by the NURBS curve and it can take on any arbitrary shape within the envelope (shown by dashed lines in Fig. 3). The end points of the NURBS curve are fixed, whereas the coordinates of other control points, their weights, and knot vector values are chosen as parameters to be optimized. The details of the optimization methodology will be discussed later in this section.
Figure 3.
Top view of the proposed conducting obstacle micromixer design. W: channel width; L: channel length; CS: conducting surface (NURBS curve); BE: bounding envelope for NURBS; NCS: nonconducting surface.
The conducting surface is assumed to be uncharged and highly polarizable, so that Faradaic reactions (i.e., electrochemical reactions at the metal-electrolyte interface where electrons are transferred between the two phases by reduction or oxidation of ions in the electrolyte) at the interface are negligible. Also, the solution is assumed to be an incompressible, Newtonian fluid with fixed dielectric constant εr, viscosity μ, and density ρ. The channel walls are negatively charged, and the metal surface will acquire surface charges as an electric field is applied in the x direction. Unless otherwise specified, all default parameter values used in the simulation are summarized in Table 1.
Table 1.
Simulation parameters (default values).
| Parameter | Value | Description |
|---|---|---|
| W | 100 μm | Width of the microchannel |
| L | 1 mm | Length of microchannel |
| Dt | 5×10⁻¹¹ m2∕s | Diffusivity of species to be mixed |
| ςf | −50 mV | Fixed zeta potential on nonconducting wall |
| E, i.e. (V0∕L) | 100 V∕cm | Applied electric field |
To describe the mathematical model, we introduce the following reference quantities and dimensionless variables:
and
Here Kb, T, and ε0 represent Boltzmann constant, absolute temperature, and permittivity of free space, whereas z is the valence of the electrolyte ions and e is the elementary charge. Othernotations∕symbols, along with their values, used above are described in Table 1.
Assuming thin EDL, the electric potential distribution at steady state can be described using the Laplace equation with the assumption of uniform bulk conductivity. In nondimensional form, the Laplace equation is
| (1b) |
In the above equation, is the scaled gradient operator and is the scaled electrical potential. At the channel inlet, a constant potential V0 relative to the outlet potential is applied, giving rise to a steady electric field E in the x direction and at the channel as well as the obstacle surface, normal component of electric field is specified as zero, i.e., n⋅∇ψ=0.
The flow field in the computational domain is governed by the continuity and Navier–Stokes equations. These equations, in their dimensionless forms, are
| (2a) |
| (2b) |
In the above equations, Re is the Reynolds number (ratio of inertial to viscous forces) and can be written as
| (3) |
It should be noted that the electrical force term in the Navier–Stokes equation is accounted by the slip velocity boundary condition as given by the Hemholtz–Smoluchowski’s equation,
| (4) |
In the above equation, ςf is the fixed zeta potential on the non-conducting surface, whereas ςi is the induced zeta potential on the conducting surface; the magnitude of ςi is dependent on the applied electric field as well as on the obstacle shape. The steady state induced zeta potential is estimated using the correction method17, 18 which is briefly described hereafter. At steady state, induced field on the conducting surface should be equal in magnitude and opposite in direction to the externally applied field, i.e.,
| (5) |
Upon integration the above equation yields the following relation:
| (6) |
Here ψc is the constant correction potential, which can be estimated using charge conservation on the conducting surface. Also the surface charge density qs is linearly related to the small values of zeta potential as qs=ςε0εmκ, where κ is the inverse of Debye length. Using the above relation, charge conservation equation for the conducting surface can be written as follows:
| (7) |
Using Eqs. 6, 7, we can obtain the following relation for correction potential ψc:
| (8) |
In the above equation, A represents the surface area of the conducting obstacle.
The steady transport of species is governed by the convection-diffusion equation and can be written in dimensionless form as
| (9) |
The Peclet number Pe is defined as
| (10) |
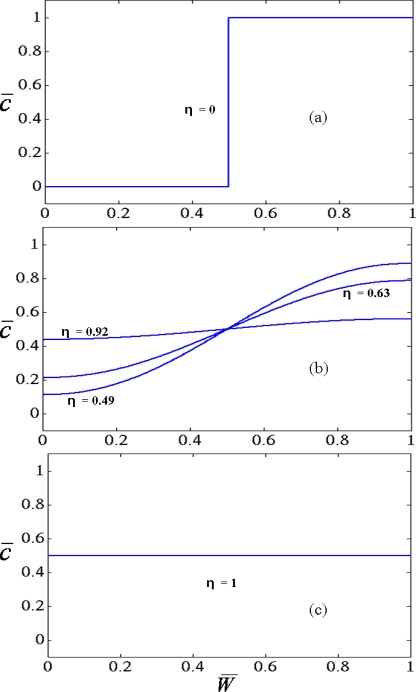
The above model is solved using the direct (UMFPACK) solver available within the commercial finite element method package, COMSOL 3.3. For fluid flow, zero pressure conditions are imposed at the inlet and outlet, while Smoluchowski’s slip condition is imposed at fluid-solid boundaries. For calculation of slip velocity, fixed zeta potential ςf is imposed on the nonconducting channel walls, whereas induced zeta potential ςi is calculated using Eqs. 6, 8. For species transport, a step input condition [as shown in Fig. 4a] is imposed at the channel inlet, using a smoothed Heaviside function, while convective-flux only boundary condition is applied at the channel outlet. At the conducting and nonconducting surfaces, zero flux condition is imposed for the species.
Figure 4.
Concentration profiles for various η values, (a) η=0 corresponds to perfectly unmixed state; (b) intermediate states and (c) η=1 corresponds to perfectly mixed state.
Mixing performance is quantified using the following mixing index; it is usually calculated based on the concentration profile at any particular cross section, as done by Coleman and Sinton,12
| (11) |
In the above equation, N is the number of points in the cross section used for estimation of the mixing index. The variable represents the scaled concentration value at that point, while and are the scaled concentrations at each point if the solutions are unmixed and the concentration with perfect mixing (i.e., 0.5), respectively. Also, it should be noted that the variable takes on a value of 0 or 1 at any point across the channel width, resulting in a constant denominator value of 0.5 in Eq. 9. The second term in the mixing index represents deviation from the desired concentration values. The cross-sectional plot in Fig. 4a shows the concentration profile at the channel inlet, where is the scaled width. With such distribution across the channel width, clearly the concentration at any point is not at the desired value of 0.5, resulting into η=0. The intermediate values of η are shown with corresponding concentration profiles in Fig. 4b. On the other hand, a value of η=1 represents perfect mixing, where the concentration is 0.5 everywhere across the channel width as shown in Fig. 4c. Based on the mixing index definition [Eq. 11], the theoretical limits for η is between 0 and 1. Optimal obstacle shape refers to the shape which provides maximum mixing, i.e., the highest value of η for given conditions. The optimization problem is formulated in terms of NURBS parameters (control point coordinate, weights, and knot vector values) so as to minimize the following fitness function (also known as objective function),
| (12) |
As the maximum value η can take on is unity, the fitness function is always greater than or equal to zero. Genetic algorithm (GA) is used to arrive at the optimal parameter values. The modeling of ICEO mixer is done using COMSOL 3.3 while the optimization is performed using the GA Toolbox from MATLAB. The numerical analysis is repeated with various mesh sizes to ensure mesh independency of the obtained results. In particular, fine meshes are used near the obstacle surface, channel walls, and channel centerline for obtaining accurate results near the interface.
RESULTS AND DISCUSSION
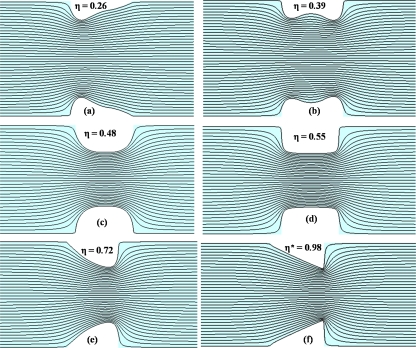
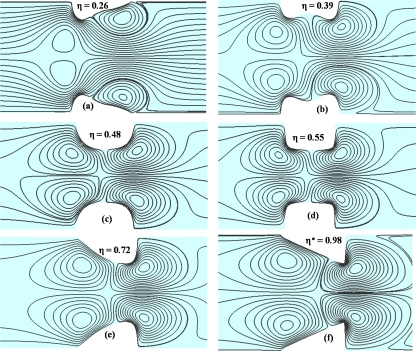
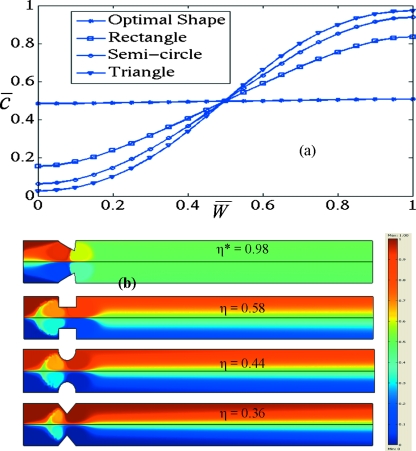
The fitness function [Eq. 12] is minimized to obtain the optimal obstacle shape for the given conditions ςf=−50 mV, D=5×10⁻¹¹ m2∕s, and E0=100 V∕cm. At these operating conditions, rectangular and semicircular conducting hurdle yields mixing indices of 0.58 and 0.44, respectively. The optimal shape is found to be an approximate right angle triangle, as shown in Figs. 5f, 6f. The mixing index with this optimal shape is 0.98 under the same operating conditions. Various shapes that the GA routine has evaluated at different iterative steps are shown in Figs. 56 with their corresponding mixing index. The diversity of shapes in Fig. 6 demonstrates the efficacy of GA to search the parametric space and provide a global solution to the optimization problem. The electric field lines and fluid streamlines are plotted for various obstacle shapes in Figs. 56, respectively.
Figure 5.
Electric field lines near the obstacle surface for various shapes evaluated by GA along with their mixing index.
Figure 6.
Fluid streamlines near the obstacle surface for various shapes evaluated by GA along with their mixing index.
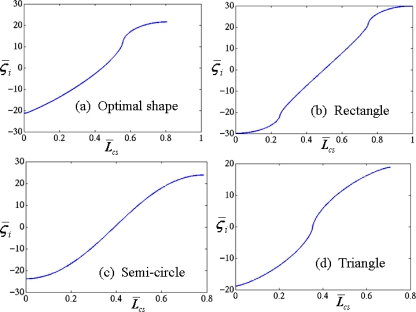
To further examine mixing performance, the cross-sectional concentration profile at the exit is plotted for various shapes and is shown in Fig. 7a. It is evident that under the same conditions, mixing performance of the optimal shape is much higher compared to the rectangular, semicircular, and triangular shapes. The corresponding surface concentration plots are presented in Fig. 7b. Further, the scaled induced zeta potential [for shapes in Fig. 7b] is plotted in Fig. 8 at externally applied electric field strength of 100 V∕cm, where Lcs denotes the length of conducting surface. For the given field strength, the maximum induced zeta potential is observed for the rectangular shape.
Figure 7.
(a) Cross-sectional concentration profile at exit; (b) concentration surface plot for various obstacle shapes.
Figure 8.
Scaled induced zeta potential for different obstacle shapes; note the (a) nonsymmetric distribution for near right triangle (optimal) shape and [(b)–(d)] symmetric distribution for other shapes.
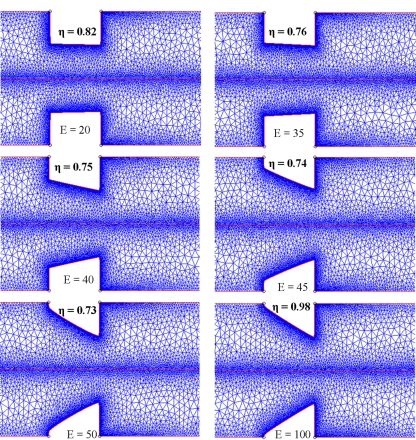
After analyzing one set of operating conditions, the methodology is repeated for various operating conditions and results are presented in Fig. 9 and Table 2. At low electric fields (in the diffusive mixing regime), rectangular shape provides best mixing, whereas right triangle shape is the optimal shape for ICEO dominant mixing regime and the evolution of optimal shapes in the intermediate regime is shown in Fig. 9. The optimality of rectangle shape in the diffusive regime is further validated by the qualitative analysis presented later in the article (Fig. 13 and related discussion). Further, various conditions are explored in the ICEO dominant regime and the optimal shape is found to be the near right triangle. The mixing at these operating conditions is primarily due to the convective effects originated from ICEO flows and diffusion is not significant as compared to transverse convection as evident from cases 3 and 4 in Table 2.
Figure 9.
Evolution of optimal shapes from rectangular shape at low electric fields (diffusive regime) to right triangle shape at high electric fields (ICEO dominant regime). The optimal shapes in the intermediate regime are shown for electric field between 35 and 50 V∕cm. (Unit for electric field is V∕cm.)
Table 2.
Various operating conditions in ICEO dominant regime.
| Case | Dt (m2∕s) | E0 (V∕cm) | ςf (mV) | η | Optimal shape |
|---|---|---|---|---|---|
| 1 | 5×10⁻¹¹ | 100 | −50 | 0.98 | Near right triangle |
| 2 | 5×10⁻¹¹ | 100 | −75 | 0.67 | Near right triangle |
| 3 | 1×10⁻¹¹ | 100 | −50 | 0.97 | Near right triangle |
| 4 | 1×10⁻¹⁰ | 100 | −50 | 0.99 | Near right triangle |
| 5 | 5×10⁻¹¹ | 75 | −50 | 0.84 | Near right triangle |
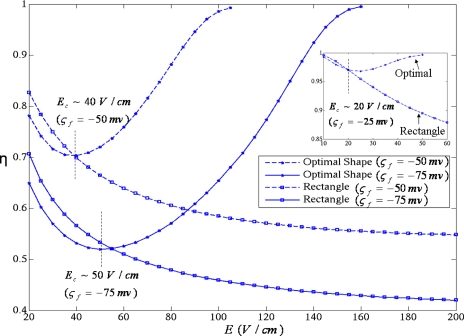
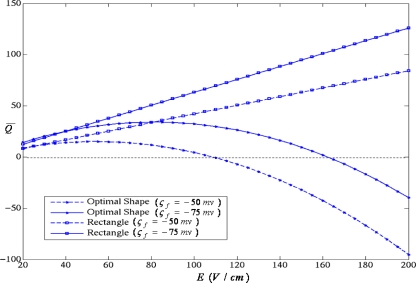
Next we analyze the mixing index performance (Fig. 10) with respect to the applied electric field for “near right triangle,” and rectangular shape. For higher electric field strengths, where ICEO flow dominates, the near right triangle is yielding superior mixing performance. The mixing performance for optimal shape decreases initially until a critical field Ec (Fig. 10) is reached, where ICEO flows start to become dominant as compared to diffusion, and further mixing increases with electric field. On the other hand, rectangular hurdle provides best mixing for low electric fields, i.e., in the diffusion dominant regime. The flow rate behavior for both obstacle types is shown in Fig. 11, where scaled flow rate is plotted against electric field. The flow rate, for rectangular shape, varies linearly with electric field, whereas for near right triangle shape quadratic dependence on electric field is observed for higher electric fields which point toward the ICEO flow dominance. The tradeoff between mixing and flow rate is apparent from Figs. 1011 , which is also reported by Tian et al.28 for heterogeneous microchannels with nonuniform surface potentials.
Figure 10.
Mixing index behavior with respect to electric field for ςf=−50 mV and ςf=−75 mV. Mixing index decreases monotonically for rectangular shape, whereas mixing performance increases after critical field strength Ec for near right triangle (optimal) shape. (Inset plot data corresponds to ςf=−25 mV.)
Figure 11.
Flow rate dependence on electric field for ςf=−50 mV and ςf=−75 mV. Linear dependence is observed for rectangular (symmetric) shape, whereas nonlinear (quadratic) dependence is observed for optimal (nonsymmetric) shape at higher electric fields with change in the flow direction.
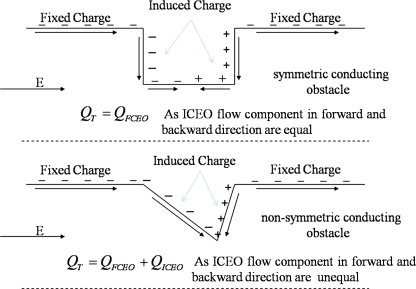
The flow behavior for both designs is explained through a schematic (Fig. 12). The total flow rate QT can be written as a sum of flow rates due to FCEO (QFCEO) and ICEO (QICEO). Due to the nonuniform induced zeta potential, the ICEO flow QICEO has two components; ICEO flow in the forward direction (QICEO)f and ICEO flow in the backward direction (QICEO)b. For any symmetric conducting obstacle design (rectangular, semicircular, symmetric triangular), due to symmetric induced zeta potential distribution [Figs. 8b, 8c, 8d], (QICEO)f component balances out the (QICEO)b component and QT is solely dependent on QFCEO (Fig. 12). However, with nonsymmetric designs (near right triangle), the total flow rate QT is a function of QFCEO and QICEO (Fig. 12). For higher electric fields, when ICEO flows are dominant in comparison to FCEO flows, the direction of flow can be reversed using nonsymmetric obstacles,17 also seen in Fig. 11 for near right triangle shape. Various case studies (Table 1) and Fig. 9 suggest that near right triangle shape is the optimal shape for ICEO dominant flow regime. The optimal shape induces transverse convection as well as significantly reduces the overall axial flow rate due to nonsymmetric shape. With significant ICEO generated backflow (overall reduced axial flow), the species retention time increases within the channel, which causes better mixing.
Figure 12.
Schematic showing dependence of total flow rate on the ICEO flow component
While rigorous numerical optimization is employed for obtaining optimal shape for ICEO flow dominant regime, for diffusive mixing regime, optimal shape can be found out using a simple qualitative analysis, presented below.
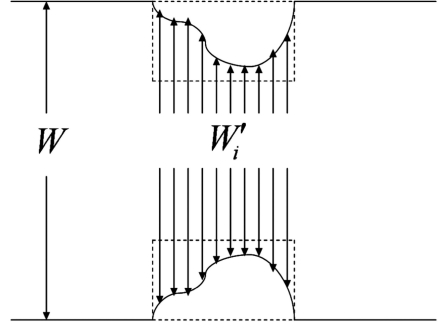
Consider an arbitrary shaped obstacle within the bounding envelope, as shown in Fig. 13. At low electric fields, mixing is only due to transverse diffusion which in turn is dependent on the effective channel width . Therefore, the optimal shape, in diffusive mixing regime, is the one which minimizes the effective channel width over the entire obstacle length. It is evident from Fig. 13 that rectangular obstacle satisfies the above condition and hence it is the optimal shape for diffusion dominant regime, which is observed in Fig. 9 as well as reported in a previous study.18
Figure 13.
Schematic for understanding mixing in diffusion dominant regime.
CONCLUSIONS
NURBS-based shape optimization is performed for maximizing mixing performance of obstacle-based ICEO mixer. It is found that rectangular shaped obstacle provides optimal mixing in the diffusion dominant region, i.e., for low electric field strengths. Upon further increase in electric field, ICEO flow becomes dominant and induces transverse convection within the microchannel. In the ICEO flow dominant regime (at higher electric fields), the optimal shape for conducting obstacle is found to be an approximate right angle triangle. The optimal design not only generates strong local flow vortices but also, due to nonsymmetric shape, stimulates maximum backflow compared to any other shape, thereby reducing overall axial flow rate which causes mixing enhancement. The tradeoff between mixing performance and transport rate is observed and the mixing and flow rate curves are analyzed for symmetric and nonsymmetric obstacles. The presented methodology can be utilized in optimizing performance in various LOC devices.
ACKNOWLEDGMENTS
The authors would like to thank both the reviewers, in particular, for their comment on the specificity of the solution, which helped us to better understand the problem and allowed us to present a general solution to the optimal shape problem for micromixing applications.
References
- Whitesides G. M., Nature (London) 442, 368 (2006). 10.1038/nature05058 [DOI] [PubMed] [Google Scholar]
- Chang H. C., Can. J. Chem. Eng. 84, 146 (2006). 10.1139/V05-242 [DOI] [Google Scholar]
- Dittrich P. S. and Manz A., Nat. Rev. Drug Discovery 5, 210 (2006). 10.1038/nrd1985 [DOI] [PubMed] [Google Scholar]
- Manz A. and Eijkel J. C. T., Pure Appl. Chem. 73, 1555 (2001). 10.1351/pac200173101555 [DOI] [Google Scholar]
- Stone H. A. and Kim S., AIChE J. 47, 1250 (2001). 10.1002/aic.690470602 [DOI] [Google Scholar]
- Stone H. A., Stroock A. D., and Ajdari A., Annu. Rev. Fluid Mech. 36, 381 (2004). 10.1146/annurev.fluid.36.050802.122124 [DOI] [Google Scholar]
- Squires T. M. and Quake S. R., Rev. Mod. Phys. 77, 977 (2005). 10.1103/RevModPhys.77.977 [DOI] [Google Scholar]
- Hunter R. J., Zeta Potential in Colloid Science: Principals and Applications (Academic, New York, 1981). [Google Scholar]
- Squires T. M. and Bazant M. Z., J. Fluid Mech. 509, 217 (2004). 10.1017/S0022112004009309 [DOI] [Google Scholar]
- Nguyen N. T. and Wu Z. G., J. Micromech. Microeng. 15, R1 (2005). 10.1088/0960-1317/15/2/R01 [DOI] [Google Scholar]
- Chang C. C. and Yang R. J., Microfluid. Nanofluid. 3, 501 (2007). 10.1007/s10404-007-0178-z [DOI] [Google Scholar]
- Coleman J. T. and Sinton D., Microfluid. Nanofluid. 1, 319 (2005). 10.1007/s10404-005-0034-y [DOI] [Google Scholar]
- Biddiss E., Erickson D., and Li D. Q., Anal. Chem. 76, 3208 (2004). 10.1021/ac035451r [DOI] [PubMed] [Google Scholar]
- Stroock A. D., Dertinger S. K., Whitesides G. M., and Ajdari A., Anal. Chem. 74, 5306 (2002). 10.1021/ac0257389 [DOI] [PubMed] [Google Scholar]
- Oddy M. H., Santiago J. G., and Mikkelsen J. C., Anal. Chem. 73, 5822 (2001). 10.1021/ac0155411 [DOI] [PubMed] [Google Scholar]
- Chen C. K. and Cho C. C., J. Colloid Interface Sci. 312, 470 (2007). 10.1016/j.jcis.2007.03.033 [DOI] [PubMed] [Google Scholar]
- Wu Z. M. and Li D. Q., Microfluid. Nanofluid. 5, 65 (2008). 10.1007/s10404-007-0227-7 [DOI] [Google Scholar]
- Wu Z. M. and Li D. Q., Electrochim. Acta 53, 5827 (2008). 10.1016/j.electacta.2008.03.039 [DOI] [Google Scholar]
- Jain M., Yeung A., and Nandakumar K., J. Microelectromech. Syst. 18, 376 (2009). 10.1109/JMEMS.2008.2010849 [DOI] [Google Scholar]
- Gamayunov N. I., Murtsovkin V. A., and Dukhin A. S., Colloid J. USSR 48, 197 (1986). [Google Scholar]
- Murtsovkin V. A., Colloid J. 58, 341 (1996). [Google Scholar]
- Gonzalez A., Ramos A., Green N. G., Castellanos A., and Morgan H., Phys. Rev. E 61, 4019 (2000). 10.1103/PhysRevE.61.4019 [DOI] [PubMed] [Google Scholar]
- Bazant M. Z. and Squires T. M., Phys. Rev. Lett. 92, 066101 (2004). 10.1103/PhysRevLett.92.066101 [DOI] [PubMed] [Google Scholar]
- Levitan J. A., Devasenathipathy S., Studer V., Ben Y. X., Thorsen T., Squires T. M., and Bazant M. Z., Colloids Surf., A 267, 122 (2005). 10.1016/j.colsurfa.2005.06.050 [DOI] [Google Scholar]
- Squires T. M. and Bazant M. Z., J. Fluid Mech. 560, 65 (2006). 10.1017/S0022112006000371 [DOI] [Google Scholar]
- Zhao H. and Bau H. H., Langmuir 23, 4053 (2007). 10.1021/la063224p [DOI] [PubMed] [Google Scholar]
- Piegl L. and Tiller W., The NURBS Book (Springer-Verlag, New York, 1997). [Google Scholar]
- Tian F. Z., Li B. M., and Kwok D. Y., Langmuir 21, 1126 (2005). 10.1021/la048203e [DOI] [PubMed] [Google Scholar]


