Abstract
Vertical hydrodynamic focusing in microfluidic devices is investigated through simulation and through direct experimental verification using a confocal microscope and a novel form of stroboscopic imaging. Optimization for microfluidic cytometry of biological cells is examined. By combining multiple crossing junctions, it is possible to confine cells to a single analytic layer of interest. Subtractive flows are investigated as a means to move the analysis layer vertically in the channel and to correct the flatness of this layer. The simulation software (ADINA and Coventor) is shown to accurately capture the complex dependencies of the layer interfaces, which vary strongly with channel geometry and relative flow rates.
INTRODUCTION
Flow-analytic instruments frequently use hydrodynamic focusing as a means to constrict lateral dimensions and generate a uniform velocity field to produce an analytic flow stream. In macroscopic flow, buffer fluid can be introduced in such a way that isotropic squeezing is relatively easy to achieve. Conversely, microfluidic systems, created by lithographic methods, are generally constrained as two-dimensional (X, Y) flow networks. One-dimensional squeezing, in the plane of the flow network, is relatively easy to accomplish simply by using T-junctions. Furthermore, such “horizontal” hydrodynamic focusing is useful in the design of microfluidics, e.g., analytic devices designed to exploit separated laminar flows.1, 2, 3, 4, 5, 6 However, “vertical” hydrodynamic focusing (in the plane perpendicular to the network) is needed for another class of instruments, particularly those that use narrow-depth-of-field optical detection. Fluorescent optical detection is perhaps the most important detection method for microfluidics and nearly all such detectors gain sensitivity with increasing numerical aperture (NA). For example, at the 0.5 NA characteristic of a 40× microscope objective the total depth of field (visible light) is on the order of 5 μm. Without a sheath fluid used in conjunction with focusing, a 5-μm-deep channel is generally too shallow to maintain free of contamination and clogging in many applications. We have found that even a 30-μm-deep channel (0.2-NA imaging) is difficult to maintain without sheath flow in a cell cytometry application. Hence, vertical hydrodynamic focusing is highly desirable for a wide class of fluorescence-based bioanalytic and chemical microfluidic devices.
In order to focus microfluidic flows vertically, it is necessary to utilize a torque (out of the plane of the network) or to merge flows as vertically distinct layers. We have chosen to explore the geometry in which layers are introduced by intersecting two vertically displaced channels. We prefer this approach as it requires only a simple unaligned (or weakly aligned) two-level network structure with no significant microfabrication changes from our normal unaligned procedure. From a modeling point of view the geometry is slightly complicated since the normal isotropic wet etching procedure produces a nearly hemispherical channel cross section and, as will be shown below, flow profiles are highly sensitive to relatively small changes in channel cross section.
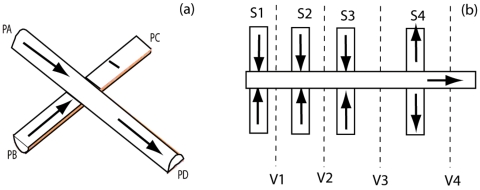
In this paper we explore the low-Reynolds-number, fully reversible, pressure-driven Stokes flow in the geometry of Fig. 1 through two computational fluid dynamics (CFD) simulation packages. Based on the resulting models, we have constructed simple three-level and four-level vertical focusing devices and tested their performance via three-dimensional (3D) optical imaging in a confocal microscope. The models show that the profile created by combining two flows in isotropically etched channels progresses nonlinearly as a function of the flow-rate ratio of the several fluid streams. That is, that the full effect of flow layering cannot be completely described by repeated additions of a single profile. An addition of 50% fluid B to A does not give the same result as two sequential 25% additions of fluid B to A. The flow profiles also show a nonlinear dependence on depth and width cross-section dimensions. Through comparison with experimental data, we show that the models are highly accurate in predicting flow profiles. Tilted planar profiles are produced at common channel dimensions and flow velocities. The tilt of these profiles can be tuned by adding and subtracting correction flows via the network design.
Figure 1.
(Left side) A simple crossing junction used as a design element in software and imaging calibrations; two inlet flows from PA and PB, single outlet flow from PD. No flow allowed through PC (wall boundary condition). The analysis channel is on top. The sheath channel is on bottom. Percentages of flow from PA and PB are in reference to PD, the total flow after the junction. (Right side) The four-level compensated vertical focusing device modeled in the text is illustrated. Additive sheath (symmetric sheath inputs S1 and S3) and additive analysis (symmetric S2) are combined upstream of a correction flow (symmetric S4). The device is driven by suction from a port at the right end. Adjustable flow resistances on the channels S1–S4 are used to tune the device. Planes chosen for cross-sectional viewing are on the order of ten channel dimensions downstream of the junctions and are indicated schematically as V1–V4.
EXPERIMENTAL
Geometries
In creating the models, the basic component was a crossing junction [Fig. 1a] where two hemispherical microfluidic channels, displaced by one channel height, were placed in contact perpendicular to one another. This simulates a junction in which two orthogonally patterned plates of glass are bonded together. At a minimum, three such junctions in series are typically used in a full vertical-focusing device. Each additional layer of fluid is introduced into the “analytic” flow via “sheath channels.” These sheath layers are sequentially combined in the central stream and are swept through the downstream imaging window. Figure 1b depicts the full four-level symmetric flow that we will model. In a four-level flow [or three-level, i.e., Fig. 1b absent S4 “subtractive” flow], the middle layer (S2) would contain cells or fluorophores and is the “analytic” layer of interest. The three independent fabrication variables tested were the mask linewidth (w, the width of the protoresist pattern), the channel etch depth (d), and the relative flow rate (v). The lateral channel dimension at the glass bonding surface is equal to w+2d.
Microfabrication
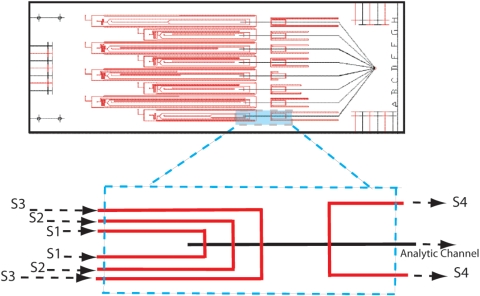
Test devices of various complexities were fabricated using contact photolithography and unaligned or weakly aligned glass fusion bonding. The simplest and most complicated geometries tested are those in Fig. 1. Figure 2 shows the actual mask-level channel structure for a weakly aligned device that we designed to simultaneously test eight different flow ratios for the four-level flow, i.e., for three symmetric “sources” followed by a symmetric “sink” [configuration of Fig. 1b]. The test die includes a total of eight variations on the flow ratios (Table 1). It, and simpler two- and three-junction devices were fabricated in aluminasilicate glass using photolithography, wet etching in HF, followed by laser drilling, and high-temperature fusion bonding. The microfabrication process is described in greater detail in Refs. 7, 8, 9.
Figure 2.
Plan view layout of the device designed to test vertical focusing and subtractive compensation. Eight variations of the 4-sheath configuration shown in Fig. 1b, labeled A–H (right side of die), are included on the single test die. The two layers of etched channels are indicated as red (top plate) and black (bottom plate), respectively. A single laser-drilled hole is provided for each input or output [S1–S4, Fig. 1b] and for a common suction port (common to configurations A–H, right side of die). The full die size is 3×7 cm. Target flow ratios, controlled through calculated flow resistance for the eight variations, are given in Table 1 (see text).
Table 1.
The table shows volumetric flow percentage for each sheath input relative to total analysis-channel exit flow prior to correction [normalization to 100% after combining sheaths S1–S3, Fig. 1b]. The designations “A–D” refer to the variations on the test device (Fig. 2). Volumetric flow ratio is adjusted on the device through designed-in flow resistance; hence the meander patterns seen in the photomask design (top of Fig. 2).
| Channel | Sheath 1 | Sheath 2 | Sheath 3 | Correction | Final |
|---|---|---|---|---|---|
| A | 33 | 33 | 33 | 17 | 40∕40∕20 |
| B | 11 | 11 | 78 | 25 | 15∕15∕70 |
| C | 25 | 25 | 50 | 30 | 36∕36∕29 |
| D | 15 | 15 | 70 | 50 | 30∕30∕40 |
| E | 20 | 20 | 60 | 25 | 27∕27∕47 |
| F | 10 | 30 | 60 | 25 | 40∕13∕47 |
| G | 30 | 10 | 60 | 25 | 40∕13∕47 |
| H | 20 | 10 | 70 | 17 | 27∕14∕59 |
Testing
We typically fabricated devices of 10- to 100-μm depth. To experimentally capture the path of the flow in the device, a solution of fluorescent beads, fluorescein dye, and water was flowed through the device while imaging it in a PerkinElmer UltraView spinning disk (PerkinElmer Life and Sciences Inc., Waltham, MA) or Zeiss Model 510 LSM confocal microscope (Carl Zeiss Microimaging, Thornwood, NY). The Zeiss LSM 510 confocal microscope with a 10× (NA 0.30) objective was used for most of the characterizations. Images were taken at 1024×1024 resolution (0.9 μm∕pixel) with Y slices of height 5.6 μm at intervals of 2.8 μm (coordinate system of microscope images). Three-dimensional quantitative images were measured using the Zeiss LSM Image Browser (Table 2).
Table 2.
Imaging conditions used with the test device shown in Fig. 2.
| Microscope | Zeiss LSM 510 laser scanning confocal |
| Resolution | 0.90 μm z-x, 5.6 μm, y |
| Filter sets | FITC (488∕515), Rhodamine (543∕570) |
| Chip lanes | Eight parallel lanes |
| Flow rates | 100,200,400μ L∕h∕(∼175,350,700 μm∕s) |
| Working fluid | 50% glycerin in water (dynamic viscositya—μ=6.00 cP, density—ρ=1.13×10³ kg∕m3) |
| Dye | 5 μM fluoresceine |
| Beads | 0.5% 1 μm polystyrene (emits strongly in red, 580 nm, and weakly in green, 520 nm) |
Reference 4.
Imaging was achieved with a 5-μM solution of fluorescein in all sheath layers and a 0.5% solution of 1-μm-diam fluorescent Rhodamine-dyed polystyrene beads in the analytic layer. A 50% glycerin and water solution was used as the working fluid to minimize buoyancy effects on the flowing beads. The best results were produced from a once-scanned 3D stack whose gain was minimized to show only the most intense beads. A single cross section did not give much flow profile information but a projected image along the axis of flow produced a very well defined hydrodynamic focusing profile. The flattened image was created as a postcollection summing of channel cross sections. These images were collected several channel diameters downstream of the junction where the flow in the imaging window was fully developed and the residence time of a bead was short enough to ignore diffusive dispersion effects [viewing planes are indicated schematically as V1–V4 in Fig. 1b]. We also made some measurements using a commercial density gradient compound containing iodixanol (Optiprep™, Axis-Shield Corp., Oslo, Norway), which, however, shows some evidence of non-Newtonian behavior. Using the spinning disk, full image slices were taken at 0.06 s∕slice and were sufficient to capture the motion of the flowing beads in a stroboscopic effect. These images were processed with Imaris (Bitplane AG, St. Paul, MN) and then compared to CFD simulations using particle traces and diffusion of two-fluid flow.
RESULTS
Simple crossing junction
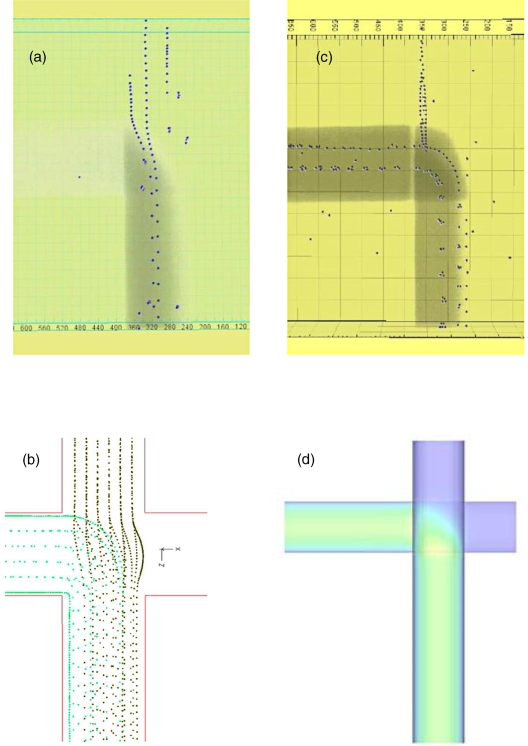
The validity of the CFD packages was first checked by fabricating a simple crossing junction [Fig. 1a] and simulating the same junction in two commercially available software packages, ADINA (Adina R&D, Inc., Watertown, MA) and CoventorWare 2006 (Coventor, Cary, NC). ADINA utilizes a finite-element∕finite-volume solver and CoventorWare utilizes a volume-of-fluid method. In both simulations, the fluid was assumed to be incompressible water at room temperature and analyzed for steady-state flow. Figure 3 shows a comparison of the bead stroboscopic measurements to the software models. The experimental data are gathered by sacrificing z resolution within the channel, but acquiring a full-frame microscope image at 6 frames∕s with the Perkin-Elmer spinning disk microscope. When the flow is seeded with a discrete number of fluorescent beads in the field of view, individual particles are tracked with an effective strobe interval of 167 ms between frames. The streamlines of the flow are visualized and velocity of individual beads can be inferred with, however, the z position imprecisely known for each particle. It is then possible to understand the trace-bead distribution in the z direction by using the vector-scan (Zeiss LSM 510) microscope with high z resolution and line scan-imaging transverse to the flow direction. A good agreement to the experiment, particularly in the location of the streamlines and qualitative velocity behavior, is found for both CFD packages. A relatively high sensitivity to dimensional changes, even within our (typically 10%) fabrication tolerances, is predicted by the models.
Figure 3.
Bead traces. (Left side) Simple crossing junction [Fig. 1a] with fluids entering from the top and left and combining to exit from the bottom. The progressive images of the fast confocal microscope create a strobelike effect so the individual beads can be tracked in position and time. (a) Imaris processed projection of confocal microscope images compared to (b) corresponding ADINA simulation. Channel parameters w=20 μm, d=60 μm (see text), 200 μL∕h exit flow. (Right side) (c) Bead traces of the same experiment as on the left side but taken at a different Z height to better capture the dye concentration gradient. Imaris processed projection of confocal microscope images. (d) Coventor simulation of corresponding fluid concentration. Channel dimensions w=20 μm, d=60 μm, 200 μL∕h exit flow.
Simulation of two-layer vertical focusing
Control case
As a first iteration, the two-layer system was modeled [i.e., Fig. 1b, with symmetric input (S1) and (S2) only]. The analysis channel was kept at a standard 40-μm linewidth (w) and 100-μm etch depth (d).
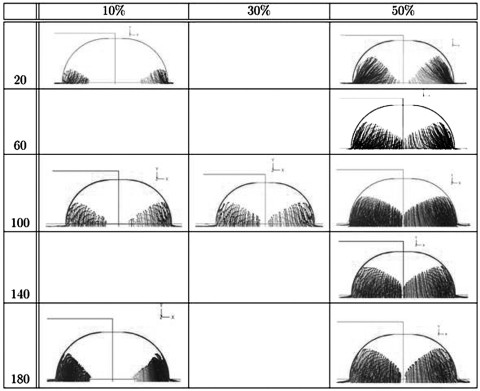
The control case was first defined as 50% analysis (S1) and 50% sheath fluid (S2), with sheath channels 40 μm∕100 μm (w∕d). This control case results in a large slope on the sheath layer interface. Reducing the sheath flow increases the slope of this interface at the center line of the channel; in fact the sheath fluid is totally excluded from the center line at sheath flows below 35% of the total analysis-channel flow (Fig. 4).
Figure 4.
Simulation for two-layer focusing, geometry of Fig. 1b observation at plane V2, and input flows (S1) and (S2). The channel depth (d) is held constant at 40 μm. The channel width (w) is varied on the vertical axis. The control case (w=100) is in the center of the figure. Cross-sectional view of the analysis channel shows profiles for increasing S2 sheath flow volumes of (a) 10%, (b) 30%, and (c) 50% of exit-port flow volume. The S2 layer moves inward from the bottom, but does not quite merge on the channel center line for flows up to ∼35% of the exit-port flow. Raw output of the simulations is shown; the shaded region is the space occupied by the sheath fluid, with no direct connection to particle trajectories or flow lines. The “slope” on the sheath-layer interface (referred to in the text) is the average inclination on the top boundary of the shaded layer. Rather than horizontal, the slope is characteristically 20°–40° off horizontal on average for most cases. This is just a shorthand metric for one nonideality of vertically layered flow.
If the channel dimensions are kept the same as the control case but the sheath flow rate is increased, the interface profiles flatten. In a similar manner, the relationship between the etch depth and layering profile was explored for varied channel dimensions. The most noticeable difference in the profiles is the change in the angle at the boundary between the fluids. For sheath-channel etch depths less than the analysis channel, the angle of the wedge formed by the sheath fluid is initially smaller than the control case, and as the percentage of sheath flow increases so does the boundary angle. As the etch depth for the sheath channel is increased the required sheath flow volume needed to exclude analysis fluid at the center line increases. For example, at a sheath channel depth of 180 μm, the sheath must comprise more than 65% of the total flow in order to exclude fluid from the center line. If the three-layer system is now modeled by adding an (S3) flow, a “gull-wing” profile develops in the cross-section profile for the analysis flow, as would be expected qualitatively by sequential addition of two-layer profiles.
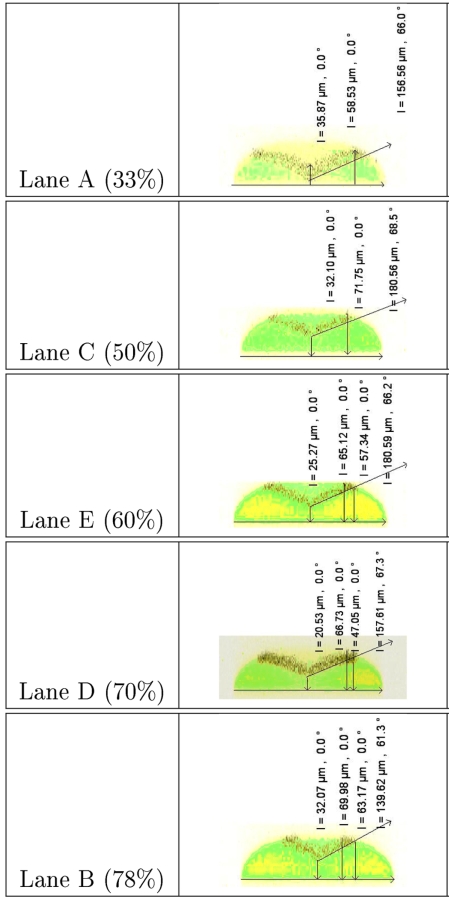
Further modeling with ADINA confirmed that a gull-wing profile is characteristic of all additive three-layer and four-layer flows in our geometry. Images (Fig. 5) showed an elevation of the gull-wing analysis layer in the channel as the S3 contribution is increased with little change in the (∼66°) angle of the gull wings until the sheath flow becomes quite high, e.g., to greater than 90% of the total flow. The Z location of the analysis layer can be varied by adjusting the rates of the three-layer flow.
Figure 5.
Confocal microscope images of the test device (configurations A–D, Fig. 2) taken after three additive junctions [S1–S3, at plane V3 Fig. 1b] and organized according to a relative contribution from the third junction (S3). The yellow∕green areas map the region of fluorescence from fluorescein dye doped into the buffer flows (yellow∕green colors reflect slight intensity differences). The dark layer includes nonfluorescent beads that displace the buffer and appear black. The middle analysis layer (black) takes on a gull-wing profile, sandwiched between two layers of sheath. The percentage of total analysis-channel flow contributed by S3 is indicated as a percentage in the right column of the figure. The black text in the image panels is produced in the image analysis software; black vectors are indicated in length (μm) and angle from vertical (degrees). As indicated, the slope on the analytic layer is typically 61°–68° from vertical (20°–30° off horizontal). Exit-port flow rate is 400 μL∕h.
Flow tuning through subtractive flow
We next explored flattening the analysis layer through downfield subtractive flows (S4). In our low-Reynolds-number Stokes’ regime, the steady-state flows are symmetric in forward and reversed directions. This was used to guide our choice of conditions on the subtractive flow.
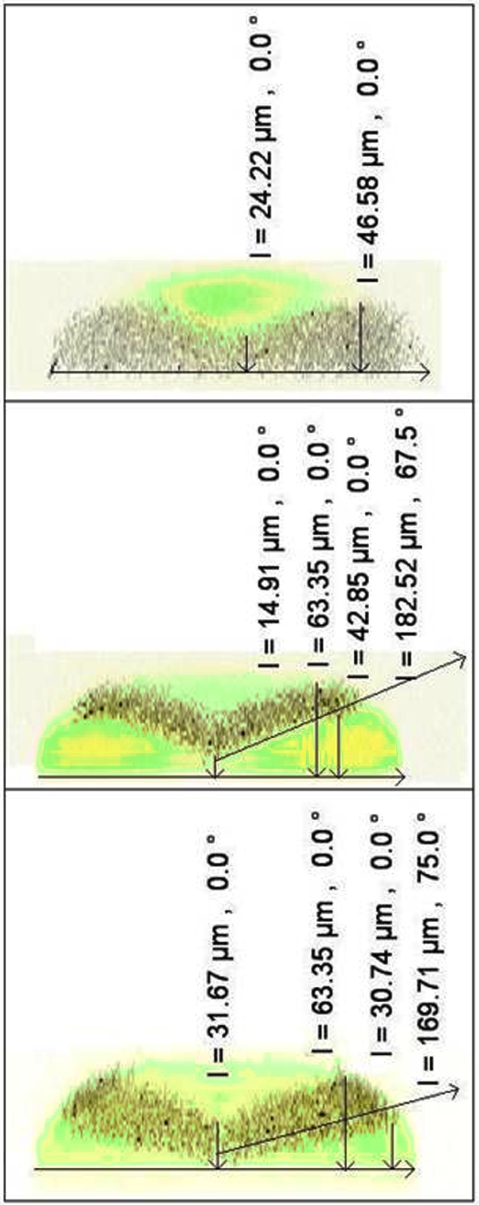
Both the model and images of the focused flow taken after the subtractive flow junction show that the correction flow (S4) works to flatten the boundary; however, a lateral stretching of the analysis layer tends to compensate and retain the overall vertical extent of this layer (Figs. 67). It was observed during the device testing that the leveling correction depended not only on the X position but also on the Y position (dimensions in the confocal microscope image). A refined CFD model was constructed based on the more exact (measured rather than design) channel dimensions [w=80 μm; d=70 μm (analysis) and 55 μm (sheath)]. The CFD models confirm that for two particles along the same horizontal line, the one closer to the edge of the channel will be translated more in the Y direction. Furthermore, for two particles along the same vertical line, the one closer to the bottom will translate more in the Y direction. In row H in Table 1, the precorrection sheath spanned 55 μm in the Y direction (the height from the channel bottom), and the postcorrection sheath spanned 56 μm (Y position 7 to 63 μm). Row A showed a reduction in the total vertical extent of the analysis layer of 10 μm due to correction. This is consistent with both the simulation data and confirmed the hypothesis of flow tuning and selective correction.
Figure 6.
Simulations of three-layer focused flow (a) before and (b) after the channel S4 junction and subtractive correction flow (plane V4). As the traces pass beyond the channel S4 junction they are preferentially pulled downward and outward. The flow interface on the bottom of the analysis layer (shaded layer) is most strongly altered by the subtractive flow.
Figure 7.
Measured flow profiles. Top-to-bottom; 2-port flow (S1∕S2), 3-port flow (S1∕S2∕S3), and full 4-port corrected flow (S1–S4). The correction flow S4 reduces the total vertical extent of the (black) analysis layer slightly and pulls this layer toward the bottom of the channel. The correction flow also stretches the analysis layer laterally to the channel walls. The channel dimensions are w=80 μm; d=70 μm (analysis) and 55 μm (sheath). Exit-port flow rate is 200 μL∕h. Measurements were made ∼250 μm downstream of the last contributing junction.
CONCLUSIONS
Vertical flow focusing is often required to optimally pair microfluidic sampling with narrow-depth-of-field optical detection. Flow focusing in this vertical axis can be challenging in the predominantly two-dimensional networks characteristic of microfluidic devices. Here we propose a design for vertical hydrodynamic focusing targeted at cell cytometers. Using ADINA and Conventor, we propose a symmetric 3-channel-additive, 1-channel-subtractive flow. A test device was used to generate data over a range of flow ratios for this configuration. These data confirmed the main features of the flow profiles predicted by the ADINA∕Coventor models. Furthermore, the predicted nonlinear dependence on flow rate and channel geometry was observed. The expected gull-wing analysis layer is generated in the test device in a symmetric 3-additive flow. For cell cytometers, the gull-wing profile will be convolved with normal Segre-Silberberg (particle-centering) effects10, 11 to force biological cells of finite diameter into the center of the channel. For this application the v shape is nearly ideal. Fine positioning of the analysis stream (most importantly the vertical location of the gull-wing v center), for combination with Segre-Silberberg effect, can be achieved by proper balances of buffer (S1∕S3) and analysis layer flow (S2), or with greater flexibility by utilizing the fourth (subtractive, S4) flow.
Since etch depth is constant for all the additive∕subtractive channels (S1–S4), our fabrication method restricts the range of flow ratios that we can achieve in our design. This, in turn, restricts the magnitude of the compression that we can achieve in a three-level pinched flow. We have explored the effects of changing channels widths at constant etch depth and find modest useful adjustment. Particularly for very small biological cells (microbes) or continuous analytes, it would be desirable to have much larger buffer-layer ratios (larger relative S1∕S3∕S4 components relative to S2). This might be possible by reconfiguring the device layers in our design in order to separate the S1∕S2∕S3 channels to a different layer of lithography than S2. However, without this change the design presented here appears very suitable for microfluidic cytometry on mammalian cells of about 10-μm-diam or larger dimension.9
ACKNOWLEDGMENTS
We thank Keiji Yano, James Evans, and Brian McKenna for many useful comments, and Korisha Ramdhanie for performing the microfabrication. This work was supported by the National Institutes of Health under Grant No. HG-01389.
References
- Simmonet C. and Groisman A., Appl. Phys. Lett. 10.1063/1.2046729 87, 114104 (2005). [DOI] [Google Scholar]
- Jahn A., Vreeland W. N., Gaitan M., and Locasio L. E., J. Am. Chem. Soc. 10.1021/ja0318030 126, 2674 (2004). [DOI] [PubMed] [Google Scholar]
- Stiles T., Fallon R., Vestad T., Oakey J., Marr D. W. M., Squier J., and Jimenez R., Microfluid. Nanofluid. 10.1007/s10404-005-0033-z 1, 280 (2005). [DOI] [Google Scholar]
- Holl M. R., Galambos P., Forster F. K., Brody J. P., Afromowitz M. A., and Yager P., Proc. ASME, DSC59, 323 (1996). [Google Scholar]
- Lee G. B., Lin C. H., and Chang S. C., J. Micromech. Microeng. 10.1088/0960-1317/15/3/004 15, 447 (2005). [DOI] [Google Scholar]
- Tu Wang E., Raymond D. E., Yang J. M., Hagen N., Dees B., Mercer E. M., Forster A. H., Kariv I., Marchand P. J., and Butler W. F., Nat. Biotechnol. 10.1038/nbt1050 23, 83 (2005). [DOI] [PubMed] [Google Scholar]
- Koutny L., Schmalzing D., Salas-Solano O., El-Difrawy S., Adourian A., Buonocore S., Abbey K., McEwan P., Matsudaira P., and Ehrlich D., Anal. Chem. 10.1021/ac9913614 72, 3388 (2000). [DOI] [PubMed] [Google Scholar]
- Gedecke N., McKenna B., El-Difrway S., Gismondi E., Swenson A., Carey L., Matsudaira P., and Ehrlich D. J., J. Chromatogr. A 10.1016/j.chroma.2005.05.100 1111, 206 (2006). [DOI] [PubMed] [Google Scholar]
- McKenna B. K., Salim H., Bringhurst F. R., and Ehrlich D. J., Lab Chip 10.1039/b811889b 9, 305 (2009). [DOI] [PubMed] [Google Scholar]
- Segre G. and Silberberg A., J. Fluid Mech. 10.1017/S0022112062001111 14, 136 (1962). [DOI] [Google Scholar]
- Yang B. H., Wang J., Joseph D. D., Hu H. H., Pan T. W., and Glowinski R., J. Fluid Mech. 10.1017/S0022112005005677 540, 109 (2005). [DOI] [Google Scholar]


