Abstract
The overall traffic of droplets in a network of microfluidic channels is strongly influenced by the liquid properties of the moving droplets. In particular, the effective hydrodynamic resistance of individual droplets plays a key role in their global behavior. Here we propose two simple and low-cost experimental methods for measuring this parameter by analyzing the dynamics of a regular sequence of droplets injected into an “asymmetric loop” network. The choice of a droplet taking either route through the loop is influenced by the presence of previous droplets that modulate the hydrodynamic resistance of the branches they are sitting in. We propose to extract the effective resistance of a droplet from easily observable time series, namely, from the choices the droplets make at junctions and from the interdroplet distances. This becomes possible when utilizing a recently proposed theoretical model based on a number of simplifying assumptions. Here we present several sets of measurements of the hydrodynamic resistance of droplets, expressed in terms of a “resistance length.” The aim is twofold: (1) to reveal its dependence on a number of parameters, such as the viscosity, the volume of droplets, their velocity as well as the spacing between them. At the same time (2), by using a standard measurement technique, we compare the limitations of the proposed methods. As an important result of this comparison, we obtain the range of validity of the simplifying assumptions made in the theoretical model.
INTRODUCTION
Droplets in microfluidic channels are widely used as microreactors for chemical analysis, for chemical kinetics studies, or, for example, as a tool for continuous nanoparticle synthesis.1, 2, 3, 4, 5 Propelled by the necessity to accommodate parallel processes and to sample or sort droplet populations, the demands for microfluidic networks to implement certain procedural targets keep on increasing. One strategy toward the parallel processing of many droplets are self-regulated channel networks in which it is not necessary to control the route of individual droplets by external means (valves) but in which a well-chosen channel design leads to an autonomous behavior of the droplet train.2, 6, 7, 8 The advantage of this approach is evident as the channel geometries stay simple, and less external devices are required. A drawback of the approach is an increased complexity in the understanding of the droplet dynamics, making it more difficult to find robust implementations of given tasks.9, 10, 11 General features of self-regulated droplet dynamics are the global coupling of the dynamics, meaning that nearly all droplets influence each other, and the strong nonlinearity in the equations describing the droplet positions as a function of time.
The nonlocal and nonlinear droplet dynamics has been described in Ref. 11 by a simplified theoretical model. In this model, each droplet, sitting in one connecting channel, increases the hydrodynamic resistance of this channel by a given constant amount. By its presence, it changes the flow rate in the channel and, in turn, it changes also the flow rates in possibly all other channels of the network. When a droplet arrives at a junction, a rule is required to decide which of the possible exits is to be taken. Here it will be assumed that it takes the channel with the highest instantaneous flow rate. The simplified model in Ref. 11 was able to address several intriguing properties of different network layouts, such as the reversibility of the droplet dynamics and the influence of network symmetry. The model was proposed as a simple tool for finding robust dynamical behavior and to quantify its response to changes in the driving parameters and the geometrical parameters of the network. While applying the model calculations to existing devices, it turned out that the most important parameter for robust behavior is the effective hydrodynamic resistance of droplets. Compared to its important role in the overall dynamics of droplets in a network, this property has not attracted sufficient interest, at least for droplets of a viscous fluid. As a first guess, it was therefore assumed to be a constant in the model.
In this paper, we present results from three methods for measuring the hydrodynamic resistance of droplets being transported in microchannels: a standard method that employs a pressure sensor as a reference and two new self-regulated low-cost methods that do not require laborious external equipment. These novel methods follow the idea of the abovementioned self-regulated networks. Here we propose to make use of the overall droplet dynamics, which is easily observable with a video device, in order to extract effective properties such as the hydrodynamic resistance. As we make use of self-regulating droplet dynamics, which requires a theoretical model for its interpretation, the target here is twofold: As long as the assumptions of the model from Ref. 11hold, the property extracted from the measurement is really the hydrodynamic resistance of the droplets. At the same time we verify these very assumptions by checking the consistency of the outcome and by directly measuring the hydrodynamic resistance of droplets with the standard pressure sensor.
The paper is organized as follows. First, in Sec. 2 we explain the principles of the methods, the specific advantages, and limitations of each of them: First, the well established method based on the use of an external pressure sensor, and then, the principle of the new methods relying on the flow of a regular train of droplets in a “loop” device. We distinguish between two different sizes of the loop, giving different weights to the underlying assumptions on which the interpretation is based. In Sec. 3 we describe the experimental procedure we used for creating the device. Section 4 contains the experimental findings of the two variants of the loop method and of the method using a pressure sensor. There, we discuss in detail the implication of the measurements, being in favor of the simple model or putting its assumptions into question.
PRINCIPLES OF THE METHODS
The pressure sensor method
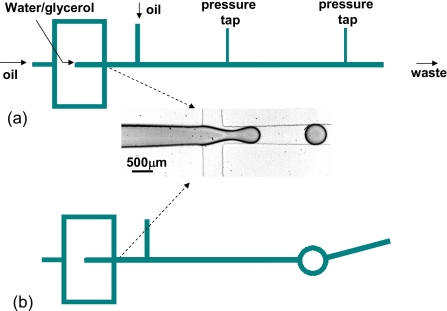
Experiments were conducted using a differential pressure sensor as described by Adzima and Velankar.12 At a distance of 127 mm, two pressure taps were connected to a long straight channel, as depicted in Fig. 1a. At each of them the pressure is measured by a pressure sensor (Validyne P55D), equipped with a 1.25 psi membrane. By comparing the pressure differences in two situations, namely, with and without droplets—while keeping the total flow rate Q the same—we infer the additional pressure caused by the presence of N droplets between the taps. The hydrodynamic resistance Rd of each droplet is then given by
| (1) |
where ΔP* and ΔP are the pressure differences between the taps, with and without droplets, respectively.12 In the discussion below, it will prove convenient to express hydrodynamic resistances in terms of lengths. This is natural for channels without droplets where the hydrodynamic resistance of channel i is known to scale linearly with its length Li,
| (2) |
with
| (3) |
Here, w and h are the channel width and height, respectively, ηΦ is the viscosity of the continuous phase, and the dimensionless parameter A depends on the shape of the channel cross section, which is rectangular here.13 We apply the same factor of linearity from Eq. 2 also to the effective resistances Rd of the droplets in order to define their resistance length Ld,
| (4) |
Figure 1.
Schematic pictures of the devices: (a) a straight channel with two pressure taps for the method using the pressure sensor and (b) an asymmetric circular loop. Droplets are generated where the first oil and water∕glycerol inlets meet. The third inlet allows one to adjust the distance between the droplets. Channels and inlets have a rectangular cross section, 500 μm wide and 300 μm high. Only the two channels to the pressure sensors are narrower (100 μm wide).
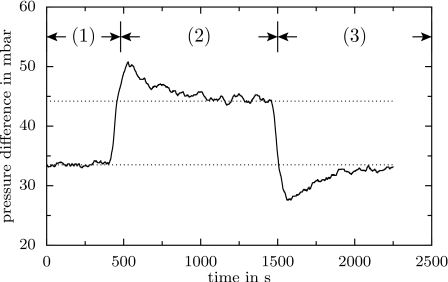
The pressure sensor is used below in Sec. 4 to compare the results of the alternative passive methods presented in the sections II.B.1 and II.B.2 below. It is important to note that this equipment is quite costly (several hundreds of dollars) and that it presents a number of limitations in terms of response time and ease of use. The smaller the probed channel, the larger is the equilibration time. In the case of our channels, which are quite large (300 μm high and 500 μm wide), this equilibration time was found to be of the order of 10 min. Figure 2 shows the pressure difference at the two taps as a function of time, exhibiting the slow relaxation of the signal at the beginning and at the end of a droplet series. The following passive methods allow to get rid of these constraints.
Figure 2.
Time series of the pressure difference along a straight channel, as measured with the pressure sensor. The droplet input has been changed subsequently. First (1) without droplets, then (2) with them, and (3) last without droplets. The total flow rate has been kept constant. The dotted lines are guides for the eyes. Flow rates of the oil and the water inlets in the droplet generator are 8 and 7 μl∕min, respectively. The second oil inlet allows to adjust the distance and the velocity of droplets, here 70 μl∕min. The parameters of the droplets are ηd=0.001 Pa s, Ωd=85 nl, vtot=7.5 mm∕s, and λ=6 mm.
The loop devices
Here we propose two variants of a new method that allows to extract the hydrodynamic resistance of droplets from the observed behavior of regular droplet trains. This approach has the advantage over the standard pressure sensor in that it is cheap and does not require taps which pose an additional source of perturbation of the flow. Furthermore, it can be applied without problems to very small channels, where the pressure sensor technique becomes inapplicable. Of course, our method has its limitations. The main limitations come from the hypotheses made in the theoretical model on which the interpretation of recorded droplet behavior is based. It will turn out in Sec. 4 that these assumptions are not always satisfied. Nevertheless, in those regions where they do hold, the new method presents a real alternative to the pressure sensor.
We use a very simple network of microfluidic channels, as depicted in Fig. 1b. Disregarding the part in which droplets are generated, it consists of two long channels with an asymmetric circular loop in between. A periodic sequence of droplets is generated and injected into this loop from one side. The droplets then take either the short or the long branch of the loop, depending on how many droplets the respective branches contain. For the first droplet, the shorter branch is certainly favorable. It has a higher flow rate and a smaller hydrodynamic resistance. The arriving first droplet then increases the hydrodynamic resistance of this shorter branch, possibly so much that the following droplet takes the longer route. Upon continuation, a complicated sequence of droplet “decisions” is generated, exhibiting complex periodicity. The same network topology has been used in Refs. 10, 11 to investigate the reversibility of the droplet dynamics. The droplet traffic in the network was recorded by a charge-coupled device (CCD) camera and processed with a homemade MATLAB program. As such, we extracted from the movies the velocities of all droplets, the number of droplets in each channel, and the temporal and spatial periods of the incoming droplet sequence. These properties were then plugged into the theoretical model in order to extract the hydrodynamic resistances, according to the two methods described in the following.
The flow through the devices is governed by flow equations that resemble Kirchhoff’s law for electric circuits. At each junction, the sum of incoming and outgoing flow rates must vanish. This means for the loop device
| (5) |
with Qtot as the total flow rate in the input∕output channels, and Qs and Qℓ as the flow rates in the short and long branches of the loop. Here and in the following, indices s and ℓ stand for the short and the long channels, respectively. The second set of equations provides the relationship between the pressure difference along a channel and the flow rate passing through it,
| (6) |
At the moment, this equation is nothing but the definition of the total hydrodynamic resistance Ri of channel i. Without any droplets, it is known to provide a linear relation, in that the resistance does not depend on the total flow rate.
Before describing the dynamics of droplets in the two geometries we used, let us summarize the assumptions which led to the simplified model and which will be investigated experimentally in section IV:
-
(A)All droplets in channel i have the same velocity vi. Its value is proportional to the total flow rate Qi in the channel (oil+water∕glycerol), with a constant factor of proportionality,
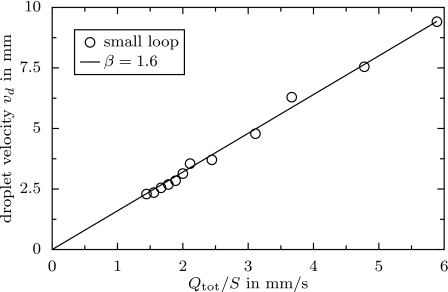
Here, S is the cross section, which does not change. β was found to be approximately 1.6 in our experiments.(7) -
(B)Each droplet adds the same amount Rd to the total resistance Ri of channel i such that
with ni the number of droplets in the channel, and with its resistance in the absence of droplets.(8) -
(C)
The resistance Rd of droplets should be a constant. In particular, Rd should not depend on the flow rate Qi (or on vi).
-
(D)
At junctions, droplets take the route with the highest flow rate leading away from the junction.
Some comments on the assumptions and their expected validity are in order at this point. The linearity of velocity and total flow rate (A) has been observed under experimental conditions, both in Fig. 5 and in Ref. 14. Assumption (B) will prove false if there is cooperative behavior between the droplets. Such effects will not occur as long as the droplets are sufficiently distant. We will quantify the necessary distance in the experimental section, around Fig. 10. Assumption (B) will also fail if the droplets have different sizes or if they are smaller than the channel and are thus not forced to be centered. Assumption (C) is nothing else than the linearity of Eq. 6. In fact, we will present deviations that are important for small velocities but not for larger ones. Also in the case of long pluglike droplets, a nonlinearity in Eq. 6 and, therefore, a velocity dependence of Rd must be expected. Such effects have been reported for bubbles.15, 16, 17, 18 By construction of our device, which is by virtue of its simple geometry, we do not require assumption (C) for the method to be valid. Finally, assumption (D) will not be questioned here. The precise criterion, whether it is the highest flow rate, the highest pressure drop, or the largest velocity that counts, does not seem to be important in our case as we use locally symmetric junctions and the same channel cross sections everywhere.
Figure 5.
Experimental test for the linear relationship between droplet velocity vi and the flow rate Qi [assumption (A)]. The data were acquired in a straight channel. The parameters are ηd=0.76 Pa s, ηΦ=0.02 Pa s, λ=1.7–2.8 mm, and Ωd=55 nl.
Figure 10.
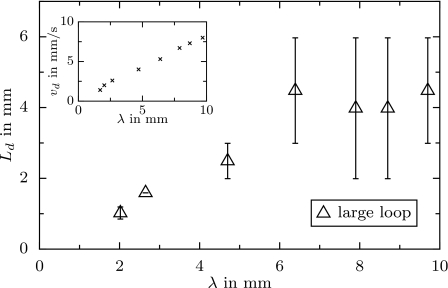
The resistance length Ld (large-loop method) as a function of the initial interdroplet distance λ. Inset: variation in the droplet velocity vtot with λ. The parameters are ηd=1.4 Pa s, ηΦ=0.02 Pa s, Ls=36 mm, Lℓ∕Ls=1.6, and Ωd=65 nl.
The small-loop device
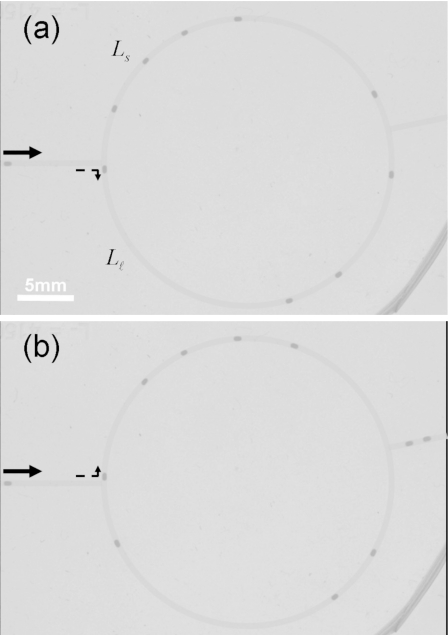
The first variant of the proposed device comprises a small loop, as shown in Fig. 3. The two branches of the loop are of the order of ten times longer than their width. The idea of the method is to send in a periodic sequence of droplets and to vary slowly their initial distance. If one starts with quite a large distance, the droplets will all take the short route and leave the loop before the next one arrives [see Fig. 3a]. For a continuously reduced initial distance λ, one finds a sudden change in the droplet behavior at a specific distance λmax. The droplets start to influence each other. The following droplet will take the long route because the previous one still enhances the resistance of the short branch. This situation is depicted in Fig. 3b. Of course, in order to make the method work, the (yet unknown) hydrodynamic resistance of a single droplet must be larger than the difference in resistances of the channels when no droplets populate them. The applicability can therefore be adjusted by choosing the length ratio Lℓ∕Ls. The hydrodynamic resistance of the droplet is determined from the value of the initial distance λmax, at which the droplets stop taking the entire short branch, by applying the simple Eq. 13 below, which we will derive now.
Figure 3.
Snapshots of the small-loop device fed by a regular sequence of droplets: (a) all droplets take the short route, the incoming distance is large, λ>λmax, (b) alternating droplet decisions due to interactions between droplets, λ<λmax. The arrows indicate the flow direction. Parameters are Ls=4.25 mm and Lℓ∕Ls=1.18.
The initial distance λmax is obtained as the distance which an approaching droplet can travel, while the previous one traverses the short branch. The time T which a droplet stays in the short branch is expressed as follows, when assumption (A) is used:
| (9) |
where Ls, vs, and Qs are the length, the velocity, and the flow rate in the short arm, respectively. In the same time span, another droplet in the incoming channel covers the length
| (10) |
which leads to the elimination of the parameters β and S, and which leaves us with
| (11) |
Now, we make use of assumption (B) together with Eq. 6. As the pressure difference is the same in both branches of the loop, we obtain for the ratio of their flow rates
| (12) |
Here, it proves convenient to express the hydrodynamic resistances in terms of lengths, as defined in Eq. 2. Combining the last two equations, we find the result already given in Ref. 11,
| (13) |
which can easily be resolved for Ld. Note that we did not make use of assumption (C) in this short derivation. Equation 13 therefore holds for any nonlinear relationship between Qs and the resistance Rd(Qs) of the droplet. It is the simple geometry of the device that allows to circumvent the simplifying assumption (C), which is not possible in extended networks. Note also the nice property of this formula that the hydrodynamic resistance length of the droplet is only given by geometrical properties, namely, the two lengths of the branches, and by the experimentally determined initial distance λmax between droplets. This means that once the device has been elaborated, the measure of the droplet resistance is simply obtained from observing the droplets taking different routes through the loop.
Note also that the determination of the droplet resistance from this device relies strongly on assumption (A) and only weakly on assumption (D). Assumption (C) is not used at all and assumption (B) is unimportant since we treat one droplet per channel (n=1) which is the trivial case for (B).
Here the limitation of the described small-loop method is that the two branches are quite short. A violation of the above derivation might occur, in that the resistance Rd depends on the instantaneous distances between droplet and the two junctions, both of which perturb the flow in a nontrivial manner, leading to an effective hydrodynamic interaction between them. In this aspect, the smaller the channel cross section is, the better the small-loop device works. This will lead to a more uniform flow and at the same time increase the resistance of droplets.
The large-loop device
We propose a second variant of the loop device which allows to determine the hydrodynamic resistance of droplets with a different weighting of the assumptions. This time, the loop is much larger compared to the previous geometry (see Fig. 4). Like for the small-loop device, a regular train of droplets is injected into the main channel. This time, there can be several to many droplets in each branch of the loop, and their resistance is determined by counting the droplets in each branch every time a new droplet has made its decision. Thus, the droplet dynamics depends on the model assumptions in a different way. According to assumption (D) each droplet entering the loop systematically goes into the branch of lower hydrodynamic resistance. Also, since each droplet adds a certain resistance to the channel [assumption (B)], it tends to equilibrate the hydrodynamic resistances of the two branches of the loop. The same principle has been previously used in the analysis of the hydrodynamic resistance of bubbles,19 however, only in the case of a symmetric loop and without the complementary device with a small loop.
Figure 4.
Snapshots of the large-loop device: (a) the arriving droplet chooses the long branch, corresponding to relation 14, here ; (b) the next arriving droplet takes the short route, . The dotted arrows indicate the direction chosen by the droplets. Parameters are Ls=37 mm and Lℓ∕Ls=1.16.
During the run of the experiment, the total hydrodynamic resistances of the two branches change as functions of the numbers of droplets they already contain. We thus have to track the relation between these two resistances,
| (14) |
where both comparison operators are found. Each time a droplet has chosen a route, we gain some information about which branch of the loop has had the smaller total resistance. In fact, each time a droplet chooses the longer branch, we obtain a lower bound for Rd; the short branch provides an upper bound. When resolving Eq. 14 for Rd, rewritten in terms of the corresponding length Ld, we obtain these bounds as
| (15) |
The subscripts “→long” and “→short” indicate that the specified bound applies only if the long∕short branch has been chosen. Observing many droplets will successively narrow the bounds on Ld, leaving finally an interval that depends on both the initial droplet spacing λ and on the length ratio Lℓ∕Ls. A large loop that is nearly symmetric leads to a good accuracy of the method. Figure 4 shows two examples of how Eq. 15 is applied, leading in Fig. 4a to a lower bound and in Fig. 4b to an upper bound.
In terms of the assumptions required for the analysis, this large-loop method appears to be complementary to the small-loop variant. Here we make heavy use of assumption (B) in that we assume the droplets to add up their individual resistances. On the contrary, the small-loop proposition was mainly based on assumption (A) which is not really required here because the time the droplets stay in both branches of the loop is not used. Also the role of the droplet velocity is different. While the flow rates in the two branches of the small-loop device can be very different, they are automatically balanced here—at least their average values, with fluctuations due to the fluctuating numbers of droplets.
EXPERIMENTAL DETAILS
We made the microfluidic devices out of poly(dimethyl siloxane) (PDMS) using standard photolithographic and soft-lithographic techniques.20, 21 A transparency mask of 20 000 dots∕in. resolution (CAD∕Art Services Inc., California) was used in 1:1 contact photolithography with SU-8 photoresist (MicroChem, Newton, MA) to generate a negative “master” consisting of patterned SU-8 photoresist on a silicon wafer with a flat surface. Positive replicas were formed by molding a 5:1 mixture of PDMS with a temperature-active cross-linker against the master. After curing the PDMS layer for 20 min at 65 °C, it was peeled off the silicon wafer, and inlet and outlet holes were punched. A glass slide, serving as the rigid substrate of the device, was covered by a thin layer of a 20:1 mixture of PDMS∕cross-linker and cured during 40 min at 65 °C. The PDMS surfaces were then activated with an UVO-cleaner (Jelight 144AX)22 for 40 s, and both PDMS surfaces were immediately brought together. An irreversible seal was formed between the PDMS surface and the glass substrate.
The resulting rectangular microchannels are 300 μm high and 500 μm wide. Droplets were fabricated from a droplet generator with a cross junction (Fig. 1). Inlets for different liquids, one of oil (viscosity of ηΦ=20 cP) and one for a glycerol∕water mixture, lead into a channel located downstream the junction. A colorant (Bromothymol blue) was added to this aqueous phase in order to increase the contrast of the droplet. External connections to syringes (Hamilton, 2.5–10 ml) were made using polyethylene (PE20) medical tubing (outer diameter: 1.09 mm). The syringes were contracted by three programable syringe pumps (Cetoni, Nemesys) controlled by a computer. An additional oil inlet further downstream served to vary the spatial period between droplets without modifying the volumes of the droplets. Their volumes were inferred from all three incoming flow rates and the measured droplet distance.
RESULTS AND DISCUSSION
In this section we present several sets of measurements in which different parameters are varied. We measure their influence on the hydrodynamic resistance of the droplets in order to see as to what extent assumptions (A)–(D) may be applied. The varied parameters are the volume Ωd of the droplets, their velocity, their viscosity ηd, and their initial distance λ. All these parameters influence the hydrodynamic resistance of droplets—which, strictly speaking, invalidates assumptions (B) and (C). Nevertheless, we will show that reliable results can be obtained with the newly proposed methods. Their reliability is enforced by the comparison with the results from the pressure sensor as a reference. The first two presented results coincide well and show that the proposed small-loop and large-loop devices can be used to determine the hydrodynamic resistance of droplets.
From the remaining results, we learn that the assumptions underlying these methods are not fulfilled for all driving parameters. At first sight, this appears as bad news for the methods we propose. However, we also find that there is always a parameter regime in which the assumptions are indeed valid. Concretely, we find that both the droplet velocity and the interdroplet distance must be kept sufficiently large. If we ensure that the velocity does not drop below a critical value, while varying, for example, the distance, the result is perfectly valid. We may use such a situation to extract the hydrodynamic resistance of the droplets. The results given in this section therefore present both a direct verification of the assumptions of the employed model and a measurement of the hydrodynamic resistance.
Validity of assumption (A)
Independent of the parameter variations, Fig. 5 shows that assumption (A) holds in the performed experiments.
Influence of the droplet volume
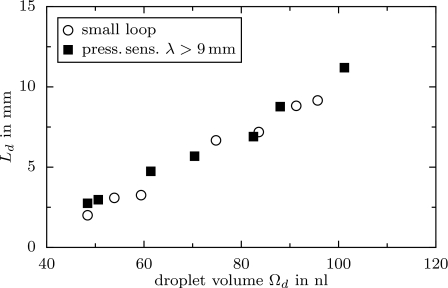
The influence of the volume of droplets on their hydrodynamic resistance has been investigated with the pressure sensor and with the small-loop device. The results in Fig. 6 depict a strong increase in the resistance with the volume, which is confirmed by the measurements of the pressure sensor. Both methods yield coinciding values for the resistance. The increase can be understood by the fact that with growing volume the droplets fill the channel more closely and become longer. Similar effects have been reported in Refs. 12, 14. Droplets of 48 nl are nearly spherical when looked at from above. Larger droplets are more elongated, giving rise to thin films of oil between the droplets and the channel walls.
Figure 6.
The resistance length Ld as a function of the droplet volume measured with the small-loop device and with the pressure sensor. The parameters are ηd=1.4 Pa s, ηΦ=0.02 Pa s, Ls=4.25 mm, Lℓ∕Ls=1.18, vtot≈6 mm∕s, and λ>9 mm.
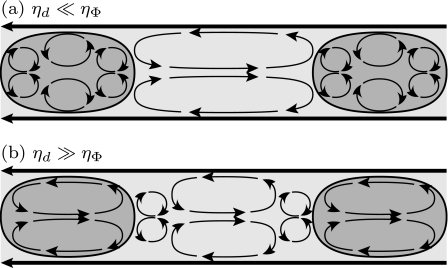
The viscous dissipation in these thin films is one of three possible reasons for the enhancement of hydrodynamic resistance due to the presence of a droplet. Generally speaking, each droplet perturbs the surrounding flow field, which would otherwise be an axial Poiseuille-type flow (see Fig. 7 and Ref. 23). The kinematic boundary condition at the boundary of the droplet enforces the presence of several counter-rotating eddies inside and outside the droplet. Figure 7 contains only those eddies that are necessary to ensure a continuous velocity field. In particular, the tangent velocity has to be continuous at the droplet boundary. Due to their different viscosities, the eddies inside and outside the droplet may contribute differently to the total hydrodynamic resistance of a droplet. A third contribution comes from the thin fluid film between droplet interface and channel wall. Its reduced thickness leads to large velocity gradients and thus also to viscous dissipation. As the droplet resistances at different volumes are compared, it is not only the thin-film contribution which changes. Together with the more elongated shape of the interfaces, also the precise shape of the interior eddies changes. The viscous dissipation within the droplet strongly depends on the details of the eddies, in particular on the ratio between the round backflows near the caps of the droplet and the rather “Poiseuille-like” parts in the interior of a long droplet. At this point, nothing can be said about the relative importance of the viscous dissipation in the thin film and in the eddies. We will return to this point below, in the discussion of the distance between droplets.
Figure 7.
The topology of the counter-rotating eddy pairs in front, behind, and within the droplets moving in a channel. The velocity streamlines are those seen from a frame comoving with the droplets. The channel walls move to the left. Depending on the viscosity ratio, between one and three eddy pairs can be found in the droplets. More eddies are possible, depending on the shape of the droplets, thus on the surface tension.
In the experiment in Fig. 6 the range of droplet volumes is limited, as large droplets tend to break or deform and wait in the incoming junction of the loop. The waiting time in the junction causes an overestimation of Ld by Eq. 13. Note that in the small-loop model of Sec. 2B1 the new route is chosen instantaneously and does not take any waiting time into account. There is also a lower bound for the applicable droplet volume, given by the channel cross section. As soon as the droplets have no contact with the channel walls, their resistance strongly decreases. However, we require their resistance to be large enough to overgrow the asymmetry of the loop.
Influence of the total flow rate
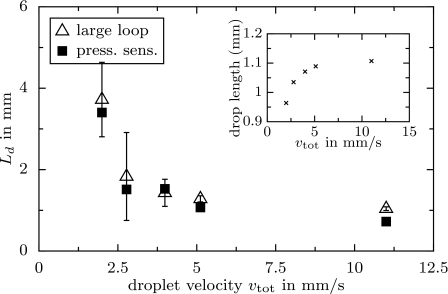
According to assumption (C), the hydrodynamic resistance length Ld should neither depend on the total flow rate in the channel nor on the velocity of the droplet. In fact, we found that this is the case only for velocities higher than approximately vtot=5 mm∕s, as Fig. 8 indicates. At small droplet velocities we find very large hydrodynamic resistances. The droplet resistance decreases with increasing velocity, until only a weak dependence is observed beyond vtot=5 mm∕s. The data plotted in Fig. 8 have been obtained from the large-loop device and are in good agreement with the reference measurement. It is important to stress this agreement, as it shows that the large-loop device indeed measures the droplet resistances, and that it does not depend on assumption (C), as was already explained at the end of Sec. 2B2.
Figure 8.
The resistance length Ld (large-loop method and pressure sensor) as a function of the droplet velocity vtot. Inset: length of the droplet (cap to cap). The parameters are ηd=0.01 Pa s, ηΦ=0.02 Pa s, Ls=53 mm, Lℓ∕Ls=1.5, and Ωd=95 nl. The distance varies as λ from 5 to 15 mm from small to large velocities.
The velocity value vtot in the measurement is the one in the incoming channel, which is systematically different from the true velocity at which the droplets move. In the large-loop device, however, we find automatically balanced flow rates and therefore also balanced velocities in the two branches, which allows one to say that both are half the incoming velocity, vs≈vℓ≈vtot∕2, at least on average. That we obtain the true velocity immediately from a measurement in the straight part of the channel is the reason why we performed this experiment with the large-loop device and not with the small-loop device, where the velocity ratios depend on the droplet resistances, unless the droplet velocity is sufficiently high.
The measurements in Fig. 8 have been performed using droplets of the same volume and the same composition. The velocity was varied by injecting more oil between the droplets. Together with the total flow rate, thus also the initial spacing between the droplets was varied between 5 and 15 mm. The origin of the strong increase in resistance at small velocities is unclear at the moment. We found a correlation with the shape of the droplets (inset in Fig. 8), indicating a systematic lengthening of the fast flowing droplets. This increases the thickness of the thin oil film between the droplet and the walls and reduces the total resistance of the droplets.17 A dynamical theory, which would allow to fit the droplet resistances given in Fig. 8, is not known to us. In fact, we tried to fit the data to the existing formulas for the resistance as a function of the droplet size and of the velocity. In Ref. 19 a proposition containing a scaling with v1∕3 is put forward for bubbles. In Ref. 24 the scaling is rather v1∕2. Neither formula yielded a remotely satisfactorily result for the data in Fig. 8. The details of the surrounding flow and of the internal circulation in the droplet are evidently much more important than in the case of bubbles, where a simple scaling approach seems to work.15, 19, 25
Influence of the droplet viscosity
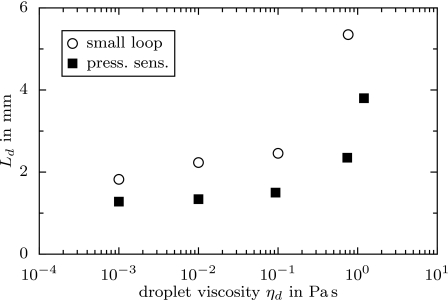
Another set of experiments with the small-loop device explores the influence of the viscosity of the glycerol∕water mixture inside the droplets on their resistance. The viscosity was changed by varying the concentrations of glycerol and of water in the mixture; the continuous phase and the velocity were kept constant. Figure 9 depicts the resulting resistance length Ld as a function of the fluid viscosity in the droplet. The values of Ld remain approximately constant as long as the droplet viscosity is lower than the viscosity of the surrounding phase. Beyond this value, they exhibit a strong increase which can be attributed to the enhanced viscous dissipation by the internal circulation in the droplets. Similar effects have been observed in Ref. 24. The agreement between the results of the small-loop device and the pressure sensor is mediocre. We do not have a convincing explanation for the deviations at the moment. Nevertheless, the two measurements exhibit the same ascending trend. As described above, the velocity of the droplets was quite fast in order to stay within the part of Fig. 8 where the velocity does not strongly influence the resistance length. We chose this regime in order to clearly separate the respective influence of the viscosity from others.
Figure 9.
The resistance length Ld (small-loop method) as a function of the droplet viscosity. The parameters are ηΦ=0.02 Pa s, Ls=4.35 mm, Lℓ∕Ls=1.18, vtot=9 mm∕s, λ>9 mm, and Ωd=65 nl.
The qualitative form of the flow fields are depicted in the sketch of the counter-rotating eddies in Fig. 7. The two panels of the figure present two different topologies for the two extreme cases of the ratio ηd∕ηΦ. These two topologies are expected because the fluid with higher viscosity should avoid producing several eddies, each of which increases the viscous dissipation. Despite the fact that there are two clearly distinguished regimes of the function Ld(ηd) in Fig. 9—in one of which it is nearly constant, in the other it is fast growing—we find a rather smooth change from one regime to the other, and not an abrupt one at the point of equal viscosity ηd=ηΦ. The curve may further be extrapolated to an infinite droplet viscosity, in which the result of a nearly filling rigid object in a channel is reached. The resistance of such an object depends solely on its filling property, that is, on the thin film between object and walls. It is then only the ratio of surface tension and exterior viscosity (exterior capillary number) that determines the thickness of the thin film.
Influence of the initial interdroplet distances
We now discuss possible cooperative effects between adjacent droplets and thus explore the validity of assumption (B). Of course, this can only be undertaken by the large-loop device since the small loop contains not more than one droplet. Upon varying the initial distance between droplets, we find indeed a critical droplet spacing below which assumption (B) does not hold any more. Figure 10 visualizes this result, as measured by the large-loop device. For small distances, an increase in the droplet resistance as a function of the distance can be seen. Beyond approximately 6 mm, we find an apparent plateau. The large uncertainties in this part of the data are caused by the small number of droplets in the branches of the loop. For any given maximal size of the large loop results a maximal reasonable droplet distance. The uncertainties can, however, be reduced either by using a ratio Lℓ∕Ls closer to unity, or by investigating narrower channels. In the latter case, the droplet distance up to which cooperative effects occur should be decreased together with the width∕height of the channel. The necessity to work at distances larger than 6 mm in order to guarantee the validity of assumption (B) has already been taken into account in the previously described measurements.
The decrease in resistance at distances smaller than 6 mm gives evidence to a collective motion of the droplet. This means that a pair or a series of droplets can be displaced more easily than the same number of individual droplets. This observation sheds light on the relative importance of the three different contributions to the hydrodynamic resistance, as mentioned above in the discussion of Fig. 7. In the literature on (inviscid) bubbles, the contribution from the thin film has been considered as the primary reason for hydrodynamic resistance.15, 17 The decrease in resistance observed in the measurements in Fig. 10 proves that in our case the thin-film contribution cannot be dominant, but that the eddies outside of the droplet contribute equally. From Fig. 10 we can estimate the size of the eddies. The incoming distances of 6 mm correspond to a minimal distance between droplets of around 3 mm in the branches where the droplet sequences are not regular anymore. The diameter of the exterior eddies are then around 1 mm, thus two times the width of the channel.
Note that for experimental reasons, the three relevant parameters, namely, droplet velocity, droplet spacing, and the droplet volume, cannot all be independently controlled. Therefore, this set of experiments has not been performed at constant flow rate (inset in Fig. 10). There is thus a hidden influence of the droplet velocity on Ld, which should pronounce the dependence on λ even more.
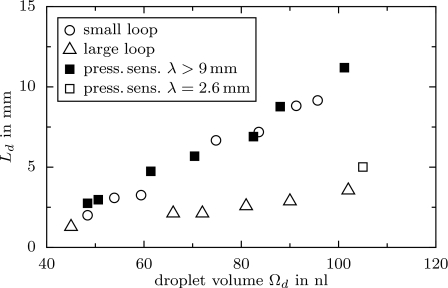
The full function Ld(λ,vtot,Ωd,ηd,ηΦ) can only be fully displayed in a high-dimensional plot. A nontrivial dependence of the parameters is found when varying two of them at the same time. Figure 11 shows such an example, namely, the resistance length Ld as a function of the drop volume. The small-loop data have already been presented in Fig. 6. The corresponding large-loop resistances are systematically smaller. The error bars and an independent measurement with the pressure sensor both indicate that the difference is not an artifact. The discrepancy is misleading since the difference here is due to the smaller interdroplet distance of approximately 3 mm in the large-loop experiment. For the volume of 65 nl, we find the same value Ld≈2 mm in Fig. 10 at this very distance. The resistance length, when measured with the small-loop device, is approximately 5 mm at a volume of 65 nl. This value is approximately the one of the plateau at large distances in Fig. 10. We may thus conclude that the small-loop device really measures the resistances of individual droplets, and that this resistance corresponds to the plateau at large distances in the large-loop device.
Figure 11.
Combined influence of two parameters. The resistance length Ld (all three methods) as a function of the droplet volume. Plotted are the data from Fig. 6 (short-loop and pressure sensor), in comparison to data using a smaller interdroplet distance (pressure sensor and large loop, λ≈3 mm). The empty symbol for the pressure sensor corresponds to a distance of λ=2.6 mm. The other parameters are ηd=1.4 Pa s, ηΦ=0.02 Pa s, and vtot=6 mm∕s.
Figure 11 leads us to a comment which we consider central in the analysis of droplet traffic in networks. When droplets are driven through a complex and possibly large network of microfluidic channels, comprising a lot of junctions, then no direct control over parameters, such as their distance or their velocity, is possible. When the droplet trains in an existing device exhibit irregularities, i.e., that they do not follow the trajectory they are supposed to follow in order to fulfill the objective of the device, then it will become necessary to understand the droplet dynamics in more detail. The present work demonstrates some aspects of this understanding for a simple device, where the mutual influence of the hydrodynamic resistance and the droplet movement becomes apparent.
SUMMARY
In the present paper we use three methods to measure the effective hydrodynamic resistance of droplets in microchannels: one standard method based on the use of pressure sensors and two variants of a new method relying on the analysis of droplet trajectories in a simple microfluidic device. These two variants are proposed as complementary techniques, as they are based on different model assumptions on the droplet behavior in the microfluidic network.
The main idea put forward here is to use the global droplet dynamics, namely, the distances between droplets, their number in each branch of the loop, and the choices taken at the first junction. All of them can simply be extracted by analyzing a video of the droplets flowing. The methods are noninvasive as they do not require additional measuring channels for pressure sensors nor do they require expensive equipment. The interpretation of these observables to obtain the resistances is based on a theoretical model, the simplifying assumptions of which we test in the present work. The proposed methods focus rather on the understanding of the droplet dynamics than on the isolated measurement of the all-parameter dependence of the hydrodynamic resistance of droplets. In this sense, it is not meant to replace the standard method employing pressure sensors but rather to provide a guided example for how the droplet dynamics reacts on variations in the hydrodynamic resistance and vice versa.
We were able to show that there exists a parameter regime where the assumptions adopted by the model do hold. In this regime, the quantity that we extracted from the experimental observations indeed serves as the wanted hydrodynamic resistance of droplets. These results are presented in Figs. 6891011, where we varied different parameters, namely, the volume, velocity, and viscosity of droplets, as well as their distance. All these sets of measurements were done in a way such that they avoid those parameter regimes where the model assumptions are not valid. Therefore, they do not contradict each other. This claim is enforced by independent and more direct measures of the droplet resistances, undertaken with an expensive and elaborate pressure sensor technique. The requirement to find the (formerly unknown) valid part of a high-dimensional parameter space presented the main intellectual difficulty while generating the results displayed in the figures. The parameter dependencies we found are the following. The hydrodynamic resistance increases with increasing volume and increasing viscosity of the droplet. It increases with interdroplet distances as long as the distances are smaller than approximately 6 mm. Beyond that value the resistance does not depend on the interdroplet distance. For small droplet velocities, the resistance strongly decreases with increasing velocity. It changes only a little for velocities beyond 3 mm∕s. On a more fundamental level of description, the results presented here demand a systematic determination of the hydrodynamic resistance as a function of droplet volume, spacing, velocity, and viscosity. This could be done, for example, by extending Refs. 18, 26, which are concerned with the resistance of inviscid bubbles not droplets. In the limit of high velocities, large distances, and small volumes, the resistance will still turn out to be constant, as assumed by the simple model used here.
ACKNOWLEDGMENTS
This work was supported by the French National Agency for Reseach (ANR Grant No. 06–NANO–048–02) and the National Centre de la Recherche Scientifique. We thank all the participants in this project for stimulating discussions.
References
- Joanicot M. and Ajdari A., Science 10.1126/science.1112615 309, 887 (2005). [DOI] [PubMed] [Google Scholar]
- Cristobal G., Arbouet L., Sarrazin F., Talaga D., Brunel J. -L., Joanicot M., and Servant L., Lab Chip 10.1039/b602702d 6, 1140 (2006). [DOI] [PubMed] [Google Scholar]
- Tice D., Song H., Lyon A. D., and Ismagilov R. F., Langmuir 10.1021/la030090w 19, 9127 (2003). [DOI] [Google Scholar]
- Dendukuri D., Tsoi K., Hatton T. A., and Doyle P. S., Langmuir 10.1021/la047368k 21, 2113 (2005). [DOI] [PubMed] [Google Scholar]
- Zheng B., Roach L. S., and Ismagilov R. F., J. Am. Chem. Soc. 10.1021/ja037166v 125, 11170 (2003). [DOI] [PubMed] [Google Scholar]
- Prakash M. and Gershenfeld N., Science 10.1126/science.1136907 315, 832 (2007). [DOI] [PubMed] [Google Scholar]
- Thorsen T., Roberts R. W., Arnold F. H., and Quake S. R., Phys. Rev. Lett. 10.1103/PhysRevLett.86.4163 86, 4163 (2001). [DOI] [PubMed] [Google Scholar]
- Song H., Tice J. D., and Ismagilov R. F., Angew. Chem., Int. Ed. 42, 767 (2003). [DOI] [PubMed] [Google Scholar]
- Willaime H., Barbier V., Kloul L., Maine S., and Tabeling P., Phys. Rev. Lett. 10.1103/PhysRevLett.96.054501 96, 054501 (2006). [DOI] [PubMed] [Google Scholar]
- Garstecki P., Fuerstman M. J., and Whitesides G. M., Nat. Phys. 1, 168 (2005). [DOI] [PubMed] [Google Scholar]
- Schindler M. and Ajdari A., Phys. Rev. Lett. 10.1103/PhysRevLett.100.044501 100, 044501 (2008). [DOI] [PubMed] [Google Scholar]
- Adzima B. J. and Velankar S. S., J. Micromech. Microeng. 10.1088/0960-1317/16/8/010 16, 1504 (2006). [DOI] [Google Scholar]
- Mortensen N. A., Okkels F., and Bruus H., Phys. Rev. E 10.1103/PhysRevE.71.057301 71, 057301 (2005). [DOI] [PubMed] [Google Scholar]
- Engl W., Roche M., Colin A., Panizza P., and Ajdari A., Phys. Rev. Lett. 10.1103/PhysRevLett.95.208304 95, 208304 (2005). [DOI] [PubMed] [Google Scholar]
- Bretherton F. P., J. Fluid Mech. 10.1017/S0022112061000160 10, 166 (1961). [DOI] [Google Scholar]
- Hodges S. R., Jensen O. E., and Rallison J. M., J. Fluid Mech. 10.1017/S0022112003007213 501, 279 (2004). [DOI] [Google Scholar]
- Wong H., Radke C. J., and Morris S., J. Fluid Mech. 10.1017/S0022112095001455 292, 95 (1995). [DOI] [Google Scholar]
- Link D. R., Anna S. L., Weitz D. A., and Stone H. A., Phys. Rev. Lett. 10.1103/PhysRevLett.92.054503 92, 054503 (2004). [DOI] [PubMed] [Google Scholar]
- Fuerstman M. J., Lai A., Thurlow M. E., Shevkoplyas S. S., Stone H. A., and Whitesides G. M., Lab Chip 10.1039/b706549c 7, 1479 (2007). [DOI] [PubMed] [Google Scholar]
- Qin D., Xia Y., and Whitesides G. M., Adv. Mater. (Weinheim, Ger.) 10.1002/adma.19960081110 8, 917 (1996). [DOI] [Google Scholar]
- Duffy D. C., McDonald J. C., Schueller O. J. A., and Whitesides G. M., Anal. Chem. 10.1021/ac980656z 70, 4974 (1998). [DOI] [PubMed] [Google Scholar]
- Harrison C., Cabral J. T., Stafford C. M., Karim A., and Amis E. J., J. Micromech. Microeng. 10.1088/0960-1317/14/1/021 14, 153 (2004). [DOI] [Google Scholar]
- Malsch D., Kielpinski M., Merthan R., Albvert J., Mayer G., Köhler J. M., Sube H., Stahl M., and Henkel T., Chem. Eng. J. 135, S166 (2008). [Google Scholar]
- Groß G. A., Thyagarajan V., Kielpinski M., Henkel T., and Köhler J. M., Microfluid. Nanofluid. 5, 281 (2008). [Google Scholar]
- It has to be noted that the large deviations in the data fit in Ref. put into question the scaling argument first put forward by Bretherton (Ref. ). We do not have a better explanation, however.
- Anna S. L., Bontoux N., and Stone H. A., Appl. Phys. Lett. 10.1063/1.1537519 82, 364 (2003). [DOI] [Google Scholar]


