Abstract
Understanding the biological feeding strategy and characteristics of a microorganism as an actuator requires the detailed and quantitative measurement of flow velocity and flow rate induced by the microorganism. Although some velocimetry methods have been applied to examine the flow, the measured dimensions were limited to at most two-dimensional two-component measurements. Here we have developed a method to measure three-dimensional two-component flow velocity fields generated by the microorganism Vorticella picta using a piezoscanner and a confocal microscope. We obtained the two-component velocities of the flow field in a two-dimensional plane denoted as the XY plane, with an observation area of 455×341 μm2 and the resolution of 9.09 μm per each velocity vector by a confocal microparticle image velocimetry technique. The measurement of the flow field at each height took 37.5 ms, and it was repeated in 16 planes with a 2.50 μm separation in the Z direction. We reconstructed the three-dimensional two-component flow velocity field. From the reconstructed data, the flow velocity field [u(x,y,z),v(x,y,z)] in an arbitrary plane can be visualized. The flow rates through YZ and ZX planes were also calculated. During feeding, we examined a suction flow to the mouth of the Vorticella picta and measured it to be to 300 pl∕s.
INTRODUCTION
Vorticella is a microorganism categorized as a stalked ciliate protozoan. Vorticella has a stalk anchored onto a substrate and an array of cilia distributed around its oral region for feeding.1 When feeding, these cilia move constantly, creating a powerful vortical flow. Suspended particles in the vicinity are sucked into this vortex and into the oral opening. It is important to examine the flow generated by a microorganism for scientific and engineering interests. From a scientific point of view, it is of great interest to study the flow generated by a microorganism in order to understand a specific biological feeding strategy. The feeding mechanism of stalked ciliates is used to collect food from the surrounding water while the cell is attached to a substrate.2 In contrast, most macroscopic animals travel to capture food. It is not well understood why stalked ciliates produce vortexlike flows and circulate the flow for repeated uptake of bacteria, as well as the size and shape of the flow and the magnitude and composition of the inflow of suction. From an engineering viewpoint, it is necessary to characterize the flow created by a microorganism for the potential utilization of this microorganism as a microfluidic device inside microelectromechanical systems. Such devices have been successfully developed; Kim and Breuer3, 4 presented two types of active biobased devices for micrototal analysis systems. They reported that the movement of the flagella of microorganisms enhanced mixing in a microchannel at low Reynolds numbers and could be employed as micromixers in microchannels.3 They also demonstrated that fluid could be pumped through microchannels at speeds of as high as 25 μm∕s.4 This flow was induced by the collective motion of thousands of the self-organized flagella. The characterization of microorganismic-induced flows is indispensable for the design and application of devices based on microorganisms.
Several velocimetry methods have been applied to investigate fluid flow dynamics induced by microorganisms.5, 6, 7, 8, 9, 10, 11, 12 However, to our knowledge, a three-dimensional (3D) velocimetry method to measure the flows generated by microorganisms has not yet been reported. The dimensions of the measurements have been limited to two-dimensional (2D) two components. Only a few studies of flow rates around the microorganism were carried out. Vopel et al.5 conducted measurements of one-dimensional one-component flows induced by ciliates with a flow microsensor. They scanned the sensor around the vicinity of a Vorticella and a Zoothamnium and obtained the linear velocity profiles of the flow. They were able to measure quantitative flow speeds with this method; however, it is inappropriate for measuring the 3D flow field while a Vorticella is stationary because they recorded 1000 data points at 50 Hz and averaged them, and the acquisition of the flow velocity at each point takes 20 s. Furthermore, they could not measure the water velocity at a distance smaller than 50 μm from the cell body of the Vorticella because the deformation of the flow field caused by the presence of the sensor tip changed the positions of the ciliates.
2D two-component measurements were conducted with two different velocimetric methods.6, 7, 8, 9, 10, 11, 12 The first method is particle tracking velocimetry (PTV), a technique to measure the velocity of a flow-driven particle. Sleigh and Aiello applied PTV to microorganisms and followed the movement of water around the cilia of Vorticella6 and Stentor7 by tracing the motion of latex particles with a frame-by-frame analyses of cine films obtained with microscope and a high speed camera. Fried and Lemmer8 studied the flow velocity field induced by Epistylis. They presumed that the suction flow was axially symmetric and estimated the inflow of suction produced by a single cell. This flux was approximately 106 μm3∕s or 1 nl∕s. The other type of velocimetry image-based method is particle image velocimetry (PIV), an optical method to measure velocities by calculating the correlation between two images. Hartmann et al.,9 Kowalczyk et al.,10 Petermeier et al.,11 and Kondratieva et al.12 applied PIV to microorganisms and studied flow fields created by Opercularia asymmetrica. They measured 2D two-component flows in the vicinity of the microorganism. Since their measurements were limited to two dimensions, they assumed that the suction flow was axially symmetric to obtain the inflow induced by Opercularia. The calculated inflow was within the order of magnitude of 1nl∕min, corresponding to a few hundred pl∕s.
Malkiel et al.13 used 3D-PTV and studied the 3D flow field generated by Copepod with a holography system. Although this technique is effective for a macroscopic setup, there are difficulties associated with the application of this method to a microscopic setup due to the dimensions of the equipment. Kinoshita et al.14 developed a confocal micro-PIV system by combining a confocal microscope PIV system and a piezoscanner, and they measured the 3D internal flow of a moving droplet. The system reduces the thickness of the focal plane and enables them to perform 3D measurements of the flow by scanning with the thin focal plane. This technique is effective for examining microscale flows, but has not yet been applied to the study of flows generated by microorganisms.
Here we have adopted this technique to measure the flow around a microorganism. Since prolonged laser exposure is detrimental to the microorganism, we shortened the irradiation time to minimize adverse effects. We measured the 3D two components of velocities and obtained the volume flux generated by a single Vorticella.
METHODS
Microbiological preparation
Vorticella picta was collected from Lake Hattyou in Yoshimi, Saitama. We isolated V. picta and cultivated them in a culture medium containing bacteria at around 25 °C. We kept 18×18 mm2 coverslips (thickness: 0.12–0.17 mm; Matsunami Glass Ind., Ltd., Osaka, Japan) floating on the culture medium for a few days until a suitable number of V. picta attached onto the coverslips. We made a filtered infusion of dry yeast (EBIOS, Asahi Food & Healthcare, Ltd., Tokyo, Japan) as shown below and used it for the culture medium. The medium was infused by autoclaving 2.5 g∕l of EBIOS in de-ionized water passed through a Milli-Q water system (Milli-Q water, Milli-pore, Billerica, MA) at 120 °C for 20 min. Then the infused liquid was filtered through a 0.2 μm filter unit (NALGENE® Disposable Filter Unit, 566–0020; capacity: 500 ml; Nalgene, Rochester, NY) to remove solid materials. Prior to experiment, we diluted this filtered liquid tenfold with de-ionized water and used it as the culture medium.
Flow tracers
Since a high speed camera requires high enough fluorescence, we used fluorescent particles 0.5 μm in diameter [FluoSpheres® carboxylate-modified microspheres, F8813, suspensions (2% solids) in water plus 2 mM sodium azide, yellow-green fluorescent (excitation∕emission wavelength=505∕515 nm), Molecular Probes, Inc., Eugene, OR] as the flow tracers and seeding particle. The carboxylate modification of microspheres is chosen because it is effective in preventing aggregation of the microspheres. To remove the sodium azide, prior to the experiments, we washed the particles with Dryl’s solution (2 mM Na3 citrate⋅2H2O, 0.6 mM NaH2PO4, 1.4 mM Na2HPO4, and 1.5 mM CaCl2⋅2H2O) by centrifuging the particles and discarding the supernatant several times. We adjusted the final concentration of the particles for PIV measurement to 0.2% solid concentration in order to obtain a high enough spatial resolution of the flow field.
Observation environment and flow tracers injection
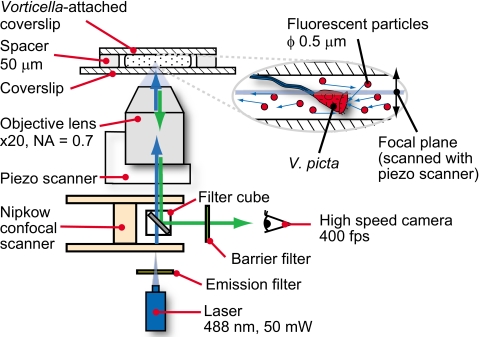
We observed a flow induced by V. picta in a flow chamber, as shown in Fig. 1. The flow chamber was composed of three parts: (1) The V. picta-attached coverslip (described in Sec. 2A), which was used as the upper side of the flow chamber; (2) a coverslip of larger size than the upper side (24×36 mm2; thickness of 0.12–0.17 mm; Matsunami Glass Ind., Ltd., Osaka, Japan) was used for the bottom side of the flow chamber; and (3) a spacer, which was sandwiched between the two coverslips to prevent crushing the V. picta. We coated a piece of paper, about 30 μm thick, with silicone grease (Dow Corning Toray High Vacuum Grease, Dow Corning Toray Co., Ltd., Tokyo, Japan). After coating, the thickness of the spacer was about 50 μm and the focal plane of our observation setup could span the entire height of the solution in the flow chamber. We pipetted the solution containing flow tracers from one side of the fabricated flow chamber and removed it from the other side by capillary action using Whatman No. 2 filter paper (Qualitative Filter Papers, Standard Grades, Grade 2, Whatman plc, Maidstone, Kent, UK). We removed protruding solution from both ends of the flow chamber and waited until a unidirectional flow generated by the imbalance of surface tension between both sides of the coverslip was no longer observed.
Figure 1.
A schematic of the present experimental setup to observe a flow induced by V. picta.
Measurement
We put the flow chamber on an inverted microscope (DMIRE2, Leica Microsystems GmbH, Wetzlar, Germany) equipped with an objective lens, a high speed camera, a confocal unit, a piezoscanner, and a laser (Fig. 1). Our observation setup was nearly identical to the experimental setup of Kinoshita et al.14 We used a 20× objective lens (HC PL APO 20×, numerical aperture of 0.7; Dry, Leica Microsystems, Wetzlar, Germany). The images were recorded at 400 frames∕s with a high speed camera (PHANTOM, Version 7.1, Vision Research, Inc., Wayne, NJ; 12 bit, monochrome, 800×600 pixel, and maximal camera speed of up to 4800 frames∕s). We collected the images at 2.5 ms intervals with an exposure time of 1.5 ms. Under these conditions, the spatial resolution was 0.568 μm∕pixel (352 pixel=200 μm), which corresponds to a 455×341 μm2 observation area in one field of view. To decrease the thickness of the focal plane, we used a high speed confocal unit (CSU22, Yokogawa Electric Corp., Tokyo, Japan). We used a laser (543-BS-A03, Melles Griot Inc., Albuquerque, NM; excitation wavelength of 488 nm) for the fluorescent illumination of the flow tracers and set the output of the laser at 50 mW. The thickness of the focal plane is 4.06±0.15 μm. A Nipkow disk in the confocal unit splits the laser and enables multibeam scanning for illumination of an object associated with the entire array of pixels of the camera. In accordance with 488 nm excitation laser, we used 488Ex_Ykgw and 488Ba_Ykgw_No. 1 (Yokogawa Electric Corp., Tokyo, Japan) as emission and barrier filters. The objective lens was operated stepwise by a piezoscanner (RT3D, Yokogawa Electric Corp., Tokyo, Japan; resolution: 5 nm, repeatability: ±5 nm) from the bottom to the top. The total scanning height was set to 100 μm in 41 steps with each step height of 2.50 μm at each step. 100 μm was measured to assure that the entire height of the flow field was covered. We controlled the piezoscanner and the high speed camera synchronously to obtain 15 fluorescent micrographs at each step. A total of 615 micrographs was taken in one cycle, which required about 1.5 s. During the image acquisition, we used laser illumination to reduce the exposure time.
PIV analysis of obtained images and definition of Cartesian coordinate system
We selected the images where fluorescent particles were visible for flow field measurements. Fifteen images were taken at each height every 2.5 ms (400 frames∕s). We then processed 14 images out of 15 images. We did not use the first of the 15 images at each height for the analysis because the first image contained noise from the actuation of the piezoscanner. The 14 images were reorganized to compose ten pairs of images with 10 ms interval (100 frames∕s). We chose 10 ms for the time interval of each image pair in order to appropriately detect correlation between the image pair with the PIV algorithm and time average the obtained flow field in order to remove large fluctuations between images. We converted the 12 bit images into 8 bit images for computational analysis. Then we analyzed the image pairs and calculated the flow velocities with a software package (KONCERTO, Seika Corporation, Tokyo, Japan). The images were evaluated using a cross-correlation method. Each image was interrogated at 32×32 pixel subimages with an overlap of 75% corresponding to intervals of 16 pixels. This provided 2D velocity data at 9.09×9.09 μm resolution. We averaged the ten calculated flow fields at each height. We produced a graphical representation of these analyzed flow velocities with TECPLOT (Tecplot, Inc., Bellevue, WA). Here, we define a Cartesian coordinate system to reconstruct 3D two-component flow fields: The X axis is parallel to the long side of the image, the Y axis is parallel to the short side of the image, and the Z axis is parallel to the scanning direction of the objective lens and orthogonal to the XY plane. The origin of this coordinate system is located at the upper left corner of the images. Moreover we set the origin of the Z axis at the bottom of the flow fields shown. We added height information to obtain the flow velocity field [u(x,y),v(x,y)] in order to reconstruct the flow field. We acquired the area, SVth<Vmag, where flow speeds, , were greater than the threshold value of velocity Vth by counting each grid area (on the XY plane for 9.09×9.09 μm2 and on the YZ and XZ planes for 9.09×2.50 μm2). Statistical analyses such as polynomial regression were performed with MICROSOFT OFFICE EXCEL 2007.
Calculation of the flow rate from the obtained flow velocities
We calculated the flow rates through one plane from the obtained flow velocities. When we define a plane, the flow rate through the plane is given by
| (1) |
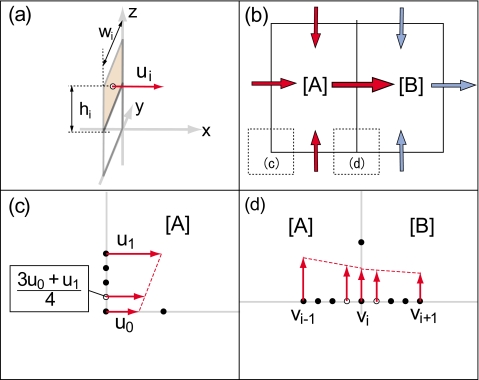
where S is a defined surface, is the velocity vector, and is the normal vector to the surface. The flow rates are approximated by the summation of the product of the flow speed normal to the surface and the surface area, based on the obtained data (Fig. 2),
| (2) |
where ui is a flow velocity normal to a surface, Si is the area of the surface, wi is the width, and hi is the height of each surface. Here wi and hi have the same values in our experiment. Thus, S0 is written by
| (3) |
where w0 is the interval of the data points of flow velocities, 16 pixel, i.e., 9.09 μm, and h0 is the piezoscanning step height of 2.50 μm. Therefore Si is always the same value, 22.7 μm2. Since S0 is a common term, Q is given by the following equation:
| (4) |
Therefore, we can calculate flow rates by multiplication of the area and the summation of flow speeds.
Figure 2.
A schematic illustration of calculating flow rates. (a) Flow rates were determined by the summation of the product of flow velocity normal to a surface and the area of the surface. (b) The method to calculate flow rates through a selected grid region. [(c) and (d)] The approximation method to calculate flow rates at the boundary of the grid for the edge (c) and boundary of areas A and B (d).
We approximated flow rates at the edge of the area and at the boundary of the grids, as depicted in Figs. 2c, 2d. On the edge area, we set a representative velocity at a midpoint of the area. We estimated the flow velocity on the edge area as (3u0+u1)∕4, where u0 and u1 are the adjacent flow velocities on the edge area. We multiplied the approximated velocity by S0∕2 and calculated flow velocity at a representative point. The error of the approximated velocity is the discrepancy between the exact value and the approximation of the velocity. The error increases when flow speeds change drastically. On the boundary of areas A and B, we divided S0 into two parts at the midpoint. The flow rates of both areas were approximated by multiplication of S0 and flow speeds (3vi−1+vi)∕4 and (3vi+vi+1)∕4, respectively, where vi−1, vi, and vi+1 are the adjacent flow velocities.
RESULTS
Observation of the feeding flow generated by Vorticella
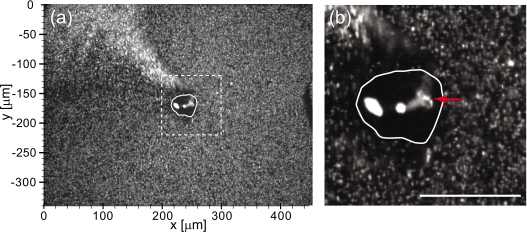
We observed feeding flows generated by over a dozen cells of V. picta under laser illumination. Figure 3 shows one of fluorescent images of V. picta and the fluorescent particles while the V. picta was feeding. The image was analyzed by the described PIV method. The cell body of the V. picta was at the center of the field of view. The dark area is the cytoplasmic matrix of the V. picta and the bright white area is its food vesicles. The dimmer white area connected to one of the food vesicles is the infundibular organ of the V. picta, indicated with the red arrow in the figure. Fluorescent particles were collected and distributed by the V. picta and the particles were ejected and accumulated in the upper left of Fig. 3. In most cases, cells of V. picta continued for feeding for a few seconds after the 50 mW laser illumination began. However after several seconds of laser illumination, they stopped feeding and began to contract and elongate repeatedly. When cells of V. picta contracted, the flow patterns changed and the particles which had been moving stopped suddenly. The only particles displaying any motion were those near the cell bodies and stalks of the cells of V. picta.
Figure 3.
A fluorescent micrograph of V. picta in a solution of fluorescent particles taken at z=15 μm. At this height, the dimensions of the V. picta are approximately 45 μm in width and 35 μm in height. (a) An image with our conventional coordinate system used for PIV analysis. (b) The magnified view of the region enclosed by the dashed box in (a). Red arrow indicates the infundibular organ of the V. picta. (Scale bar: 50 μm.)
2D two-component flow fields at different heights
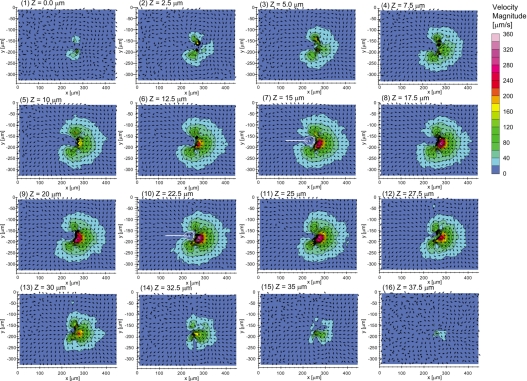
We obtained 2D two-component flow velocities in the XY planes at different heights with the scanning PIV method described above. Here we show the 16 flow velocity fields at different heights ranging from z=0 μm to z=37.5 μm separated by a 2.50 μm interval (Fig. 4). After scanning 41 heights, fluorescent particles were visible in images taken at 18 out of the 41 heights. From these, 16 heights showed an S20<Vmag greater than 1000 μm2.
Figure 4.
[(1)–(16)] 2D two-component flow fields at each height from (1) z=0.0 μm to (16) z=37.5 μm at 2.5 μm step. Color denotes the magnitudes of the flow velocities at each point. Only half of the obtained vectors are displayed.
The obtained flow fields appeared symmetric with respect to a plane located between z=17.5 and 20 μm. At all heights, two vortices in the XY planes were generated in front of the oral cavity of the V. picta. Behind the mouth opening of the V. picta, the randomness of the flow direction at the top (z=35, 37.5 μm) and bottom regions (z=0.0, 2.5 μm) was higher than that in the middle region (z=5.0–32.5 μm). The flow field had four main characteristics in the middle part. (1) Flow toward the oral opening of the V. picta was generated around the cell body. (2) The strongest regions of the flow were located in front of the mouth opening and also between the two vortices on each XY planes. (3) The flow speeds increased, as the distance between the mouths of the V. picta decreased. (4) The flow speeds were mostly smaller than 20 μm∕s in the proximity of V. picta cell body at distances ranging from x=215 to 260 μm and from y=−155 to −190 μm.
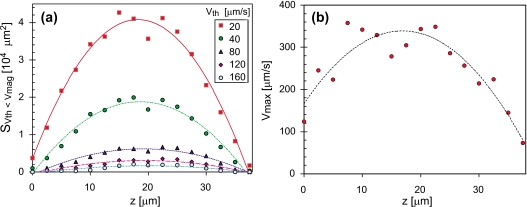
For convenience, we defined the feeding flow area SVth<Vmag, in which flow speeds were greater than a threshold flow speed Vth, as a parameter that indicates the size of the flow field. Another parameter is the maximum flow speed Vmax, indicating the magnitude of the flow field. Figure 5 shows the dependence of those parameters on height z. There were three characteristics in the fitted curves of these data points. The first characteristic is that the peaks of the curves for the feeding flow area with different threshold speeds occur between z=17.5 and 20 μm. The second characteristic is that the curves are convex upward. The third characteristic is that the curves have the axes of symmetry going through each vortex. The relation between SVth<Vmag and z can be approximated by a quadratic function curve. Coefficients of the best-fit quadratic equation, , are shown in Table 1. When the threshold flow speed is 20 μm∕s, the best-fit quadratic equation is given by 3568+4085z−112.0z2 (coefficient of determination, R2=0.979) and there is good agreement with the quadratic curve. As threshold flow speeds increased, and R2 decreased. The maximum flow speeds are correlated with the height. The best-fit quadratic equation of the maximum flow speeds at each height is (R2=0.843). The maximum flow speeds in the whole flow field is 357 μm∕s at z=7.5 μm. We obtained total volumes where Vmag is larger than each Vth. When Vth are 20 and 40 μm∕s, the total volumes are 16.6 and 7.26 pl, respectively.
Figure 5.
Graphs of (a) feeding flow areas SVth<Vmag and (b) the maximum flow speed Vmax vs height z. The second-order polynomial fitting curves for both data sets are also indicated. All parameters of the fitting curves are shown in Table 1.
Table 1.
Coefficients of the best-fit quadratic equation, SVth<Vmag=a+bz+cz2, to represent the dependence of the feeding flow area SVth<Vmag (μm2) on the height z (μm). The total volumes, where Vmag was larger than each Vth, are also represented.
| Threshold flow speed Vth (μm∕s) | Intercepta | Constantb | Constantc | Coefficient of determinationR2 | The total volumes where Vmag was larger than each Vth (nl) |
|---|---|---|---|---|---|
| 20 | 3568 | 4085 | −112.1 | 0.979 | 16.6 |
| 40 | −473.7 | 2074 | −55.90 | 0.969 | 7.26 |
| 80 | −796.3 | 730.8 | −19.05 | 0.937 | 2.35 |
| 120 | −605.3 | 375.5 | −9.682 | 0.872 | 1.12 |
| 160 | −486.7 | 222.3 | −5.670 | 0.766 | 0.598 |
3D two-component flow field viewed from the YZ plane and flow rate through the YZ plane
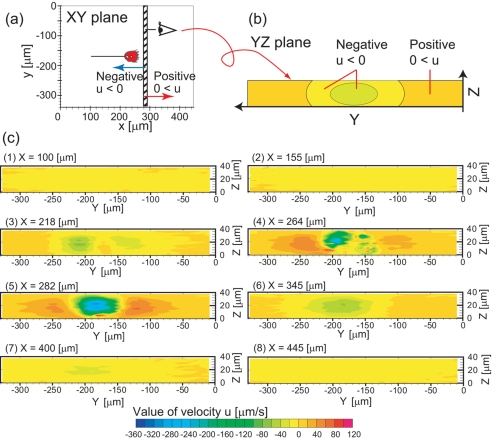
We reconstructed flow velocity fields and visualized the flow field in the YZ planes for eight X coordinates, as shown in Fig. 6. In the vicinity of the mouth, the magnitude of flow velocities umag is greatest. Closer to the mouth, umag became larger. At x=445 μm, all umag are in the range of 0–20 μm∕s. At x=400 μm, some of umag are in the range of 20–40 μm∕s. Even closer to the mouth, at x=345 μm, some of umag were in the range of 40–60 μm∕s. At x=282 μm, in the region adjacent to the mouth, umag was the greatest, as shown in Fig. 6. umag was greater than 200 μm∕s at the center of the figure. The flow speeds near the coverslip were slower than those of the middle region between two coverslips. In the cell body of the V. picta, at x=264 μm, u was disturbed near the cell body. In the rear part, from x=264 μm to x=9.09 μm, as the distance to the mouth dm increased, umag also decreased.
Figure 6.
Flow fields in the YZ planes. (a) The hatched box represents the location of the YZ plane. (b) Areas of the YZ plane are separated by color according to velocity. (c) Experimentally obtained flow fields in the YZ plane for eight various X coordinates.
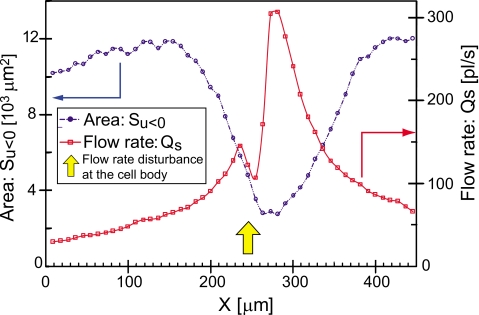
To characterize the suction flow, we focused on two values, the areas Su<0 and the flow rate Qu<0, which are shown in Figs. 67, respectively. In the front part of the mouth (from x=445 μm to x=264 μm), most of the values of u were negative and flow toward the mouth was generated. From x=445 μm to x=264 μm, Qu<0 gradually increased as dm decreased. Qs had a peak between x=270 μm and x=280 μm in front of the mouth. The maximum magnitude of Qs was 307 pl∕s at x=282 μm. At x=255 μm, where the YZ plane included the cell body, Qs had a local minimal value of 107 pl∕s. In the region of x<236 μm and 282 μm<x, as the dm becomes larger, the flow Qs becomes smaller. The value of Qs were above 20 pl∕s in all observed regions from x=9.09 to x=445 μm.
Figure 7.
A graph of the x axis distance vs the areas Su<0 and the flow rates of suction Qs through a YZ plane. The range x=270–280 μm is located in front of the mouth opening of the V. picta, also indicated as the yellow arrow. The entire area on a single YZ plane is 13.1×103 μm2. The blue and red arrows indicate the axis of each graph.
From x=445 μm to x=264 μm, as dm decreased, the size of the suction flow, Su<0, gradually decreased and the shape of the area Su<0 seems circular. Here, we define parenthetical percentage values as the Su<0 percentages of the entire area of a single YZ plane, 13.1×103 μm. At x=445 μm, Su<0 was 12.0×103 μm2 (91.6%). At x=345 μm, Su<0 was 7.23×103 μm2 (55.2%). We also observed the boundaries between negative and positive values of u, at about y=−280 and −110 μm. The shapes of the areas Su<−20 and Su<−40 appeared circular between x=345 μm and x=282 μm. The area Su<0 had minima around x=260–280 μm in the vicinity of the mouth. At the minima, the smallest value of Su<0 was 2.75×103 μm2 (21.0%). In the rear part of the mouth between x=264 μm and x=9.09 μm, as dm increased, Su<0 gradually increased. At x=218 μm, Su<0 was 7.91×103 μm2 (60.4%) and the flow determined by the body shape was observed. At x=155 and 100 μm, Su<0 were 11.9×103 μm2 (90.8%) and 11.2×103 μm2 (85.5%), respectively. From x=118 μm to x=9.09 μm, away from the cell body, Su<0 gradually decreased. At x=9.09 μm, Su<0 was 10.2×103 μm2 (77.9%).
Composition of flow rates of suction by V. picta
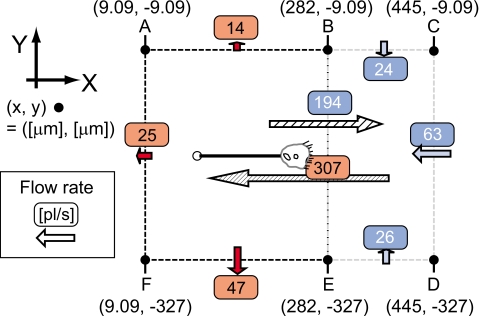
The amount of flow Q across a defined plane represents the components of the uptake flow of a V. picta. Planes are defined by points from A to F shown in Fig. 8. The plane CD is located far in front of the mouth and the plane AF far behind it. The plane BE is placed closely in front of the plane of the mouth opening. Other planes connect to the sides of those three planes. Thus, the rectangular space ABEF contains the cell body, while BCDE does not. The amount of influx and outflux across those planes is summarized in Table 2. Across plane BE, the inflow of suction was 307 pl∕s. Because some flow is recirculated from the back of the cell body, there was a flow in the reverse direction of 194 pl∕s across BE. There were net influxes of 24, 63, and 26 pl∕s through planes BC, CD, and DE, respectively. Outfluxes through BC, CD, and DE were below 1 pl∕s. Two-thirds of inflow to BCDE was supplied from the back side space ABEF through the plane BE. The total imbalances of flow of spaces ABEF and BCDE were 27 and 0 pl∕s, respectively.
Figure 8.
The relationship of flow rates in the vicinity of a V. picta in two areas, ABEF and BCDE. Flow rates are given in pl∕s and distances in μm. Only the total flow rates through planes are shown except the plane BE.
Table 2.
Influx and outflux through defined planes AB, BC, CD, DE, EF, and FA.
| Plane | Influx (pl∕s) | Outflux (pl∕s) |
|---|---|---|
| AB | 6 | 20 |
| BC | 25 | <1 |
| CD | 64 | <1 |
| DE | 27 | <1 |
| EF | 1 | 48 |
| FA | 4 | 29 |
DISCUSSION
The patterns of 2D two-component flow velocity fields were similar to the shape of the flow fields reported by Sleigh et al.6 Their results and our results have the same characteristic shape. There exist suction flows and two vortices in front of the mouth. This flow shape is also similar to other species of stalked ciliates.7, 10, 11, 12, 15 The flow fields are similar in that they both create filter-feeding currents by metachronal beating of the cilia of the paroral and oral polykinetid 1. Our measured suction inflow of 307 pl∕s is close to the values generated by protozoans which are 1 nl∕s (Ref. 8) and a few hundred pl∕s.9
Laser illumination induced contractions of cells of V. picta and stopped their feeding. It is presumed that laser illumination provides some stimulation to V. picta because electrical and mechanical stimulation cause the contraction of the bodies and stalks of V. picta.16 It is possible to increase the time of observation by decreasing the laser power, increasing the fluorescence of particle, and enhancing sensitivity of the camera. In Fig. 5, the area SVth<Vmag and the maximum flow speed Vmax correlates with the height z. These two values were approximated by polynomial functions and the shape of the curve appeared parabolic and symmetric. There are four reasons for these characteristics: (1) The flow speeds become slower near boundary, (2) the normal vector to the mouth plane was almost perpendicular to the XY plane and the obtained curve appeared symmetric, (3) the V. picta was located at the center area of the observation, and (4) the cilia enhanced the flow field at the center and the flow field was the strongest there. Compared to SVth<Vmag, Vmax shows some variability because these values are easily affected by a cilium, generating the flow reached at least a speed of 2500 μm∕s.6 At x=264 μm, the flow velocity u near the cell body was disturbed (Fig. 6). Qs had a local minimal value of 107 pl∕s at x=255 μm because the YZ plane there included the cell body and there was an insufficient number of fluorescent particles in the vicinity of the V. picta (Fig. 7). The total imbalances of flow rates through selected areas were only 27 and 0 pl∕s, respectively, and show good agreement with the value of zero in Fig. 8. However the total flow rates were not balanced. We attribute this difference to the measuring error of the PIV. There are three main sources of the error: (1) Our measurement area is not fully closed, (2) on the area where flow speed changed rapidly, the flow rate has non-negligible errors because the flow rate was approximated by the sum of the product of area and average flow speed, and (3) during observation of the same height, particles moved to other planes. In addition, another factor that hinders an accurate measurement is the influence from the motion of other cells of V. picta outside our observed area.
Our measured flow rates are significant for understanding biological feeding strategies as we discuss below. Peritrichous ciliates feed not only on actively swimming prey organisms but also on floating organisms such as bacteria, algae, and flagellates. First, to address the feeding strategy of V. picta for the actively swimming organisms, we consider Escherichia coli, a representative actively swimming organism which swims at around 20 μm∕s.17V. picta must generate sufficient area S20<Vmag in its vicinity to capture the swimming organism. The area S20<Vmag is around 40 000 μm2 (Figs. 45), and the total volume is 16.6 nl. Here we suppose that the V. picta is hemispheroidal in shape with an equatorial radius of 18 μm and a polar radius of 40 μm. The volume is calculated to be 27 pl. Simply dividing the total volume, 16.6 nl, by the volume of a V. picta, 27 pl, we can determine that the V. picta can collect food from a fluid volume at least 615 times its volume. Next, to capture floating organisms, the flow direction rather than flow speed is important; therefore, V. picta is capable of capturing organisms from a volume larger than 16.6 nl. The reason why a large feeding flow is needed or produced is to allow for the capture of a sufficient number of organisms for feeding. For larger sizes of prey organisms∕particles, the viscous force has a stronger effect, and the volume which V. picta can capture decreases. We observed the details of the suction flow to the mouth (Fig. 8).
The inflow volume to the mouth was 300 pl. 100 pl of the inflow was carried from the front of the mouth and 200 pl was brought from the rear of the mouth. Thus one-third of the volume is new liquid and two-thirds of the volume is old liquid. Two-thirds of the inflow of suction is recirculated to the front side from the rear side. The flow is circulated and the uptake of the bacteria was repeated. It is likely that the fluid circulates in this manner for the following reason: Once the flow field is generated, it is more efficient to maintain this stationary flow than to alter it because of inertia. From our data, we can obtain a clearing rate of solution per hour, which is the rate at which the organism can clear particles at low particle concentrations from a certain volume of water. We can assume that V. picta uptakes 100 pl∕s of fresh solution from our measurements. Then, the V. picta clears about 360 nl∕h. We divide the clearing rate per hour, 360 nl∕h by the cell volume, 27 pl, and obtain clearing rate per cell volume per hour, about 1.3×10⁴ 1∕h. This value is in agreement with the range given in Ref. 18. According to the reference, ciliates (V. picta is also categorized in this group) typically clear from 103 to 105 times their own volume per hour depending on the size of the feeding particle. The clearing rate of a V. picta is on the same order of magnitude as our measurement.
Flow generated by a microorganism is useful for the design of two types of microfluidic devices harnessing such a flow. For example, we can use V. picta as a microfluidic pump. If V. picta is encapsulated in a microchannel, the V. picta can work as a pump capable of generating flow of about 50 pl∕s. In this case, the advantage of such a device is that the V. picta feeding can be controlled with mechanical and electrical stimulation; with such stimulation, the V. picta can be made to stop feeding. V. picta also can be applied for micromixing which enhances mixing in a microfluidic channel. We are able to estimate the characteristics of such a mixer. We assume the length of one circuit of the produced vortex is 300 μm and the average flow speed is 20 μm∕s. Then presuming that three cycles are sufficient to mix a 16.6 nl solution, the V. picta would mix at a rate of 369 pl∕s.
CONCLUSION
We developed a method to measure the 3D two-component flow velocity field generated by a microorganism. For V. picta, we obtained 2D two-component flow velocity fields [u(x,y),v(x,y)] in the XY planes at different heights, by collecting such slices; we can reconstruct the 3D two-component flow velocity field [u(x,y,z),v(x,y,z)]. We analyzed the quantitative magnitudes of the flow field, as shown in Fig. 5 and Table 1. The maximum flow speeds within the entire flow field was 357 μm∕s at z=7.5 μm. The total volumes in which the speeds of the flow were larger than 20 and 40 μm∕s were 16.6 and 7.26 nl, respectively. From the reconstructed flow field, we visualized the suction flow in different cross sections, such as in the YZ planes shown in Fig. 6. We also acquired the flow rate through YZ and ZX planes and studied the composition of the suction flow produced by V. picta (Figs. 78 and Table 2). There were two types of strong flows in front of the mouth of the V. picta: The inflow of suction of 307 pl∕s and the reversed flow of 194 pl∕s. Two-thirds of the inflow of suction was reversed to the front side from the rear, and the flow was circulated. It is efficient to maintain the stationary circulating flow. Our measurement technique provides a convenient approach for the study of other a protozoa and microorganisms. Our method opens new possibilities for the examination of biological phenomena and the characteristics of active biobased devices.
ACKNOWLEDGMENTS
We acknowledge Dr. Isamu Morishita for the identification of the V. picta species. We thank Dr. Albert Liau and Mr. Mauricio Cordero for useful discussions and for critical reading of the manuscript. We appreciate Mr. Yoshinori Bando at the University of Tokyo for helpful discussion of flow analysis.
References
- H. E.Buhse, Jr., J. Eukaryot Microbiol. 45, 469 (1998). [Google Scholar]
- Curds C. R., Annu. Rev. Microbiol. 10.1146/annurev.mi.36.100182.000331 36, 27 (1982). [DOI] [PubMed] [Google Scholar]
- Kim M. J. and Breuer K. S., Anal. Chem. 10.1021/ac0614691 79, 955 (2007). [DOI] [PubMed] [Google Scholar]
- Kim M. J. and Breuer K. S., Small 10.1002/smll.200700641 4, 111 (2008). [DOI] [PubMed] [Google Scholar]
- Vopel K., Reick C. H., Arlt G., Pöhn M., and Ott J. A., Aquat. Microb. Ecol. 29, 19 (2002). [Google Scholar]
- Sleigh M. A. and Barlow D., Trans. Am. Microsc. Soc. 95, 482 (1976). [Google Scholar]
- Sleigh M. A. and Edward A., Acta Protozool. 11, 265 (1972). [Google Scholar]
- Fried J. and Lemmer H., Water Sci. Technol. 47, 189 (2003). [PubMed] [Google Scholar]
- Hartmann C., Özmutlu Ö., Petermeier H., Fried J., and Delgado A., J. Biomech. 10.1016/j.jbiomech.2005.11.006 40, 137 (2007). [DOI] [PubMed] [Google Scholar]
- Kowalczyk W., Zima B., and Delgado A., Exp. Fluids 43, 147 (2007). [Google Scholar]
- Petermeier H., Kowalczyk W., Delgado A., Denz C., and Holtmann F., Exp. Fluids 42, 611 (2007). [Google Scholar]
- Kondratieva P., Georgii J., Westermann R., Petermeier H., Kowalczyk W., and Delgado A., Exp. Fluids 45, 203 (2008). [Google Scholar]
- Malkiel E., Sheng J., Katz J., and Strickler J. R., J. Exp. Biol. 10.1242/jeb.00586 206, 3657 (2003). [DOI] [PubMed] [Google Scholar]
- Kinoshita H., Kaneda S., Fujii T., and Oshima M., Lab Chip 10.1039/b617391h 7, 338 (2007). [DOI] [PubMed] [Google Scholar]
- Fenchel T., Arch. Protistenkd. 123, 239 (1980). [Google Scholar]
- Patterson D. J., Behaviour 45, 304 (1973). [DOI] [PubMed] [Google Scholar]
- Mittal N., Budrene E. O., Brenner M. P., and van Oudenaarden A., Proc. Natl. Acad. Sci. U.S.A. 10.1073/pnas.2233626100 100, 13259 (2003). [DOI] [PMC free article] [PubMed] [Google Scholar]
- Fenchel T., Microb. Ecol. 6, 13 (1980). [DOI] [PubMed] [Google Scholar]


