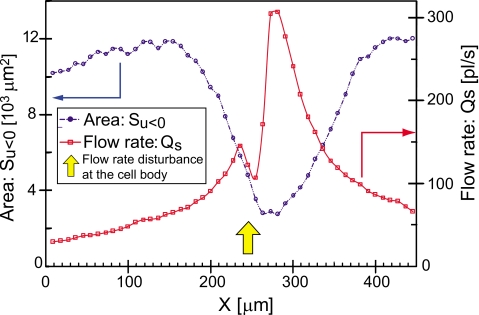
Figure 7.
A graph of the x axis distance vs the areas Su<0 and the flow rates of suction Qs through a YZ plane. The range x=270–280 μm is located in front of the mouth opening of the V. picta, also indicated as the yellow arrow. The entire area on a single YZ plane is 13.1×103 μm2. The blue and red arrows indicate the axis of each graph.

