Abstract
Wall shear rate (WSR) is the derivative of blood velocity with respect to vessel radius at the endothelial cell (EC) surface. The product of WSR and blood viscosity is the wall shear stress (WSS) that has been identified as an important factor for atherosclerosis development. High echo signal-to-noise ratio (eSNR) and high spatial resolution are crucial for minimizing the errors in WSR estimates. By transmitting coded pulses with time-bandwidth product greater than one, high eSNR from weak blood scatter can be achieved without increasing instantaneous power or sacrificing spatial resolution. This paper summarizes a series of measurements in a straight tube (5-mm diameter), constant velocity flow phantom using a 10 MHz transducer (60% bandwidth, f/1.5) imaged with a 72° Doppler angle, 125 MHz sampling frequency and 1 kHz pulse repetition frequency. Measurements were made using a frequency-modulated (FM) code, phase-modulated (PM) codes, and uncoded broadband and narrow band pulse transmissions. Both simulation and experimental results show that coded-pulse excitation increases accuracy and precision in WSR estimation for laminar flow over a broad range of peak velocity values when compared to standard pulsing techniques in noise-limited conditions (eSNR < 30 dB). The code sequence and its length are selected to balance range lobe suppression with eSNR and echo coherence enhancements to minimize WSR errors. In our study, the combination of an eight bit Optimal coded pulse with a Wiener compression filter yielded the highest WSR estimation performance.
I. INTRODUCTION
Cardiovascular disease has been the leading causes of mortality in the United States since 1900 [1]. It often develops from atherosclerosis [2], which is an arterial disease characterized by the accumulation of lipids and calcified tissues within the vascular wall. Hemodynamic shear stress acting on the endothelial cell (EC) surface has been identified as an important physiological mechanism for control of arterial tone [3]. See Table I for abbreviations used in this paper. However, low (<0.4 Pa, 1 Pa = 10 dyne/cm2) [4] and oscillating wall shear stress (WSS) patterns induce both structural and functional changes in endothelial cells, leading to arterial wall remodeling, atheroma, and eventually atherosclerosis [5].
TABLE I.
List of abbreviations.
| CC | cross correlation |
| EC | endothelial cell |
| ECG | electrocardiogram |
| eSNR | echo signal-to-noise ratio |
| FM | frequency modulated |
| IVUS | intravascular ultrasound |
| MF | matched filter |
| PM | phase modulated |
| PRF | pulse repetition frequency |
| psf | point spread function |
| RF | radio frequency |
| TBP | time-bandwidth product |
| TEQ | tissue equalization |
| WF | Wiener filter |
| WGN | white Gaussian noise |
| WSR | wall-shear rate |
| WSS | wall-shear stress |
WSS is estimated from the product of wall shear rate (WSR) and blood viscosity µ:
| (1) |
r is the radial position within the vascular lumen and r0 is the instantaneous lumen radius.
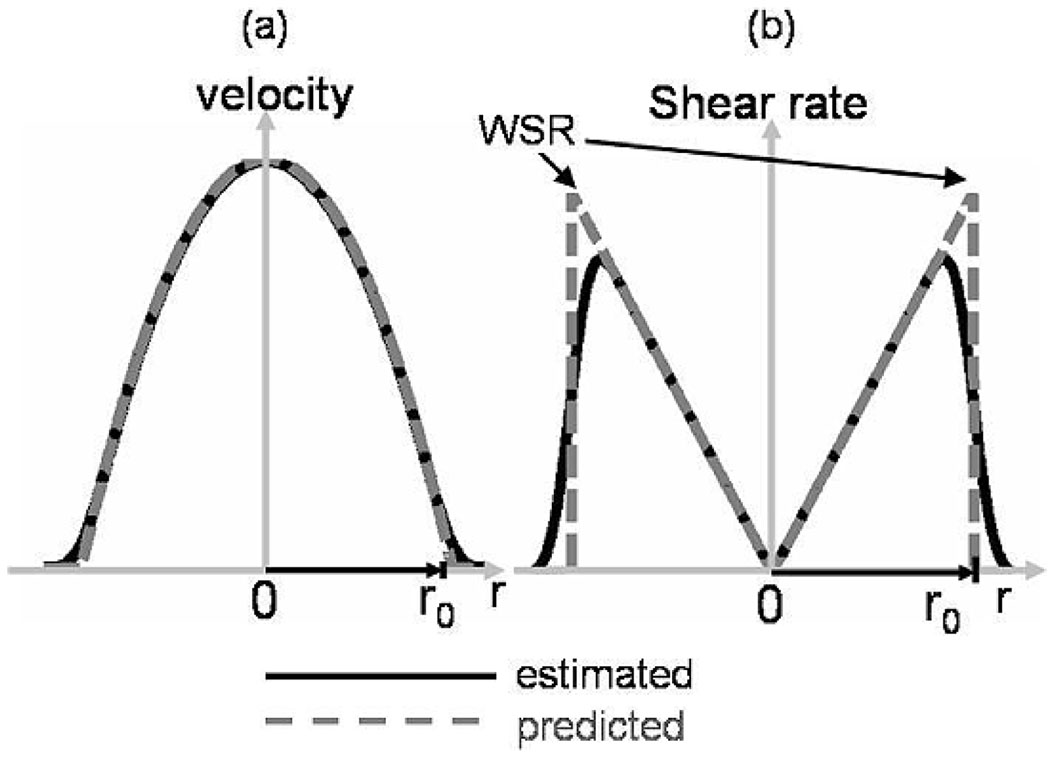
Fig. 1 shows that the shear rate for laminar flow is greatest at the EC surface where blood velocity V is minimum. However, the measured velocity profile is blurred by the estimation process, thus velocity gradient estimates, and consequently shear-rate estimates, are biased. The bias is greatest at the lumen surface, at which WSR influences EC function. The bias can be reduced by increasing the pulse bandwidth and shortening the echo window used to localize velocity estimates; however, the sensitivity to blood echoes is often degraded. The loss of sensitivity decreases the echo signal-to-noise ratio (eSNR) and ultimately increases WSR variance. Thus, we improve WSR bias or variance at the expense of the other. Another challenge to accurate velocity estimation near the vessel wall is brought on by the large difference between echo amplitudes inside (blood) and outside (tissue) the lumen for transmission frequencies less than 20 MHz. Hughes and How [6] reported a 28% error in WSR estimates that resulted from an 8% error in velocity at 20 MHz.
Fig. 1.
Predicted and measured profiles of (a) flow velocity and (b) shear rate magnitude across a laminar flow channel of radius r0. WSR is measured at channel r = r0.
The available ultrasonic flow imaging techniques used for WSR measurement include estimation with narrowband pulsed Doppler [7] and broadband cross-correlation [8] methods, in which each can be combined with contrast media [9]. We discounted the use of contrast agents to increase eSNR near the vessel wall because a radial pressure gradient pushes blood cells and contrast particles toward the center of the lumen via Siemens Antares. From data we acquired with the Siemens antares system using five-cycle Doppler pulses, 16-pulse ensembles, and an autocorrelation estimator, we found a −28% bias and a 15% standard deviation in WSR estimates for laminar flow. Though WSR variance can be reduced by extending the pulse duration or increasing the packet size [12], the concomitant loss in spatial and temporal resolution reduces WSR measurement accuracy. Broadband pulsing coupled with cross-correlation velocity estimation was selected for WSR estimation because it offers greater temporal resolution and velocity accuracy in slow flow conditions [13]. To minimize the correlation window duration for reduced WSR bias, we increased eSNR via coded pulse excitation methods.
Coded excitation uses long-duration pulse sequences that have a time-bandwidth product (TBP) greater than one [14], [15]. This feature increases the time-averaged signal energy without increasing the spatial-peak acoustic intensity or mechanical index. Ideally, eSNR gain equals the TBP of the transmitted pulse [16], the filtering applied to received echoes is able to compress the pulse entirely to restore spatial resolution, and there is no loss of frame rate. The challenge to approaching ideal performance is to find combinations of parameters for transmitting pulses and filtering echoes which minimize the distortions that spoil code orthogonality. Incomplete pulse compression generates range side lobes that reduce contrast resolution and yield biased WSR estimates. Ultrasonic-coded excitation techniques have been successfully applied to B-mode [15], [17], flow [18], strain [16], and intravascular ultrasound (IVUS) flow [19] imaging applications. The demands of each application generate unique coding requirements that modify the code type and duration and the compression filter parameters. This paper describes our efforts to optimize coded excitation for broadband WSR estimation. Performance is evaluated in terms of the tradeoff between WSR standard deviation and bias.
II. METHODS
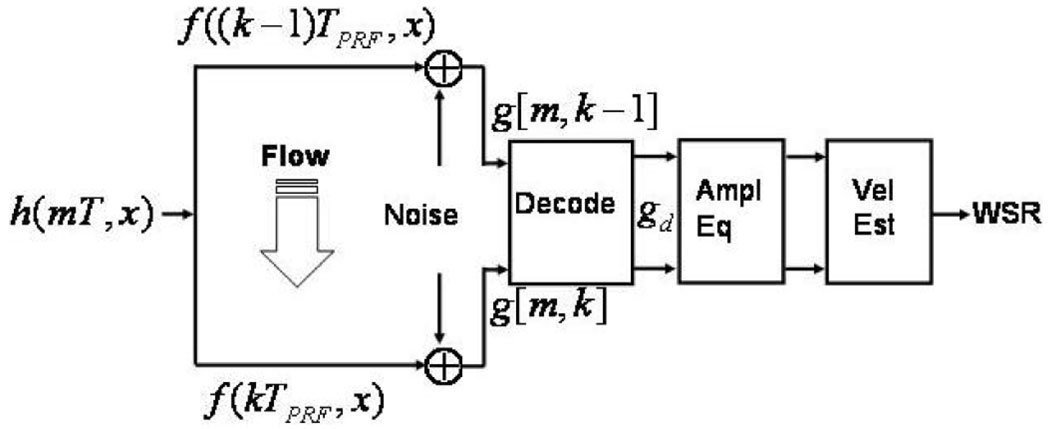
A simple signal model of one spatial dimension is diagrammed in Fig. 2. It was used to simulate ultrasonic echo acquisitions during flow experiments. This model also closely describes our experimental design. Consequently, Fig. 2 serves as an outline of the simulation and experimentation methods for this study.
Fig. 2.
Echo-signal model with flow.
A voltage waveform is applied to the transducer to generate the pulse-echo point spread function of the ultrasound system h. Echo data g are generated through a linear transformation of the object f via h. The echo data from coded transmissions are filtered to decode the pulse sequence and produce gd. The results are amplitude equalized before velocity and WSR are estimated. Each of these processes is described below.
A. Excitation Pulses
The spatiotemporal point spread function of the imaging system is the temporal convolution of the voltage waveform e and the pulse-echo impulse response of the system , in which time is uniformly sampled1 and 0 ≤ m ≤ M − 1. Two types of excitation pulses are included: standard, short-duration, Gabor pulses with TBP = 1, and phase modulated (PM) or frequency modulated (FM) coded pulses with TBP > 1.
1. PM Coded Pulse Sequences
Optimal codes [20] were selected because of their spectral properties and ease of implementation. They are optimal in the sense that they give the flattest spectral response in the bandpass of the transducer [21]. A flat frequency spectrum means that matched or inverse filtering applied for pulse compression (decoding) yields comparable results, thus suppression of side lobes and noise amplification are balanced. Biphasic PM codes are of particular interest because they can be implemented on many clinical systems.
Detector sensitivity is improved at the cost of reduced axial resolution by convolving a binary PM code c[m] with a binary base sequence b[m] [15]. To facilitate this process, biphasic PM codes c[m] are expanded in time by the integer factor S > 1 to match the sampling rate of the pulse generator, . Assume the sampling interval of the pulser and receiver are both T. Then the voltage waveform driving the transducer is the temporal convolution:
| (2) |
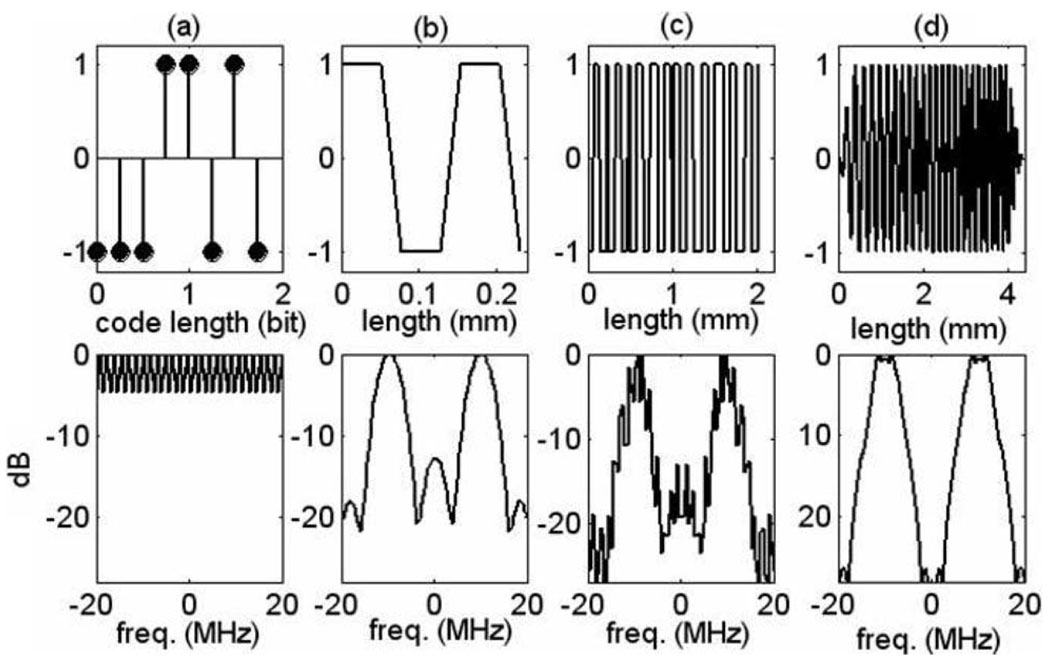
Examples are illustrated in Fig. 3.
Fig. 3.
Coded-pulse examples. Top row shows (a) an eight-bit Optimal code, (b) typical base sequence, (c) their convolution resulting in the excitation voltage waveform, (d) FM coded (chirp) pulse. Bottom row shows the corresponding frequency spectra.
2. FM Chirp Pulses
Unlike PM codes, FM codes require more than binary control of the waveform amplitude [Fig. 3(d)]. We followed the general technique of Misaridis and Jensen [22] to generate a linear FM chirp sampled on the interval T:
| (3) |
where α is the slope of the frequency sweep in megahertz per microseconds, u0 is the center frequency, ∆u is the bandwidth, and wc[m] is a 10% cosine taper window function of duration Tp:
| (4) |
wc is applied to suppress the range side-lobe level of the compressed pulse by 2 dB compared with a rectangular window but with some broadening of the pulse length after matched filtering. Spatial resolution is traded for side-lobe suppression. In our simulations, α = 1.0508 MHz/µs and Tp = 2.855 µs. Pulses were simulated with u0 = 10 MHz, and the fractional bandwidth was 60% so that ∆u/2 = 3 MHz.
B. Echo Signal Generation
The object scattering function f and noise process n are modeled as random functions of space x and slow time ts = kTprf [23]. Both are drawn from wide-sense stationary, white Gaussian noise (WGN) processes, except that the magnitude of f was adjusted spatially to create tissue echoes in simulations that were 25 dB greater in amplitude than the intraluminal blood echoes. Depth-dependent signal losses through 2 cm of tissue were simulated by applying frequency-dependent attenuation β = β0fx, where β0 = 0.5 dB cm−1MHz−1. For each data point reported, 150 statistically independent pairs of echo waveforms (g[m, k − 1] and g[m, k] in Fig. 2) were generated for analysis. Only scatterer movements parallel to the ultrasound beam axis were simulated in this one-dimensional (1-D) model. Axial motion was generated by moving blood scatterers f(x, ts) in x for each ts = kTprf. For discrete x, subsample motion is achieved by spline interpolation. The moving object function at ensemble pulse k can be expressed recursively:
| (5) |
where x′ = x + Δx, ∆x = V(x, (k − 1) Tprf) × Tprf, and V(x, ts) is the x-axis component of scatterer velocity. Scatterer displacement varies with position according to the model adopted for vascular flow.
The mth echo sample recorded from the kth ensemble pulse, g[m, k], is modeled through the continuous-to-discrete integral transformation:
| (6) |
where g[m, k] is the sequence of radio frequency (RF) echo data for a single line of site, m is the index for samples in fast time, and k is the index for the waveform ensemble in slow time. We can simulate narrow band color flow data by increasing the dimensionality, g[m, k, q], where q is the index indicating acquisition of an echo ensemble at lateral position y = q∆y.
Eq. (5) and (6) are related to (1) through V. Assuming a Newtonian fluid is flowing steadily in a long, rigid channel without slipping at the walls, a laminar flow profile is generated with the radial velocity given by [24] :
Therefore, (1) gives:
| (7) |
where Vmax is the spatial peak velocity. For many applications, the minus sign is ignored. The beam axis can be positioned so that the laminar flow limits scatterer motion to the image plane, and thus echo decorrelation is minimal.
Flow parameters for simulations were chosen to match the experiment settings: a 5-mm diameter flow channel with Vmax = 500 mm/s imaged at 72° Doppler angle with PRF = 5 kHz. The true WSR for this simulated data is 400 s−1, which is in the normal range for mean WSR in carotid arteries [25]. As Vmax varies, PRF is adjusted so that VmaxTprf = 0.1.
C. Pulse Compression and eSNR Definitions
We apply a Wiener filter w[m] to echo waveforms g[m, k] to decode (spatially compress) the point spread function [17], i.e., gd[m, k] = ∑m′ w[m − m′] g [m′, k]. If successful, spatial resolution is restored and eSNR is enhanced. The frequency response of the Wiener filter
| (8) |
where C*[ℓ] is the complex conjugate of the discrete Fourier transform of the code sequence c[m] and is a frequency domain representation of the echo SNR described below. The index ℓ is related to the continuous frequency variable u via u = ℓ/MT. Notice that the transmitted voltage waveform e is used to filter FM-coded signals, and the code without the base sequence c is used to filter PM-coded signals. γ is a constant that we set to 0.4 in this study. For low-noise echo waveforms (i.e., when , the first term in the denominator dominates the response and the Wiener filter approximates an inverse filter. Noisy data increases the magnitude of the second term in the denominator such that the Wiener filter is essentially a weighted, matched filter. To understand this weighting, we must define eSNR in the spatial and frequency domains.
1. Spatial Domain
Recall that object scatterers and additive noise are assumed to be zero mean, WGN processes. Consequently eSNR(x) is given by the associated variances and and the shift-varying point spread function (psf) measured after decoding hd [16]:
| (9) |
The eSNR (coded excitation) exceeds eSNR′ (short-duration Gabor pulse) by an amount related to the time-bandwidth product of the code for equal-amplitude pulses. For TBP = 1 pulses, eSNR′ increases with pulse length at the cost of bandwidth. However coding provides the possibility of fixing eSNR′ and bandwidth, then increasing eSNR by lengthening the code as code length is approximately proportional to TBP for most PM codes.
For known component variances, as in simulations, (9) is implemented by placing a point reflector at x. Applying to (6) and ensemble averaging over noise, ɛ{·}n, [16]:
For unknown component variances, as in experiments, we measure the net sample variance of decoded echo signals in a homogeneous scattering region and in a scatterer-free region, then we approximate:
| (10) |
2. Frequency Domain
is the ratio of power spectra for the noise-free echo signal and the noise alone at position x:
| (11) |
Of course, to compute the Fourier transforms, we assume an analysis region exists in signal space where f is wide-sense stationary and hd is shift invariant. Ensemble averages on the far right of (11) are constant over frequency and proportional to the corresponding variances. By summing over frequency and invoking Parseval’s formula, it is easy to show that .
D. Signal Conditioning
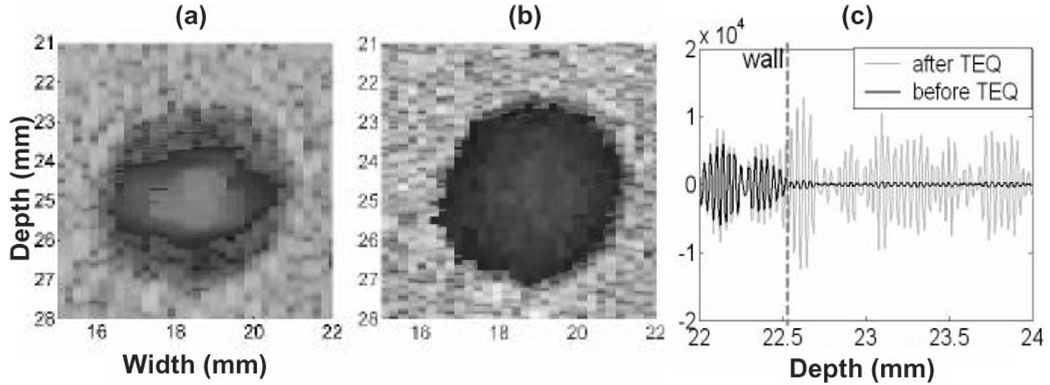
By focusing on time-domain cross correlation (CC) measurements of slow velocity for broadband signals, clutter filters are not applicable. However, velocity estimation is challenged significantly by echo nonstationarity, e.g., when there is a difference in mean echo amplitudes inside and outside the lumen. The problem is that displacements estimated using CC estimators can be unbiased only for wide-sense, stationary, random processes. When the correlation window straddles the vascular wall, displacement estimates are influenced by motion of wall echoes more than motion of blood echoes because of the greater amplitude of wall echoes. This effect appears in the color-flow format of Fig. 4(a) as an apparent loss of the steady flow near the motionless phantom wall.
Fig. 4.
Color flow images from the CC estimator (a) without and (b) with TEQ processing. (c) RF signals before and after TEQ.
To minimize this loss of motion sensitivity, we precondition gd echo signals by equalizing the RF echo intensity across the flow channel. Like depth-gain compensation, tissue equalization (TEQ) applies a spatially varying gain to the echo signal before correlation to equalize signal variance. As shown in Fig. 4(b), much of the low flow is restored. The amplitude distortions from TEQ are acceptable because we are only interested in the signal phase. Furthermore, TEQ does not change eSNR(x). When the bandwidth of the pulse and the PRF are set high enough so that scatterer displacements over the interval Tprf were smaller than the speckle correlation length, TEQ generated no velocity bias.
E. Velocity Estimation
Accurate (low variance) and precise (low bias error) estimates of WSR require that there be minimal velocity variance and bias in the low flow-velocity range. Hoeks et al. [13] showed that CC estimators outperform the commonly used autocorrelators at measurements of low-flow velocity. Because WSR is computed from the derivative of velocity, it is highly sensitive to random errors. We adopted a regularized CC estimation approach that minimizes WSR variance without spatial averaging that would reduce resolution.
Displacements measured in pixels are found by minimizing two signal energy terms in the objective function:
| (12) |
where the cross-correlation function is:
ξ is a constant, and m0 indicates the center sample of the correlation window. The first term depends on the echo data; it is based on the 1-D estimate ϕ̂ that yields minimally biased2 but noisy displacement estimates when a small CC window is applied. The second term is based on conventional color-flow estimates over the vessel lumen to suppress noise from the data. Color-flow estimates are accurate near the center of an artery at which blood velocity is high. So we fit color-flow velocity estimates to a polynomial, subject to the constraint V(r0) = 0, to find dfit [m0, q]. By minimizing the difference between d and dfit, weighted by the constant ξ, we reduce variance at the risk of increasing bias should dfit values be erroneous. In our study, ξ = 0.6.
Velocity estimates V̂ are computed from the unitless displacement estimate d^ using the standard pulsed Doppler equation:
| (13) |
where θ is the Doppler angle. This algorithm is applied only to positions in the lumen near vessel walls. To obtain accurate velocity estimates, most of the flowing scatterers must stay within the ultrasound pulse during the measurement time Tprf. Echo coherence is maintained by carefully adjusting the PRF. And, WSR is calculated from the radial slope of (1) at the channel wall location. When the vessel walls are nonstationary, a tracking method based on a border detection technique and velocity distribution [26] would be implemented to accurately locate the vessel walls.
F. Evaluation Metrics
The WSR estimation performance is evaluated based upon the bias and standard deviation of estimates. Relative percent bias is defined in terms of the ensemble mean of the values estimated and predicted WSR:
| (14) |
where WSR is given by (7). Relative percent standard deviation is found from:
| (15) |
G. Phantom Experiments
An acoustic flow phantom was constructed by forming a 5-mm diameter horizontal cylindrical channel in a graphite-in-gelatin block. The scattering fluid was a water-alcohol solution into which cornstarch particles were suspended at a concentration 3% by weight. The scatterer densities of the fluid and the surrounding gelatin were similar to accommodate the limited voltage resolution of the analog-to-digital converter (eight-bit) on our laboratory ultrasound system. And 60 cm of straight tubing was connected to the inlet of the flow channel to generate steady laminar flow. The fluid had similar density as water but with higher viscosity (density ~ 1 g/cm3, µ > 0.001 Pa·s). Reynold’s number (Re) of the flow at room temperature was much smaller than the limit for laminar flow (Re < 2000) for the 5-mm diameter flow channel with an average velocity of 100 mm/s [24]. There was a small change in flow impedance at the connector in which the tube joined the gelatin block. Nevertheless, we observed that laminar flow was fully re-established provided that measurements were made at least 30-mm downstream from the connector. A perfusion pump supplied a known steady flow. The Doppler angle was adjusted to 72°, the limit of the goniometer, the PRF was 1 kHz, and RF echo sampling rate (1/T) was 125 Msamples/s. We examined steady flows in which the spatial peak velocities (WSRs) were 100 mm/s (80 s−1) and 200 mm/s (160 s−1). The values of VmaxTprf were 0.1 and 0.2, and thus consistent with values used in simulation.
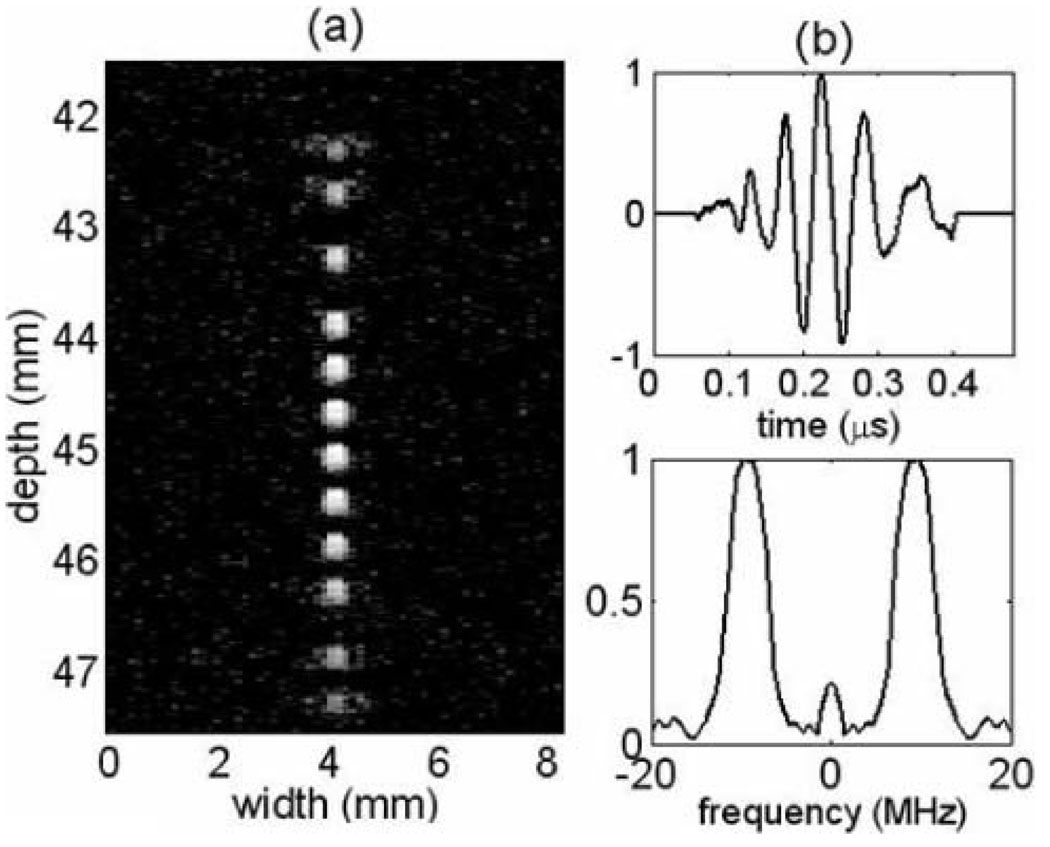
The lab-based imaging system consisted of a 10 MHz (60% bandwidth), 30-mm diameter, f/1.5, circular aperture, spherically focused transducer [27] that was mechanically scanned. The depth of focus was very limited and approximately equal to 7.2λ(f/No)2 = 2.5 mm. Fig. 5(a) shows measured 2-D point spread functions imaged using a fine line target phantom at multiple depths near the radius of curvature. The axial impulse response hs(t|x) and corresponding frequency spectrum |H(u|x)| are plotted in Fig. 5(b).
Fig. 5.
(a) 2-D (psfs log envelope of the RF echo) for the transducer used in phantom experiments as a function of depth. (b) Axial psfs near the radius of curvature and the corresponding frequency spectrum.
Four types of excitation pulses were applied: one-cycle sinusoid, five-cycle sinusoidal bursts, eight-bit Optimal code convolved with a 1.67 cycle base sequence, and a linear FM chirp. The bandwidths of the base pulse and chirp were approximately equal to the bandwidth of the transducer. For further comparison, the duration of the chirp was adjusted to provide a voltage energy equal to that of the eight-bit Optimal code.
III. RESULTS
A. Echo Simulations
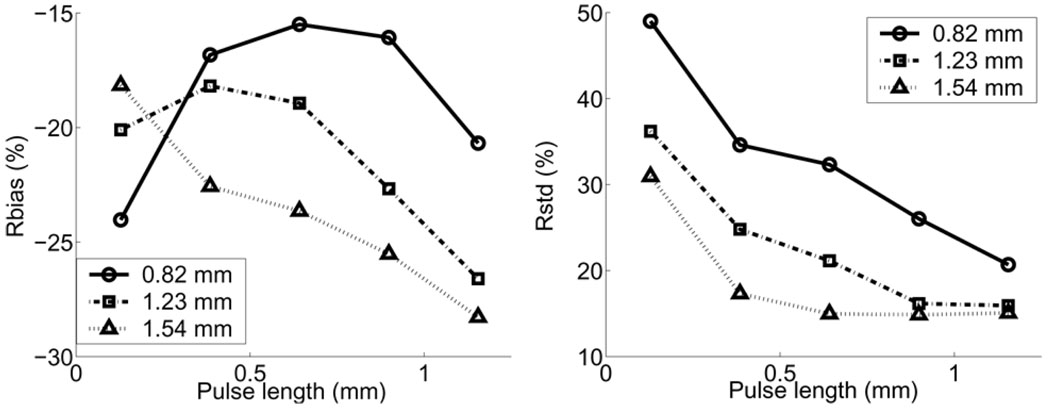
Fig. 6 shows the WSR errors for uncoded pulses estimated from simulated data with different CC window lengths. Values are plotted as a function of uncoded pulse length in which pulse amplitudes are held constant. For pulses longer than 0.5 mm, WSR biases increase and random errors decrease as transmission pulses lengthen. When the axial pulse length is less than 0.5 mm, the eSNR is so low that it is impossible to obtain reliable displacement estimates via cross correlation and, therefore, systematic and random errors both increase significantly. The effect is greater for shorter CC windows. The negative bias is caused by the spatial averaging within the CC window and WSR estimation window.
Fig. 6.
WSR errors for various uncoded pulse lengths and CC window sizes.
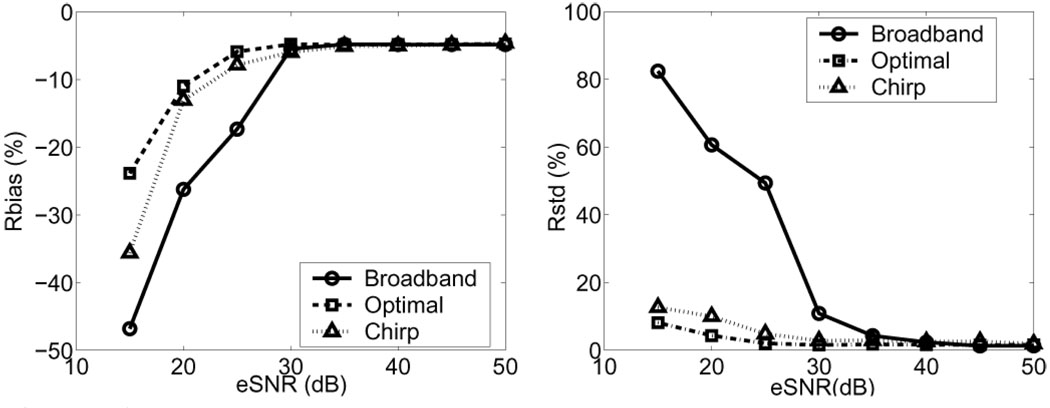
Fig. 7 shows WSR systemic and random errors for three pulse types as a function of eSNR. Other parameters are held constant. Coded pulses reduce WSR errors only for eSNR < 30 dB. Biases converge when eSNR > 30 dB to a value that depends on the particular CC window size and pulse bandwidth selected.
Fig. 7.
WSR errors for an uncoded broadband pulse, FM-coded pulse, and eight-bit Optimal PM-coded pulse versus eSNR. The CC window length is 0.4 mm, and the true WSR was set at 400 s−1. The eSNR axis is computed for the uncoded broadband pulse.
For subsequent simulations, all at 10 MHz, we selected eSNR = 25 dB as a reasonable representation of clinical scanning conditions on carotid arteries. Other values selected for comparison are a one-cycle broadband pulse (~0.1 µs), a five-cycle narrow band pulse (~0.5 µs), a 2.85 µs chirp, and Optimal coded pulses ranging in duration from 3 bits (0.45 µs) to 15 bits (2.25 µs). The amplitudes of all pulses were similar. The voltage waveform energies of the FM chirp and eight-bit Optimal codes were equal, although their lengths were not, i.e., 2.85 µs and 1.2 µs, respectively. The FM pulse, consisting of sinusoids, has a lower energy density than the PM pulse, consisting of square waves. Passing the voltage waveforms through the transducer bandwidth produced acoustic pulses at which the energy of the FM chirp exceeded that of the PM code by 20%.
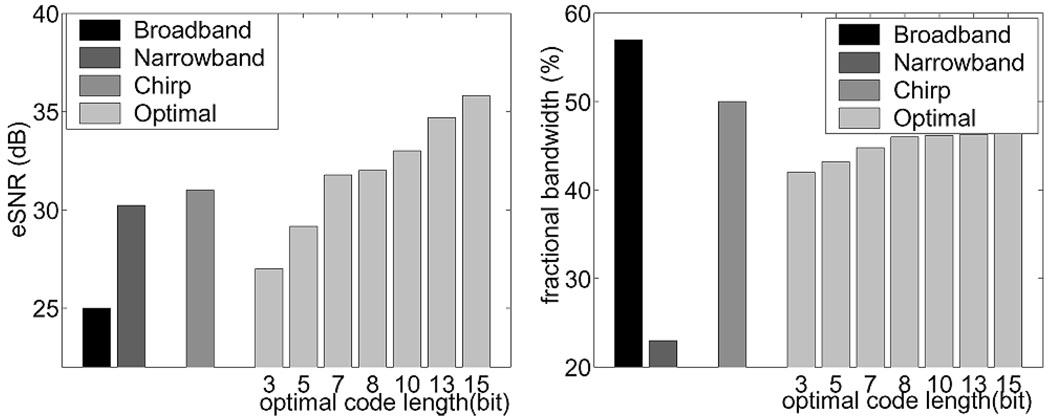
Fig. 8 shows that both types of coded pulses increase eSNR; there is a 6.5 dB gain for the FM chirp pulse over the broadband pulse. The eSNR increases monotonically with PM code length as expected from (9). Longer duration uncoded pulses improve eSNR, but only with a significant loss of bandwidth. The FM code preserves more bandwidth than the PM codes. The bandwidth of the decoded PM pulses increases with code length because Wiener filters in (8) approximate inverse filters at high eSNR with their greater ability to recover bandwidth.
Fig. 8.
(Left) eSNR for a broadband, narrow band, FM-chirp and PM Optimal-coded pulses. (Right) Corresponding fractional bandwidths.
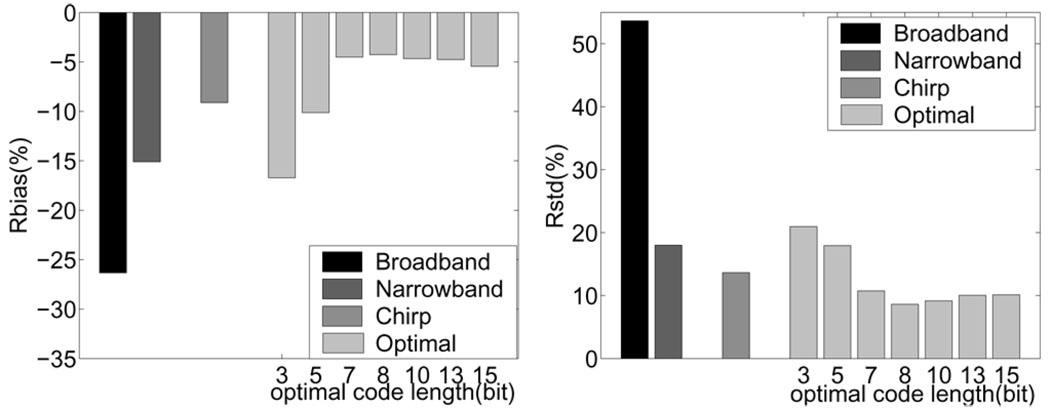
The most important performance metrics for our application are the WSR errors, such as those shown in Fig. 9. Coded pulse excitation effectively reduces Rbias by 9–22% and Rstd by 31–45% compared to the results using uncoded broadband pulses. The eight-bit Optimal code shows the minimal relative errors (Rbias −4% and Rstd 9%) for all the codes considered in this study. In these simulation data, the CC window length was 0.4 mm, eSNR = 25 dB, Vmax = 500 mm/s, and PRF = 5 kHz.
Fig. 9.
WSR errors estimated from simulated echo signals are shown in the forms of (left) Rbais and (right) Rstd.
We also examined the effects of code length and laminar flow WSR on WSR estimation errors (see Fig. 10). The normal atheroprotective physiological value of time-averaged WSS in carotid arteries is approximately 1.6 Pa [25]. From (1), and assuming blood viscosity is 0.004 Pa·s, WSR = 400 s−1. From (7), which is for laminar flow, and assuming a 3-mm lumen diameter, Vmax = 300 mm/s. Conversely, WSS ≤ 0.4 Pa is considered atherogenic. Other parameters being equal, WSR ≤ 100 s−1 and Vmax ≤ 75 mm/s. The physiological effects on the vessel wall of WSS between these values is an open question. We measured WSR errors using simulated echoes under flow conditions when the true WSR values ranged between 100–800 s−1, corresponding to a WSS range of 0.4–3.2 Pa. Other parameters are the same as those in the simulations described above. Fig. 10 shows that WSR errors increase slowly with WSR, and that PM codes near eight bits minimize errors.
Fig. 10.
WSR errors: (left) Rbias and (right) Rstd with increasing flow as a function of code length.
The PM codes longer than eight bits suffer larger WSR errors at high flow velocities despite higher eSNR and bandwidth. Errors increase because flow distorts the pulse code for the received echoes leading to echo decorrelation during displacement estimation, (12). We measured the correlation coefficient between echoes gd(m, k − 1, q) and gd(m, k, q) over a 0.4 mm CC window. The results are summarized in Fig. 11. When there is no flow, VmaxTprf = 0, decorrelation is due to noise, including quantization and computational roundoff errors. As shown in Fig. 11 (left), both FM and PM coded pulses show higher signal correlation than that of the uncoded broadband pulse when eSNR = 25 dB. The signals slowly decorrelate as flow velocity increases (larger VmaxTprf). The same phenomenon also can be observed in Fig. 11 (right). The eight-bit PM code achieves maximum correlation under most of the simulated flow conditions in which VmaxTprf < 0.2. However, the five bit Optimal code reaches the maximum correlation while flow velocity is high (VmaxTprf = 0.2). Shorter codes are limited by noise, and longer codes are limited by decorrelation from range side lobes that appear with greater code distortion.
Fig. 11.
(Left) Echo correlation coefficient versus flow velocities normalized by the pulse-repetition frequency (PRF) = 5 kHz. (Right) Correlation coefficients versus PM code length.
B. Phantom Experiments
1. Point Spread Functions
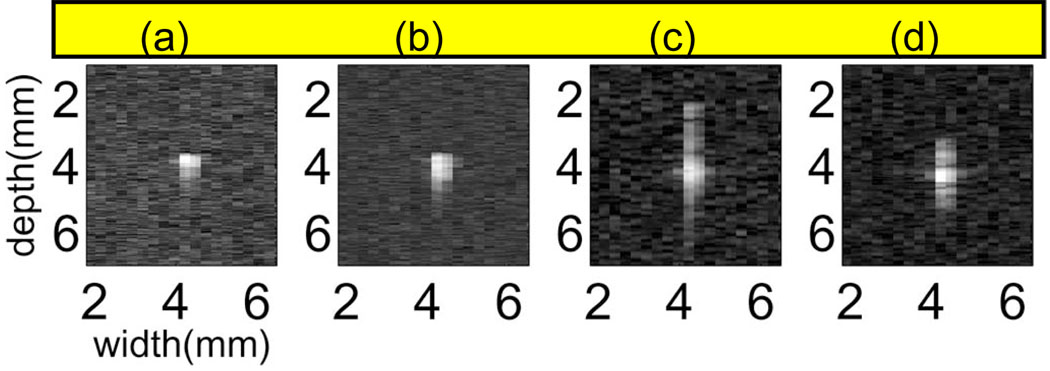
Fig. 12 shows psf images measured from our lab system for the four pulse types: broadband, narrow band, FM chirp, and eight-bit PM Optimal code. Amplitudes have been normalized and log compressed to emphasize the presence of side lobes. Broadband pulses are most compact, having the highest bandwidth and lowest amplitude side lobes. The chirp pulse we adopted has more widely spread, higher amplitude range lobes than the Optimal code. The lateral pulse dimension is about the same for all pulses.
Fig. 12.
Envelope of the psfs for (a) broadband, (b) narrow band, (c) chirp, and (d) eight-bit Optimal coded pulses after matched filtering.
Matched filter decoding yields the highest eSNR at the cost of smaller bandwidth and higher range lobes. Wiener filters can balance the growth of range lobes and bandwidth but yield lower eSNR. Lower eSNR is observed from flow phantom measurements in Fig. 13 for both coded signals when using a Wiener filter instead of a matched filter. Also, range lobes from the FM and PM pulses decrease from −12.5 dB to −22 dB and −17 dB to −25 dB using a Wiener filter in place of a matched filter. A 40% reduction in the main lobe width (improved lateral resolution) for both coded pulses was observed for the Wiener filter relative to the matched filter.
Fig. 13.
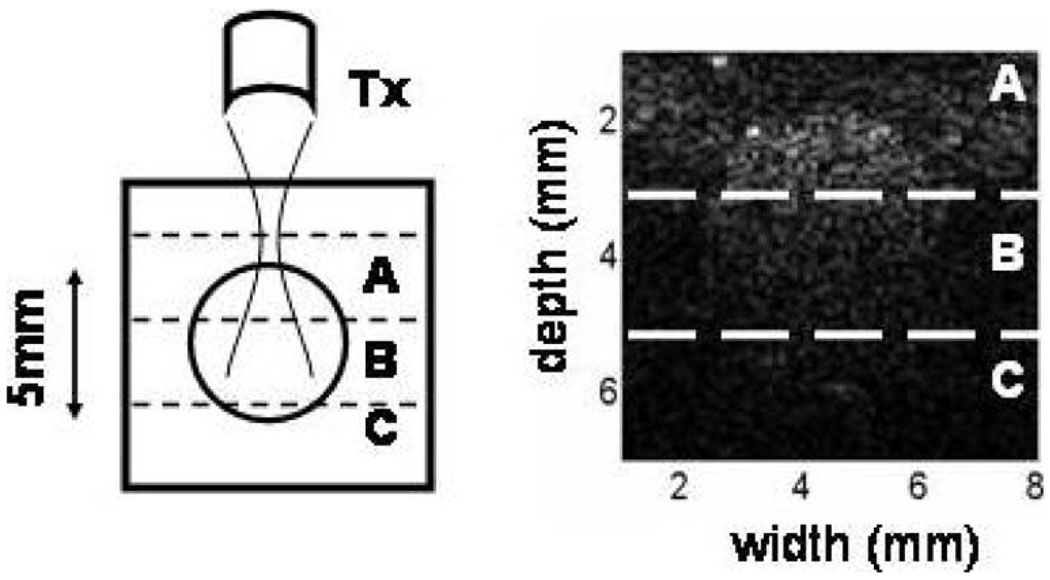
(Right) B-mode image of a cross section of a flow phantom. eSNR was measured at three phantom depths (left): A (centered on focal length F = 45 mm), B (F + 2 mm), and C (F + 4 mm)
2. Flow Experiment Results
Fig. 13 shows a B-mode image across the phantom flow channel. The mid-point depth of section A is at the focal length of the 10 MHz, f/1.5 aperture. It is also near the anterior wall of the echogenic flow channel. Sections B and C are in the far field of the focused transducer. Table II shows estimates of eSNR for the three sections. eSNR is greatest for all pulses in the focal region, decreasing with depth, but more slowly with coded pulses.
TABLE II.
eSNR measured from the flow phantom with different acoustic pulses and decoding methods.1
| Broad- band |
Narrow- band |
Chirp | Optimal 8bit | |||
|---|---|---|---|---|---|---|
| MF | WF | MF | WF | |||
| (A) | 1.43 | 6.05 | 12.26 | 10.47 | 11.93 | 10.25 |
| (B) | 0.88 | 2.25 | 10.94 | 7.74 | 10.46 | 7.14 |
| (C) | 0.21 | 0.41 | 3.19 | 2.33 | 2.83 | 2.39 |
Matched filters (MF) and Wiener filters (WF). Regions A, B, and C correspond to those shown in Fig. 13.
We think the reason that eSNR for the FM code is lower than that for the PM code in simulation and higher in the experiment is related to the dual characteristics of the Wiener filter. The eSNR was set to 25 dB for the echo simulations and was less than 2 dB for the lab system echo recordings. In low eSNR conditions, the Wiener filter responds like a matched filter, which enhances eSNR for the FM chirp. However, in high eSNR conditions, the Wiener filter responds more like an inverse filter, which is less efficient at decoding chirp pulses and thus yields a diminished eSNR.
3. WSR Errors
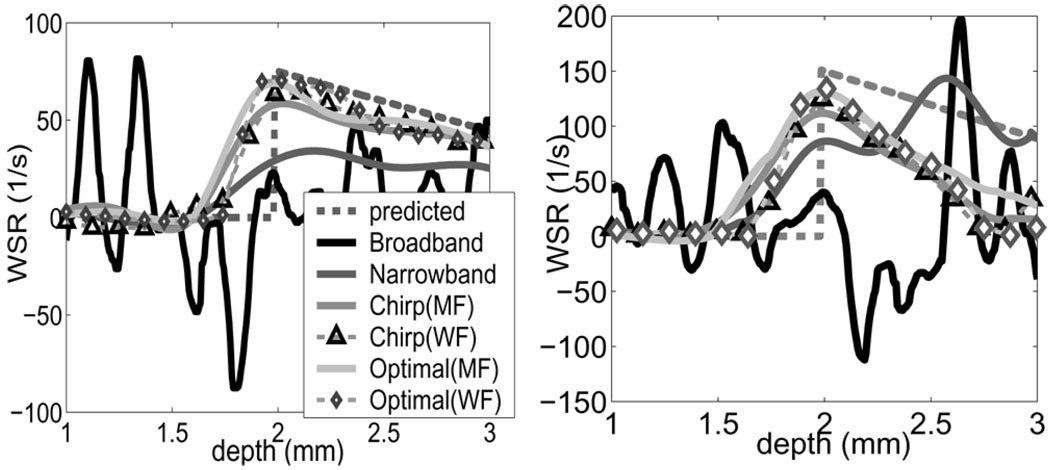
The WSR was measured experimentally at the proximal wall along the center line of the flow channel in a 2-mm range near the aperture focal length (Fig. 14). Results using matched filters and Wiener filters to decoded echoes are shown. The corresponding WSR error estimates are listed in Table III. Broadband pulses generate the largest errors due to low eSNR. The improvements using narrow band and coded pulses follow the same trends observed in the simulations. Wiener filters outperformed matched filters by suppressing additional 2–8% in WSR bias but at the cost of increased random error (4–5%).
Fig. 14.
Shear rate measurements in flow phantom with steady laminar flow. Four pulses and two compression filters are examined at two peak flow velocities (left) Vmax=100 and (Right) 200 mm/s).
TABLE III.
WSR errors measured from flow phantom experiments.1
| Broad- band |
Narrow- band |
Chirp | Optimal 8bit | |||
|---|---|---|---|---|---|---|
| MF | WF | MF | WF | |||
| (a) Rbias (%) | −65 | −42 | −18 | −12 | −9 | −7 |
| Rstd (%) | 58 | 34 | 10 | 14 | 8 | 13 |
| (b) Rbias (%) | −67 | −43 | −25 | −17 | −13 | −11 |
| Rstd (%) | 57 | 36 | 15 | 20 | 10 | 16 |
Maximum flow velocities were (a) 100 m/s and (b) 200 m/s.
IV. DISCUSSION
Coded excitation improves eSNR without a significant loss of spatial resolution. In a noise-limited situation, specifically when eSNR < 30 dB, coded-pulse excitation provides a significant reduction in velocity errors and, therefore, WSR errors. Although the selection of transmission bandwidth, carrier frequency, PRF, code type, and code length depend on flow conditions, the criteria for selecting these parameters is straightforward. Select codes with the highest energy density per wavelength that are relatively insensitive to code distortions caused by scatterer motion and echo noise. Binary PM codes satisfy these criteria for our application. Then select a broadband transducer with a carrier frequency that gives a broadband-pulse eSNR between 15 and 25 dB to maximize spatial resolution within the high-performance eSNR range of the code. Increase the code length to boost eSNR until WSR errors are minimum and further increases in code length decorrelate echoes. The eSNR of the decoded echoes must be high to minimize the duration of the CC window that dominates spatial resolution for the velocity estimator of (12). These conditions are very different from those of typical color flow imaging; a narrow-band, color-flow acquisition followed by a broadband WSR acquisition, both synchronous with the ECG waveform of the patient, provide a more complete description of flow mechanics.
Random velocity errors were found to be further suppressed using the regularized velocity estimator of (12). In the simple, steady, laminar flow simulations and experiments of the current study, the flow profile was a quadratic function of lumenal radius, and the choice of dfit in (12) was obvious. Physiological imaging is neither steady nor laminar, although the color flow image is a good estimate of flow near the lumen center. We propose to fit a polynomial function to the color flow profile and assume nonslip boundary conditions to estimate dfit in vivo. Sequential color flow-WSR acquisitions make this possible.
V. CONCLUSIONS
Using the methods described at the beginning of Section IV, we achieved significant reductions in WSS errors for a simple flow geometry. The literature does not yet show us how the errors in WSR (and therefore WSS) affect descriptions of vascular EC function. So we cannot predict how effective ultrasonic WSS measurements can be at predicting EC function until it is known how much of a change in WSS is required to alter the EC inflammatory response, specifically, changes in adhesion molecule expression. Nevertheless, our methods have the potential to allow study of spatial and temporal variations in WSS on EC function and plaque formation for physiological flow geometries.
Acknowledgments
This work was supported in part by NIH R01 CA82497.
Biographies

Jean K. Tsou received her B.S. degree in chemical engineering from National Taiwan University, Taipei, Taiwan, in 2001. She is currently a Ph.D. student in the Biomedical Engineering Department, University of California, Davis.
Her research interests include atherosclerosis-related endothelial cell function changes with shear flow, microfluidic channel design, mathematical modeling of ultrasonic flow imaging, and medical imaging instrumentation. She is a student member of IEEE.

Jie Liu earned her B.S. and M.S. degrees in biomedical instrument from Taijin University, Tianjin, China, in 1995 and 1997 respectively. She obtained her Ph.D. degree in biomedical engineering at Tsinghua University, Peking, China, in 2001. She was a Senior Research Fellow at the Bioengineering Department, University of Washington, Seattle, from 2001 to 2002. She was a Postdoctoral Researcher of Biomedical Engineering at the University of California, Davis, from 2002 to 2004. She is a visiting research assistant professor of bioengineering at the University of Illinois at Urbana-Champaign since 2005.
Her research interests include developing advanced scientific theories, methods, and research techniques in medical ultrasonic imaging system and evaluating their performances in terms of diagnostic tasks. She is a member of IEEE.
Michael F. Insana received his Ph.D. degree in medical physics from the University of Wisconsin, Madison, in 1983. His dissertation topic was acoustic scattering and absorption in biological tissues. He was a research physicist at the Food and Drug Administration from 1984–1987, where he developed methods for describing tissue microstructure from the statistical properties of echo signals. From 1987–1999 he was with the Department of Radiology at the University of Kansas City, KS Medical Center. Kansas City, KS. There he directed an imaging research lab that applied ultrasonic imaging to the evaluation of progressive renal failure and breast cancer. Between 1999 and 2004 he was a professor of biomedical engineering at the University of California, Davis, where he directed the graduate program. He is currently professor of bioengineering at the University of Illinois at Urbana-Champaign.
His research includes the development of novel ultrasonic instrumentation and methods for imaging soft tissue microstructure, viscoelasticity, and blood flow. The goal is to understand basic mechanisms of tumor formation and responses to therapy. He is also interested in the principles of imaging system design and performance evaluation, signal processing, detection and estimation.
He is a member of the IEEE and ASA, Acoustical Socitey of America (ASA). Fellow of the Institute of Physics, and Associate Editor for IEEE Transaction on Medical Imaging.
Footnotes
RF echo signals are sampled on the time interval T, such that t = mT for integer m. Echo ensembles are acquired on the pulse repetition interval Tprf, such that ts = kTprf. Because Tprf ≫ T, t is called fast-time and ts is slow-time. The pulse repetition frequency PRF = 1/Tprf.
To estimate subsample displacements, either gd is upsampled before correlation or ϕ̂ is interpolated. The former does not bias displacement estimates but the latter does.
Contributor Information
Jean K. Tsou, Email: jktsou@ucdavis.edu, Department of Biomedical Engineering, University of California, Davis, CA 95616.
Jie Liu, Department of Bioengineering, University of Illinois at Urbana-Champaign, Urbana, IL 61801.
Michael F. Insana, Department of Biomedical Engineering, University of California, Davis, CA 95616; Department of Bioengineering, University of Illinois at Urbana-Champaign, Urbana, IL 61801.
REFERENCES
- 1.American Heart Association (AHA) Centers for Disease Control and Prevention/National Center for Health Statistics (CDC/NCHS), Heart Disease and Stroke-Heart Statistics-2004 update. American Heart Association; 2004. [Google Scholar]
- 2.Caro CG, Fitz-Gerald JM, Schroter RC. Atheroma and arterial wall shear: Observation, correlation and proposal of a shear dependent mass transfer mechanism of atherogene-sis. Proc. R. Soc. London (Biol.) 1971;vol. 177:109–159. doi: 10.1098/rspb.1971.0019. [DOI] [PubMed] [Google Scholar]
- 3.Koller A, Kaley G. Endothelial regulation of wall shear stress and blood flow in skeletal muscle microcirculation. Amer. J. Physiol. 1991;vol. 260:H862–H868. doi: 10.1152/ajpheart.1991.260.3.H862. [DOI] [PubMed] [Google Scholar]
- 4.Malek AM, Alper SL, Izumo S. Hemodynamic shear stress and its role in atherosclerosis. JAMA. 1999;vol. 282:2035–2042. doi: 10.1001/jama.282.21.2035. [DOI] [PubMed] [Google Scholar]
- 5.Ku DN, Giddens DP, Zarins CK, Glagov S. Pulsatile flow and atherosclerosis in the human carotid bifurcation. Atherosclerosis. 1985;vol. 5:293–302. doi: 10.1161/01.atv.5.3.293. [DOI] [PubMed] [Google Scholar]
- 6.Hughes PE, How TV. Pulsatile velocity distribution and wall shear rate measurement using pulsed Doppler ultrasound. J. Biomech. 1994;vol. 27:103–110. doi: 10.1016/0021-9290(94)90037-x. [DOI] [PubMed] [Google Scholar]
- 7.Hughes PE, How TV. Quantitative measurement of wall shear rate by pulsed Doppler ultrasound. J. Med. Eng. Technol. 1993;vol. 17:58–64. doi: 10.3109/03091909309008352. [DOI] [PubMed] [Google Scholar]
- 8.Hoeks A, Samijo S, Brands P, Reneman R. Noninvasive determination of shear rate distribution across the arterial lumen. Hypertension. 1995;vol. 26:26–33. doi: 10.1161/01.hyp.26.1.26. [DOI] [PubMed] [Google Scholar]
- 9.Kim H, Hertzberg J, Lanning C, Shandas R. Noninvasive measurement of steady and pulsating velocity profiles and shear rates in arteries using echo PIV: In vitro validation studies. Ann. Biomed. Eng. 2004;vol. 32:1067–1076. doi: 10.1114/b:abme.0000036643.45452.6d. [DOI] [PubMed] [Google Scholar]
- 10.Jayaweera A, Edwards N, Glasheen W, Villanueva F. In vivo myocardial kinetics of air-filled albumin microbubbles during myocardial contrast echocardiography. Circ. Res. 1994;vol. 74:1157–1165. doi: 10.1161/01.res.74.6.1157. [DOI] [PubMed] [Google Scholar]
- 11.Freis E. Studies in hemodynamics and hypertension. Hypertension. 2001;vol. 38:1–5. doi: 10.1161/01.hyp.38.1.1. [DOI] [PubMed] [Google Scholar]
- 12.Zrnic D. Spectral moment estimators from correlated pulse pairs. IEEE Trans. Aerosp. Electron. Syst. 1977;vol. AES-13:344–354. [Google Scholar]
- 13.Hokes APG, Arts TGJ, Brands PJ, Reneman RS. Comparison of the performance of the RF cross-correlation and Doppler autocorrelation technique to estimate the mean velocity of simulated ultrasound signals. Ultrasound Med. Biol. 1993;vol. 19:727–740. doi: 10.1016/0301-5629(93)90090-b. [DOI] [PubMed] [Google Scholar]
- 14.O’Donnell M. Coded excitation system for improving the penetration of real-time phased-array imaging systems. IEEE Trans. Ultrason., Ferroelect., Freq. Contr. 1992;vol. 39:341–351. doi: 10.1109/58.143168. [DOI] [PubMed] [Google Scholar]
- 15.Chiao RY, Hao X. Coded excitation for diagnostic ultrasound: A system developer’s perspective. IEEE Trans. Ultrason., Ferroelect., Freq. Contr. 2005;vol. 52:160–170. doi: 10.1109/tuffc.2005.1406543. [DOI] [PubMed] [Google Scholar]
- 16.Liu J, Insana MF. Coded pulse excitation for ultrasonic strain imaging. IEEE Trans. Ultrason., Ferroelect., Freq. Contr. 2005;vol. 52:231–240. doi: 10.1109/tuffc.2005.1406549. [DOI] [PMC free article] [PubMed] [Google Scholar]
- 17.Haider B, Lewin PA, Thomenius KE. Pulse elongation and deconvolution filtering for medical ultrasonic imaging. IEEE Trans. Ultrason., Ferroelect., Freq. Contr. 1998;vol. 45:98–113. doi: 10.1109/58.646915. [DOI] [PubMed] [Google Scholar]
- 18.Pedersen MH, Misaridis TX, Jensen JA. Clinical evaluation of chirp-coded excitation in medical ultrasound. Ultrasound Med. Biol. 2003;vol. 29:895–905. doi: 10.1016/s0301-5629(02)00784-6. [DOI] [PubMed] [Google Scholar]
- 19.Wang Y, Metzger K, Stephens DN, Williams G, Brownlie S, O’Donnell M. Coded EXcitation with Spectrum Inversion (CEXSI) for ultrasound array imaging. IEEE Trans. Ultrason., Ferroelect., Freq., Control. 2003;vol. 50:805–823. doi: 10.1109/tuffc.2003.1214501. [DOI] [PubMed] [Google Scholar]
- 20.Ruprecht J, Rupf M. On the search for good aperiodic binary invertible sequences. IEEE Trans. Inform. Theory. 1996;vol. 42:1604–1612. [Google Scholar]
- 21.Skolnik M. Radar Handbook. 2nd ed. New York: McGraw-Hill; 1990. [Google Scholar]
- 22.Misaridis TX, Jensen JA. An effective coded excitation scheme based on a predistorted FM signal and an optimized digital filter. Proc. IEEE Ultrason. Symp.; 1999. pp. 1589–1593. [Google Scholar]
- 23.Liu J, Abbey CK, Insana MF. Linear approach to axial resolution in elasticity imaging. IEEE Trans. Ultrason., Ferroelect., Freq. Contr. 2004;vol. 51:716–725. [PMC free article] [PubMed] [Google Scholar]
- 24.Jensen JA. Estimation of Blood Velocities Using Ultrasound: A Signal Processing Approach. Cambridge, UK: Cambridge Univ. Press; 1996. [Google Scholar]
- 25.Giddens DP, Zarins CK, Glagov S. The role of fluid mechanics in the localization and detection of atherosclerosis. J. Biomech. Eng. 1993;vol. 115:588–594. doi: 10.1115/1.2895545. [DOI] [PubMed] [Google Scholar]
- 26.Tsou JK, Mai JJ, Lupotti FA, Insana MF. Simultaneous narrow-band ultrasonic strain-flow imaging. Proc. SPIE. 2004;vol. 5373:173–183. [Google Scholar]
- 27.Kargel C, Hoebernreich G, Trummer B, Insana MF. Adaptive clutter rejection filtering in ultrasonic strain-flow imaging. IEEE Trans. Ultrason., Ferroelect., Freq. Contr. 2003;vol. 50:824–835. doi: 10.1109/tuffc.2003.1214502. [DOI] [PMC free article] [PubMed] [Google Scholar]


