Abstract
Purpose
Disease dissemination to the bone marrow is detected at diagnosis in approximately 15% of children with T-cell lymphoblastic lymphoma (T-LL). It is unclear whether the remaining patients have submicroscopic systemic disease and, if so, what is the clinical significance of this finding.
Patients and Methods
Using a flow cytometric method that can detect one T-LL cell among 10,000 normal cells, we examined bone marrow and peripheral-blood samples collected from 99 children with T-LL at diagnosis, as well as blood samples collected from 42 patients during treatment.
Results
In 71 (71.7%) of the 99 marrow samples obtained at diagnosis, T-LL cells represented 0.01% to 31.6% (median, 0.22%) of mononuclear cells; 57 of the 71 T-LL–positive samples were from patients with stage II/III disease. Results of studies in bilateral marrow aspirates were highly concordant. Two-year event-free survival (EFS) was 68.1% ± 11.1% (SE) for patients with ≥ 1% T-LL cells in bone marrow versus 90.7% ± 4.4% for those with lower levels of marrow involvement (P = .031); EFS for patients with ≥ 5% lymphoblasts was 51.9% ± 18.0% (P = .009). T-LL cells were as prevalent in blood as in marrow; monitoring residual T-LL cells in blood during remission induction therapy identified patients with slower disease clearance.
Conclusion
More than two thirds of children with T-LL have disseminated disease at diagnosis, a proportion much higher than previously demonstrated. Measurements of disease dissemination at diagnosis might provide useful prognostic information, which can be further refined by monitoring response to therapy through blood testing.
INTRODUCTION
Lymphoblastic lymphoma represents approximately one third of childhood non-Hodgkin's lymphomas.1,2 In most cases, lymphoma cells express markers associated with thymic differentiation, including T-cell markers and terminal deoxynucleotidyl transferase (TdT),3–5 hence the classification of T-cell lymphoblastic lymphoma (T-LL). Because cell marker expression overlaps that of T-lineage acute lymphoblastic leukemia (T-ALL), the clinical distinction between the two entities is arbitrarily determined by the degree of bone marrow involvement: patients with more than 25% lymphoblasts are classified as having T-ALL, whereas those with a lesser degree of marrow replacement or no detectable lymphoblasts are classified as having T-LL.6 More than 80% of patients with T-LL do not have marrow involvement at diagnosis by morphologic examination of bilateral marrow aspirates and biopsies.1,7,8 However, distinguishing lymphoma cells from normal lymphocytes and lymphoid progenitors is difficult, and the true extent of disease dissemination in patients with T-LL is unclear.
It might be possible to detect submicroscopic disseminated disease in patients with T-LL with molecular methods used for minimal residual disease (MRD) monitoring in T-ALL, such as polymerase chain reaction (PCR) amplification of genetic abnormalities and clonal T-cell receptor (TCR) gene rearrangements.9,10 Indeed, in a proportion of T-LL cases, lymphoblasts express gene fusions suitable for PCR analysis,11 and most cases should have clonal TCR rearrangements.12 However, these methods require the identification of a clone-specific molecular target in each case through the initial analysis of tumor cells, which are often unavailable owing to the small size of the sample typically obtained from the primary tumor mass.
The characteristic immunophenotype of T-LL cells with coexpression of T-cell markers and TdT is not found among normal bone marrow and peripheral-blood cells,13,14–18 and has been used to monitor MRD in patients with T-ALL.19–24 Therefore, it should be possible to identify circulating lymphoma cells by this phenotype. In this study, we applied this approach to determine the extent of bone marrow involvement at diagnosis in patients with T-LL and assess the feasibility of monitoring treatment response using peripheral blood.
PATIENTS AND METHODS
Patients, Samples, and Treatment Protocol
Bone marrow and peripheral-blood samples (n = 411), collected in preservative-free heparin, were obtained at diagnosis and/or during remission induction therapy from 112 patients (median age, 11.0 years; range, 1.4 to 26.3 years) diagnosed with T-LL and enrolled onto the Children's Oncology Group Study A5971 at 84 institutions and sent via overnight courier to the reference laboratory at St Jude Children's Research Hospital in Memphis, TN. Of the 411 samples, 402 (97.8%; from 111 patients) had sufficient viable cells for flow cytometric studies. The diagnosis of T-LL was established from clinical, histologic, and immunochemistry findings.5 Morphologic assessment of marrow involvement was performed on bilateral aspirates and/or biopsies. We also studied marrow and blood samples of 33 healthy donors and 42 patients with non T-cell acute leukemia in complete remission. These studies were approved by the institutional review boards of the participating institutions, with informed consent obtained from the patients, parents, or guardians.
Patients received remission-induction therapy (vincristine, daunorubicin, prednisone, L-asparaginase, cytarabine), followed by consolidation (cyclophosphamide, cytarabine, mercaptopurine, prednisone), interim maintenance (methotrexate, mercaptopurine), delayed intensification (vincristine, daunorubicin/doxorubicin, L-asparaginase, dexamethasone, cyclophosphamide, cytarabine, thioguanine), and maintenance therapy (vincristine, prednisone, methotrexate, mercaptopurine), with intrathecal methotrexate in all phases of treatment. There was a double randomization for high-dose methotrexate during interim maintenance versus extended intrathecal methotrexate and inclusion versus exclusion of intensification with cyclophosphamide and anthracycline.
Detection of T-LL Cells by Flow Cytometry
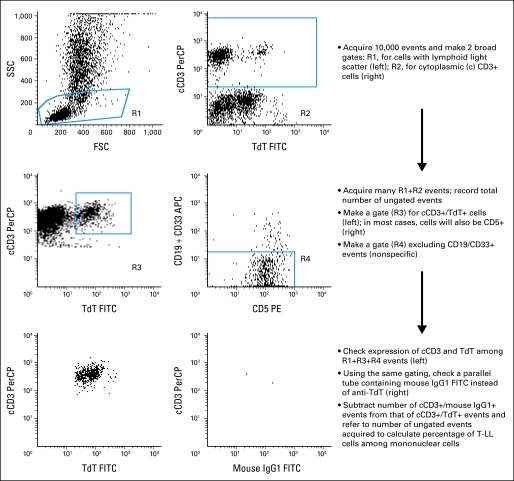
Mononuclear cells, separated on a density step (Accu-Prep, Accurate Chemical, Westbury, NY), were labeled with phycoerythrin-conjugated anti-CD5 (Dako, Carpinteria, CA) and a mixture of allophycocyanin-conjugated anti-CD33 and anti-CD19 (Becton Dickinson, San Jose, CA). After permeabilization with reagent 8E (developed in our laboratory from a proprietary formula), cells were stained with fluorescence isothiocyanate (FITC) -conjugated anti-TdT (Supertechs, Rockville, MD) and peridinin chlorophyll protein–conjugated anti-CD3 (Becton Dickinson). Anti-TdT-FITC was replaced by a FITC-conjugated isotype-matched nonreactive immunoglobulin (Becton Dickinson) in control tubes. In selected tests, we used 9-color staining including the following antibodies: anti-CD34-FITC, anti-CD3-peridinin chlorophyll protein (cytoplasmic), anti-CD19- and anti-CD33-allophycocyanin, anti-CD5-PECy7, anti-HLA-Dr-APCCy7, anti-CD4-Pacific Blue, anti-CD8-AmCyan, anti-CD3-Alexafluor 700 (surface; all from Becton Dickinson), and anti-CD1a- (Beckman Coulter, Miami, FL) or anti-CD99-phycoerythrin (Becton Dickinson). Cells (2 to 5 × 10⁵ in each sample) were analyzed with dual-laser FACSCalibur or three laser LSR II flow cytometers (both from Becton Dickinson) using the protocol shown in Appendix Figure A1 (online only).
T-Cell Receptor Clonality Assay
To analyze the clonality of TCR genes, marrow samples from three surface-CD3– T-LL cases were depleted of surface-CD3+ cells with anti-CD3 antibody and Dynabeads (Invitrogen, Carlsbad, CA) to minimize the background caused by the polyclonal TCR rearrangement of normal T cells. We isolated DNA via QIAmp Blood Mini Kit (QIAGEN, Valencia, CA), performed PCR amplification of TCR-β, -γ, and -δ genes,25,26 and ran PCR products on a 3% agarose gel. Prominent TCR delta bands were further examined for specific clonal rearrangements on 6% acrylamide gel via heteroduplex analysis.27
Statistical Analysis
Associations between presenting features and presence of T-LL cells by flow cytometry were analyzed with the χ2 or the Fisher's exact test. We used the log-rank test to compare Kaplan-Meier estimates of event-free survival (EFS) and overall survival (OS) (follow-up observations to August 2008), and estimated cumulative incidence of any relapse according to Kalbfleisch and Prentice.28 A multivariate proportional hazards regression analysis including all presenting features shown in Table 1 was performed to identify prognostic factors affecting EFS and OS. Patients with bone marrow involvement (≥ 5% T-LL cells by morphologic analysis of bone marrow aspirates and/or focal infiltration by histologic analysis of bone marrow biopsies) and/or CNS involvement were classified as having stage IV disease. The relation between percentages of T-LL cells in bilateral marrow aspirates and in paired marrow and in blood samples was analyzed by the Spearman's rank correlation test. All reported P values were two-sided.
Table 1.
Relationship Between T-LL Cells Detected by Flow Cytometry in Bone Marrow at Diagnosis and Other Presenting Features
| Presenting Feature | Negative, < 0.01% (n = 28) | Positive (n = 71) |
P* | ||
|---|---|---|---|---|---|
| 0.01%-< 0.1% (n = 28) | 0.1%-< 1% (n = 17) | ≥ 1% (n = 26) | |||
| Age, years | .046 | ||||
| < 10 | 8 | 20 | 5 | 11 | |
| ≥ 10 | 20 | 8 | 12 | 15 | |
| Sex | .14 | ||||
| Female | 9 | 6 | 3 | 4 | |
| Male | 19 | 22 | 14 | 22 | |
| Race | .71 | ||||
| White | 22 | 24 | 12 | 15 | |
| Black | 4 | 1 | 2 | 8 | |
| Other | 2 | 3 | 3 | 3 | |
| LDH, U/L | .0027 | ||||
| < 2× upper limit† | 8 | 14 | 11 | 19 | |
| > 2× upper limit | 20 | 14 | 6 | 7 | |
| Corticosteroids before test‡ | .46 | ||||
| No | 8 | 8 | 5 | 9 | |
| Yes | 17 | 15 | 8 | 9 | |
| CNS involvement‡ | .72 | ||||
| No | 24 | 28 | 17 | 21 | |
| Yes | 2 | 0 | 0 | 4 | |
| Mediastinal involvement | .60 | ||||
| No | 5 | 4 | 4 | 9 | |
| Yes | 23 | 24 | 13 | 17 | |
| Stage§ | .060‖ | ||||
| II | 1 | 0 | 1 | 1 | |
| III | 26 | 26 | 14 | 15 | |
| IV | 1 | 2 | 2 | 10 | |
| Two-year EFS, % | |||||
| Mean | 85.0 | 92.9 | 93.3 | 68.1 | |
| SE | 9.9 | 5.9 | 7.3 | 11.1 | |
| Type of event | |||||
| Relapse in primary site only | |||||
| No. of events | 3 | 1 | 0 | 0 | |
| Months from diagnosis | 4, 7, 18 | 3 | |||
| Hematologic relapse | |||||
| No. of events | 0 | 0 | 2 | 5 | |
| Months from diagnosis | 8, 31 | 1,¶ 2, 9, 10, 17 | |||
| CNS or testicular relapse | |||||
| No. of events | 0 | 0 | 0 | 2 | |
| Months from diagnosis | 4, 21 | ||||
| Death in remission | |||||
| No. of events | 0 | 1 | 0 | 0 | |
| Months from diagnosis | 5 | ||||
Abbreviations: T-LL, T-cell lymphoblastic lymphoma; LDH, lactate dehydrogenase; EFS, event-free survival.
P values were obtained by the χ2 test or the Fisher's exact test for the association between each presenting feature and T-LL cells (positive v negative).
2× upper limit of LDH value obtained at each institution was used as a cut-off.
Data not available for all patients.
As determined by the morphologic examination of bone marrow aspirates (≥ 5% cells with T-LL morphology indicates bone marrow involvement) and of bilateral biopsies.
P value for the association between stages II-III and stage IV and T-LL cells (positive v negative).
Refractory disease.
RESULTS
Validation of the T-LL–Specific Immunophenotype
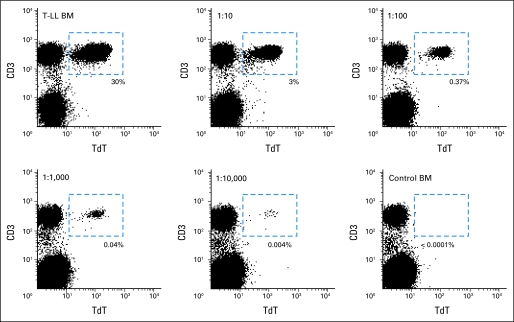
To test the specificity of the flow cytometric assay for T-LL cells, we examined 47 marrow and 28 blood samples collected from healthy donors (n = 33) and patients with non-T cell leukemia in remission (n = 42), including marrow samples with hematopoietic regeneration and numerous hematogones. Mononuclear cells expressing the T-LL phenotype were consistently absent in these samples. To test the sensitivity of the assay, we mixed various proportions of marrow cells from a patient with T-LL (containing 30% T-LL lymphoblasts by flow cytometry) and marrow cells from a healthy donor. T-LL cells were clearly detected in 1:10,000 mixtures, when T-LL cells represented 0.003% of the mononuclear cell population (Appendix Fig A2, online only). Considering that less than 2 × 10⁵ mononuclear cells might be available for analysis in clinical samples and that at least 10 to 20 target cells are required for reliable flow cytometric analysis, we set the threshold sensitivity of the assay to 0.01%.
Detection of Disease Dissemination in Bone Marrow Samples of Patients With T-LL at Diagnosis
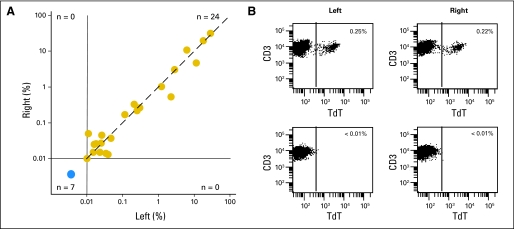
We detected cells expressing the T-LL immunophenotype in the marrow aspirate of 71 (71.7%) of 99 patients with newly diagnosed T-LL, ranging from 0.01% to 31.6% (median, 0.22%). Percentages of T-LL cells in paired bilateral aspirates, available in 31 of the 99 patients, were highly concordant: ≥ 0.01% of T-LL cells were detected in both aspirates in 24 pairs, whereas no T-LL cells were present in the remaining seven pairs (r = 0.9566; P < .0001; Fig 1).
Fig 1.
Detection of T-cell lymphoblastic lymphoma (T-LL) cells by flow cytometry in bilateral aspirates. (A) Relation between percentage of T-LL cells detected by flow cytometry in paired aspirates from left and right iliac crest (r = 0.9566; P < .0001 by Spearman's rank correlation). The dashed line indicates the line of identity. (B) Flow cytometric dot plots illustrate findings in two representative pairs of bone marrow aspirates, one with TLL cells (top panels) and the other with no detectable disease (bottom panels). Percentage of terminal deoxynucleotidyl transferase (TdT)+ CD3+ cells among bone marrow mononuclear cells is shown.
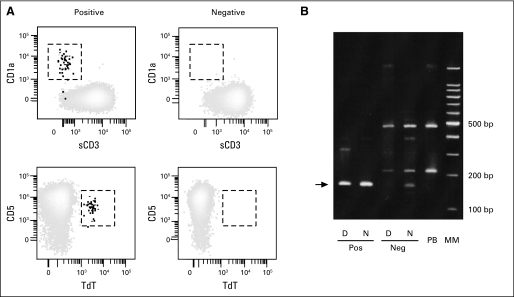
In 28 of the 99 patients, no T-LL cells were detected. To address the possibility of false-negative results caused by lack of TdT, CD3, or CD5 expression in T-LL cells, we examined the results of the immunohistologic analysis of primary tumor samples, available for 60 of the 99 patients (including 16 of the 28 flow cytometry–negative cases). In all 60 patients, T-LL cells expressed CD3 and/or CD5, and in 58 patients, (96.7%) T-LL cells expressed TdT. Of the two cases deemed to be TdT negative in the primary tumor, one had TdT-positive T-LL cells clearly detectable in marrow and blood by flow cytometry, a discrepancy likely due to the lower sensitivity of immunohistology. Because circulating TdT+ CD3+ cells were undetectable in the other case, we used a nine-marker flow cytometric assay (which does not rely on TdT expression) to reexamine the marrow of this patient and that of nine other patients whose primary tumor had not been studied for TdT expression. This methodology, however, also showed absence of T-LL cells (Appendix Fig A3A, online only). Thus false-negative results owing to lack of expression of the targeted cell marker profile are highly unlikely.
To further validate the results of the assay, we searched for clonal TCR gene rearrangements in three marrow samples (morphologically negative). One had 1.3% T-LL cells by flow cytometry, whereas the other two were negative (< 0.01% T-LL cells). No clonal bands were detected in the latter samples by PCR analysis of TCR-β, -γ, and -δ genes, whereas the flow cytometry–positive sample had a TCR-δ clonal band. Clonality was confirmed by heteroduplex analysis; sequencing indicated the presence of a Ddelta2-N-Ddelta3 clonal rearrangement. The heteroduplex analysis was also performed in one of the two negative samples resulting in no visible clonal bands, confirming the lack of TCR-δ clonal rearrangements (Appendix Fig A3B). These results substantiate the specificity of the flow cytometric assay.
Relation Between Flow Cytometric Detection of T-LL Cells and Presenting Features, Staging, and Treatment Outcome
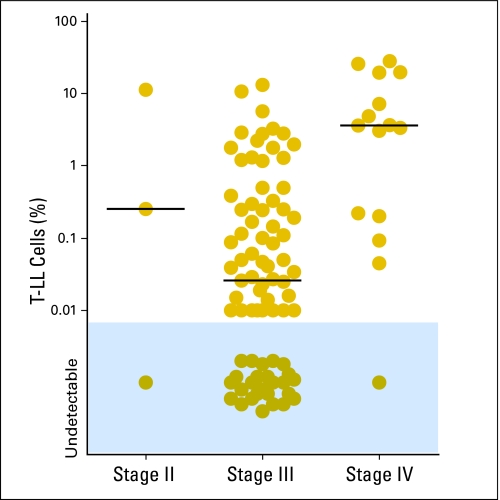
Detection of T-LL cells by flow cytometry was more prevalent among younger patients (< 10 years; P = .046) and, surprisingly, among patients with lower serum lactate dehydrogenase (P = .0027), but was not significantly related to other presenting features, such as sex, race, CNS or mediastinal involvement, or staging (Table 1). However, patients with ≥ 1% marrow T-LL cells had a higher prevalence of CNS involvement (four of six v 21 of 90 with lower levels or no detectable CD3+ TdT+ cells; P = .038) and of stage IV disease (10 of 15 v 16 of 84; P < .001). Five patients with stage IV disease had less than 1% leukemic lymphoblasts by flow cytometry. In two of the five patients, disease was classified as stage IV because of CNS involvement alone with no evidence of marrow involvement by morphology: one of these patients had detectable T-LL cells by flow cytometry in marrow (0.20%), whereas the other did not. Two other patients had a positive marrow biopsy with morphologically negative aspirates; both had T-LL cells detectable by flow cytometry in the aspirate, representing 0.05% and 0.09% of mononuclear cells. Finally, one of the five patients had a negative biopsy but 16% blasts recorded in the aspirate. T-LL cells were also detected in the aspirate by flow cytometry but at much lower levels (0.22%), a result that was confirmed by re-examination of the sample with additional markers. The reason for this apparent discrepancy is unclear. Of the 84 patients with stage II or stage III disease (ie, no bone marrow involvement by morphology), 57 (67.9%) had detectable disease by flow cytometry; 16 of these had ≥ 1% leukemic lymphoblasts (Table 1; Fig 2). Although some patients received a short course of corticosteroids before enrollment and bone marrow aspiration, this was not significantly related to the prevalence of disease dissemination (Table 1).
Fig 2.
Percentage of T-cell lymphoblastic lymphoma (T-LL) cells in bone marrow at diagnosis as detected by flow cytometry according to disease stage based on conventional criteria. Horizontal bars indicate the median value in each group.
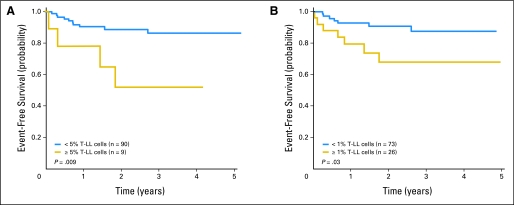
Two-year EFS (± SE) for the 99 patients was 84.6% ± 4.6%. Levels of T-LL cells analyzed as a continuous variable were significantly associated with EFS (P = .026). Two-year EFS was 51.9% ± 18.0% for patients with ≥ 5% T-LL cells by flow cytometry (n = 9) versus 88.7% ± 4.3% for the remaining patients (n = 90; P = .009); using a cutoff level of ≥ 1%, the 2-year EFS was 68.1% ± 11.1% for patients with higher levels of disease dissemination (n = 26) versus 90.7% ± 4.4% for those with lower levels (n = 73; P = .031; Fig 3). The 2-year cumulative incidence of relapse was 48.2% ± 19.3% for patients with ≥ 5% T-LL cells versus 10.1% ± 3.5% for the remaining patients (P = .009), and 31.9% ± 10.6% for those with ≥ 1% lymphoblasts versus 7.9% ± 3.5% for those with lower levels of disease (P = .018). Two-year OS was lower for patients with ≥ 1% lymphoblasts (74.2% ± 10.9% v 92.5% ± 4.0%) and for the subgroup with ≥ 5% lymphoblasts (70.0% ± 19.2% v 89.5% ± 4.1%), but these differences were not statistically significant.
Fig 3.
Event-free survival according to levels of T-cell lymphoblastic lymphoma (T-LL) cells in bone marrow at diagnosis measured by flow cytometry: (A) < 5% and ≥ 5% T-LL cells; (B) < 1% and ≥ 1% T-LL cells.
The 2-year EFS of patients with levels of disease between 0.01% and less than 1% did not differ significantly from that of patients with negative flow cytometric findings (Table 1). However, all nine relapses that involved the bone marrow and/or other nonprimary sites occurred among the 43 patients with ≥ 0.1% T-LL cells; none occurred among the remaining 56 patients with lower levels or no detectable disseminated disease (P < .01). By contrast, all four local relapses occurred in the latter group (Table 1).
Of all other presenting features examined, stage IV disease was significantly associated with a lower EFS, as compared with stage II/III (2-year EFS, 60.3% ± 14.4% v 89.8% ± 4.3%; P = .005). Neither conventional staging nor flow cytometric detection of T-LL cells were significantly associated with EFS in a multivariate proportional hazard regression analysis that included both variables as well as the other presenting features shown in Table 1, probably as a result of the overlap of the two measurements and the low number of events observed.
Disease Dissemination and MRD in Peripheral Blood
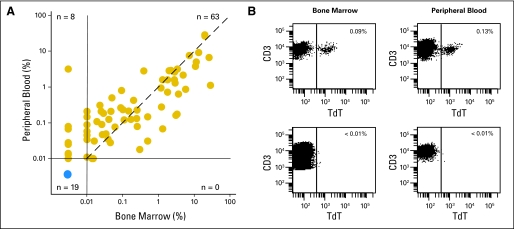
Of the 99 patients studied, 90 patients also had paired blood samples available for flow cytometric studies. Every patient with detectable disease in marrow also had detectable disease in blood (r = 0.8699; P < .0001; Fig 4). Of note, in eight patients, T-LL cells were detectable in blood but not in marrow, suggesting that examination of blood might allow a more sensitive detection of disseminated disease. These results also suggested the possibility of monitoring T-LL cell clearance during therapy by sequential blood testing. We therefore examined 153 blood samples obtained on days 7, 14, 21, and/or 28 of remission-induction therapy from 42 patients with available diagnostic samples. In 32 patients, blood at diagnosis was positive for T-LL cells, and in 10 patients, it was negative. Eleven of the 42 patients had T-LL cells detectable by flow cytometry in one or more of the follow-up samples (Appendix Table A1, online only). None of the 10 patients with no circulating T-LL cells at diagnosis were MRD positive in subsequent tests.
Fig 4.
Detection of T-cell lymphoblastic lymphoma (T-LL) cells in peripheral blood. (A) Relation between percentage of T-LL cells detected by flow cytometry in paired bone marrow and peripheral-blood samples at diagnosis (r = 0.8699; P < .0001 by Spearman's rank correlation). The dashed line indicates the line of identity. (B) Flow cytometric dot plots illustrate findings in two representative marrow/blood paired samples, one with T-LL cells (top panels) and the other with no detectable disease (bottom panels). Percentage of terminal deoxynucleotidyl transferase (TdT)+ CD3+ cells among mononuclear cells is shown.
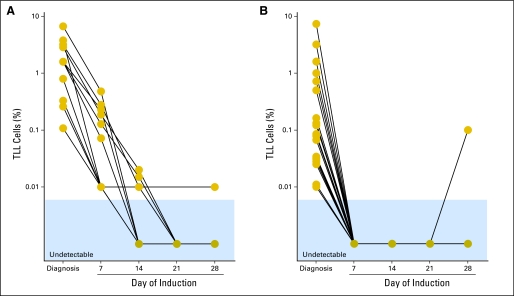
Appendix Figure A4 (online only) shows the kinetics of disease clearance in 30 patients who had circulating T-LL cells at diagnosis and measurements on day 7 of remission-induction therapy. In 11 patients, T-LL cells remained detectable during treatment, whereas in the remaining 19 patients, there was rapid clearance of circulating T-LL cells, which became undetectable on day 7 of therapy (in one patient, MRD reemerged on day 28). This part of the study was designed to determine the prevalence of MRD during remission induction therapy and not its clinical significance (the median follow-up for this 48-patient cohort is less then 2 years). Interestingly, however, the only two patients who had a systemic relapse among the 42 patients studied had detectable T-LL cells during remission induction therapy.
DISCUSSION
We found that more than two thirds of children with T-LL have disseminated disease at diagnosis. The concordant results obtained in bilateral marrow aspirates and the correlation between measurements in paired marrow and blood samples demonstrate that disease dissemination is systemic rather than focal. Whether T-LL and T-ALL represent the spectrum of the same disease or are distinct entities has been a matter of debate.29–31 Our results indicate that most patients with T-LL have a nonlocalized disease that strongly resembles T-ALL.
MRD assays have been applied to study minimal disseminated disease in other types of lymphoma. Disseminated disease could be detected in 12 of 33 patients with Burkitt's lymphoma at diagnosis by PCR amplification of t(8;14)(q24;q32)32; presence of MRD during treatment was associated with a poorer outcome,33 in line with findings in adult patients with t(14;18) B-cell lymphoma.34 Disease dissemination was also detected in 47 of 52 children with anaplastic large-cell lymphoma by PCR amplification of NPM-ALK transcripts, a finding that was correlated with adverse prognosis.35 A flow cytometric method to detect anaplastic large-cell lymphoma cells has been developed, but its clinical significance has not yet been established.36 Systematic studies in T-LL have been lacking, although an earlier study by PCR amplification of TCR genes found evidence of disease in five of seven children.12 Our results provide a definitive demonstration of the high prevalence of disease dissemination in childhood T-LL and indicate that the assay described here, which is at least 100-fold more sensitive than morphology, could replace traditional staging. Because the immunophenotype used to detect T-LL cells is virtually universal for this lymphoma subtype, further characterization of the primary tumor is generally not required. In cases with negative findings, however, we would recommend ensuring that the markers used were expressed in the primary tumor and/or including additional markers such as CD34, CD1a, and CD99 to rule out false-negative results.
Cure rates for patients with T-LL currently approach 90%.37,38 However, contemporary ALL-type intensive therapy carries the risk of serious sequelae.39 Among patients with T-LL, it has been difficult to identify reliable predictors of treatment outcome and apply risk-adapted therapy.7,37,40,41 Although previous studies found no significant differences in treatment outcome between patients with stage III and stage IV disease,37,41 those with stage IV disease in our group had a significantly inferior outcome. If disease dissemination does influence risk of relapse with contemporary therapy, then our results suggest that flow cytometric staging could aid treatment stratification. The flow cytometric test identified patients with high levels of disease dissemination and a higher relapse hazard while requiring only one marrow aspirate (or possibly a blood sample) instead of bilateral aspirates and biopsies. In addition, the test could distinguish patients with and without disease dissemination among those with stage II/III disease, a parameter that, together with MRD measurements in peripheral blood, might become useful for risk assignment in future regimens. We suggest that patients with no detectable disease dissemination at diagnosis and persistentent MRD negativity could be candidates for reduction in treatment intensity. Conversely, patients with persistentent MRD during remission induction therapy should be closely monitored for disease progression and relapse.
Acknowledgment
We thank Patricia Stow for clonality studies; Chris Clark, Laura Key, Peixin Liu, and Mo Mehrpooya for technical assistance; Ching-Hon Pui, MD, for helpful suggestions; and Thomas Gross, MD, the Children's Oncology Group (COG) Non-Hodgkin's Lymphoma committee, and all participating COG institutions for their support.
Appendix
Fig A1.
Representation of the protocol used for flow cytometric analysis in this study. In most cases (85 of the 99 in this series), the proportion of terminal deoxynucleotidyl transferase (TdT)+/CD3+ events also labeled by the CD19/CD33 antibody mixture is low (< 20%) and distinct from the remaining TdT+/CD3+ cells (center right panel); these events are regarded as nonspecific staining and excluded. However, in a minority of cases (14 of 99 in our series), the whole TdT+/CD3+ cell population might be weakly labeled by the CD19/CD33, owing to expression of either of these markers on the T-cell lymphoblastic lymphoma (T-LL) cells. In these cases, such events should not be excluded from the counts. SSC, side scatter; FSC, forward scatter; PerCP, peridin chlorophyll protein; FITC, fluorescence isothyocyanate; PE, phycoerythrin; APC, allophycocyanin; Ig, immunoglobulin.
Fig A2.
Determination of the sensitivity of the flow cytometric method described to detect T-cell lymphoblastic lymphoma (T-LL) cells. A bone marrow (BM) sample from a patient with T-LL containing 30% T-LL cells by flow cytometry (top left panel) was mixed with a bone marrow sample from a healthy individual (bottom right panel) at the ratios indicated. Numbers in italics indicate the percentages of T-LL cells detected by flow cytometry in each test tube. Dash lines enclose the dot plot area occupied exclusively by T-LL cells. TdT, terminal deoxynucleotidyl transferase.
Fig A3.
Validation of results obtained with the flow cytometric assays used in this study. (A) Bone marrow samples previously studied by four-color flow cytometry were reexamined with a nine-color flow cytometric assay. Results obtained in four samples are shown. The results of the nine-color assay confirmed those of the standard assay and showed presence of T-cell lymphoblastic lymphoma (T-LL) cells in two positive samples (left panels) and absence in the two negative samples (right panels). T-LL cells are in the areas enclosed by dashed lines. (B) Heteroduplex analysis of TCRD gene rearrangements in two bone marrow samples, one with T-LL cells (Pos) and the other without T-LL cells (Neg) by flow cytometry, under denaturing (D) and nondenaturing (N) conditions. Results obtained with peripheral blood from a healthy individual (PB) are also shown. The arrow points to the clonally rearranged TCRD band. TdT, terminal deoxynucleotidyl transferase; MM, molecular markers.
Fig A4.
Monitoring of disease clearance during remission induction therapy in peripheral blood. (A) Patients (n = 11) with slow clearance of T-cell lymphoblastic lymphoma (T-LL) cells. (B) Patients (n = 19) with rapid clearance of T-LL cells.
Table A1.
Summary of Follow-Up Studies in Peripheral Blood*
| Day of Induction | Samples Studied | MRD+ | % MRD |
|---|---|---|---|
| 7 | 38 | 10 | 0.07 (range, 0.01-0.48) |
| 14 | 38 | 3 | 0.01, 0.015, 0.02 |
| 21 | 36 | 0 | — |
| 28 | 41 | 2 | 0.01, 0.01 |
Abbreviation: MRD, minimal residual disease.
An additional 21 samples were obtained from six patients for whom diagnostic peripheral blood was not available (day 7, n = 5; day 14, n = 5; day 21, n = 5; day 28, n = 6). All were negative with the exception of one collected on day 7, which had 0.072% T-cell lymphoblastic lymphoma cells.
Footnotes
Supported by Grants No. CA60419, CA21765, and U10-CA98543 from the National Cancer Institute and by the American Lebanese Syrian Associated Charities.
Authors' disclosures of potential conflicts of interest and author contributions are found at the end of this article.
Clinical Trials repository link available on JCO.org.
Clinical trial information can be found for the following: NCT00004228.
AUTHORS' DISCLOSURES OF POTENTIAL CONFLICTS OF INTEREST
The author(s) indicated no potential conflicts of interest.
AUTHOR CONTRIBUTIONS
Conception and design: Elaine Coustan-Smith, Dario Campana
Provision of study materials or patients: Minnie Abromowitch
Collection and assembly of data: Elaine Coustan-Smith, John T. Sandlund, Sherrie L. Perkins, Myron Chang, Minnie Abromowitch, Dario Campana
Data analysis and interpretation: Elaine Coustan-Smith, John T. Sandlund, Sherrie L. Perkins, Helen Chen, Myron Chang, Minnie Abromowitch, Dario Campana
Manuscript writing: Elaine Coustan-Smith, Dario Campana
Final approval of manuscript: Elaine Coustan-Smith, John T. Sandlund, Sherrie L. Perkins, Helen Chen, Myron Chang, Minnie Abromowitch, Dario Campana
REFERENCES
- 1.Sandlund JT, Downing JR, Crist WM. Non-Hodgkin's lymphoma in childhood. N Engl J Med. 1996;334:1238–1248. doi: 10.1056/NEJM199605093341906. [DOI] [PubMed] [Google Scholar]
- 2.Cairo MS, Raetz E, Lim MS, et al. Childhood and adolescent non-Hodgkin lymphoma: New insights in biology and critical challenges for the future. Pediatr Blood Cancer. 2005;45:753–769. doi: 10.1002/pbc.20342. [DOI] [PubMed] [Google Scholar]
- 3.Donlon JA, Jaffe ES, Braylan RC. Terminal deoxynucleotidyl transferase activity in malignant lymphomas. N Engl J Med. 1977;297:461–464. doi: 10.1056/NEJM197709012970901. [DOI] [PubMed] [Google Scholar]
- 4.Greaves MF, Rao J, Hariri G, et al. Phenotypic heterogeneity and cellular origins of T cell malignancies. Leuk Res. 1981;5:281–299. doi: 10.1016/0145-2126(81)90001-1. [DOI] [PubMed] [Google Scholar]
- 5.Smock KJ, Nelson M, Tripp SR, et al. Characterization of childhood precursor T-lymphoblastic lymphoma by immunophenotyping and fluorescent in situ hybridization: A report from the Children's Oncology Group. Pediatr Blood Cancer. 2008;51:489–494. doi: 10.1002/pbc.21666. [DOI] [PMC free article] [PubMed] [Google Scholar]
- 6.Murphy SB. Classification, staging and end results of treatment of childhood non-Hodgkin's lymphomas: Dissimilarities from lymphomas in adults. Semin Oncol. 1980;7:332–339. [PubMed] [Google Scholar]
- 7.Sullivan MP, Boyett J, Pullen J, et al. Pediatric Oncology Group experience with modified LSA2-L2 therapy in 107 children with non-Hodgkin's lymphoma (Burkitt's lymphoma excluded) Cancer. 1985;55:323–336. doi: 10.1002/1097-0142(19850115)55:2<323::aid-cncr2820550204>3.0.co;2-9. [DOI] [PubMed] [Google Scholar]
- 8.Sandlund JT, Ribeiro R, Lin JS, et al. Factors contributing to the prognostic significance of bone marrow involvement in childhood non-Hodgkin lymphoma. Med Pediatr Oncol. 1994;23:350–353. doi: 10.1002/mpo.2950230406. [DOI] [PubMed] [Google Scholar]
- 9.Szczepański T, Orfao A, van der Velden VH, et al. Minimal residual disease in leukaemia patients. Lancet Oncol. 2001;2:409–417. doi: 10.1016/s1470-2045(00)00418-6. [DOI] [PubMed] [Google Scholar]
- 10.Campana D. Determination of minimal residual disease in leukemia patients. Br J Haematol. 2003;121:823–838. doi: 10.1046/j.1365-2141.2003.04393.x. [DOI] [PubMed] [Google Scholar]
- 11.Lones MA, Heerema NA, Le Beau MM, et al. Chromosome abnormalities in advanced stage lymphoblastic lymphoma of children and adolescents: A report from CCG-E08. Cancer Genet Cytogenet. 2007;172:1–11. doi: 10.1016/j.cancergencyto.2006.07.011. [DOI] [PubMed] [Google Scholar]
- 12.Sabesan V, Cairo MS, Lones MA, et al. Assessment of minimal residual disease in childhood non-Hodgkin lymphoma by polymerase chain reaction using patient-specific primers. J Pediatr Hematol Oncol. 2003;25:109–113. doi: 10.1097/00043426-200302000-00005. [DOI] [PubMed] [Google Scholar]
- 13.Bradstock KF, Janossy G, Pizzolo G, et al. Subpopulations of normal and leukemic human thymocytes: An analysis with the use of monoclonal antibodies. J Natl Cancer Inst. 1980;65:33–42. [PubMed] [Google Scholar]
- 14.Bradstock KF, Kerr A. Immunological detection of covert leukaemic spread in mediastinal T-cell lymphoblastic lymphoma. Leuk Res. 1985;9:905–911. doi: 10.1016/0145-2126(85)90312-1. [DOI] [PubMed] [Google Scholar]
- 15.van Dongen JJ, Breit TM, Adriaansen HJ, et al. Detection of minimal residual disease in acute leukemia by immunological marker analysis and polymerase chain reaction. Leukemia. 1992;6(suppl 1):47–59. [PubMed] [Google Scholar]
- 16.Kung PC, Long JC, McCaffrey RP, et al. Terminal deoxynucleotidyl transferase in the diagnosis of leukemia and malignant lymphoma. Am J Med. 1978;64:788–794. doi: 10.1016/0002-9343(78)90518-1. [DOI] [PubMed] [Google Scholar]
- 17.Braziel RM, Keneklis T, Donlon JA, et al. Terminal deoxynucleotidyl transferase in non-Hodgkin's lymphoma. Am J Clin Pathol. 1983;80:655–659. doi: 10.1093/ajcp/80.5.655. [DOI] [PubMed] [Google Scholar]
- 18.Burkhardt B, Bruch J, Zimmermann M, et al. Loss of heterozygosity on chromosome 6q14-q24 is associated with poor outcome in children and adolescents with T-cell lymphoblastic lymphoma. Leukemia. 2006;20:1422–1429. doi: 10.1038/sj.leu.2404275. [DOI] [PubMed] [Google Scholar]
- 19.Bradstock KF, Janossy G, Tidman N, et al. Immunological monitoring of residual disease in treated thymic acute lymphoblastic leukaemia. Leuk Res. 1981;5:301–309. doi: 10.1016/0145-2126(81)90002-3. [DOI] [PubMed] [Google Scholar]
- 20.Coustan-Smith E, Behm FG, Sanchez J, et al. Immunological detection of minimal residual disease in children with acute lymphoblastic leukaemia. Lancet. 1998;351:550–554. doi: 10.1016/S0140-6736(97)10295-1. [DOI] [PubMed] [Google Scholar]
- 21.Porwit-MacDonald A, Bjorklund E, Lucio P, et al. BIOMED-1 concerted action report: Flow cytometric characterization of CD7+ cell subsets in normal bone marrow as a basis for the diagnosis and follow-up of T cell acute lymphoblastic leukemia (T-ALL) Leukemia. 2000;14:816–825. doi: 10.1038/sj.leu.2401741. [DOI] [PubMed] [Google Scholar]
- 22.Coustan-Smith E, Sancho J, Hancock ML, et al. Use of peripheral blood instead of bone marrow to monitor residual disease in children with acute lymphoblastic leukemia. Blood. 2002;100:2399–2402. doi: 10.1182/blood-2002-04-1130. [DOI] [PubMed] [Google Scholar]
- 23.Krampera M, Vitale A, Vincenzi C, et al. Outcome prediction by immunophenotypic minimal residual disease detection in adult T-cell acute lymphoblastic leukaemia. Br J Haematol. 2003;120:74–79. doi: 10.1046/j.1365-2141.2003.03974.x. [DOI] [PubMed] [Google Scholar]
- 24.Dworzak MN, Froschl G, Printz D, et al. CD99 expression in T-lineage ALL: Implications for flow cytometric detection of minimal residual disease. Leukemia. 2004;18:703–708. doi: 10.1038/sj.leu.2403303. [DOI] [PubMed] [Google Scholar]
- 25.Neale GA, Menarguez J, Kitchingman GR, et al. Detection of minimal residual disease in T-cell acute lymphoblastic leukemia using polymerase chain reaction predicts impending relapse. Blood. 1991;78:739–747. [PubMed] [Google Scholar]
- 26.Neale GA, Coustan-Smith E, Stow P, et al. Comparative analysis of flow cytometry and polymerase chain reaction for the detection of minimal residual disease in childhood acute lymphoblastic leukemia. Leukemia. 2004;18:934–938. doi: 10.1038/sj.leu.2403348. [DOI] [PubMed] [Google Scholar]
- 27.Langerak AW, Szczepanski T, van der Burg M, et al. Heteroduplex PCR analysis of rearranged T cell receptor genes for clonality assessment in suspect T cell proliferations. Leukemia. 1997;11:2192–2199. doi: 10.1038/sj.leu.2400887. [DOI] [PubMed] [Google Scholar]
- 28.Kalbfleisch JD, Prentice RL. The Statistical Analysis of Failure Time Data. New York, NY: John Wiley & Sons; 1980. [Google Scholar]
- 29.Jaffe ES, Harris NL, Stein H, et al. Tumours of Haematopoietic and Lymphoid Tissues: World Health Organization Classification of Tumours. Lyon, France: IARC Press; 2001. [Google Scholar]
- 30.Raetz EA, Perkins SL, Bhojwani D, et al. Gene expression profiling reveals intrinsic differences between T-cell acute lymphoblastic leukemia and T-cell lymphoblastic lymphoma. Pediatr Blood Cancer. 2006;47:130–140. doi: 10.1002/pbc.20550. [DOI] [PubMed] [Google Scholar]
- 31.Uyttebroeck A, Vanhentenrijk V, Hagemeijer A, et al. Is there a difference in childhood T-cell acute lymphoblastic leukaemia and T-cell lymphoblastic lymphoma? Leuk Lymphoma. 2007;48:1745–1754. doi: 10.1080/10428190701509772. [DOI] [PubMed] [Google Scholar]
- 32.Mussolin L, Basso K, Pillon M, et al. Prospective analysis of minimal bone marrow infiltration in pediatric Burkitt's lymphomas by long-distance polymerase chain reaction for t(8;14)(q24;q32) Leukemia. 2003;17:585–589. doi: 10.1038/sj.leu.2402828. [DOI] [PubMed] [Google Scholar]
- 33.Mussolin L, Pillon M, Conter V, et al. Prognostic role of minimal residual disease in mature B-cell acute lymphoblastic leukemia of childhood. J Clin Oncol. 2007;25:5254–5261. doi: 10.1200/JCO.2007.11.3159. [DOI] [PubMed] [Google Scholar]
- 34.Gribben JG, Neuberg D, Freedman AS, et al. Detection by polymerase chain reaction of residual cells with the bcl-2 translocation is associated with increased risk of relapse after autologous bone marrow transplantation for B-cell lymphoma. Blood. 1993;81:3449–3457. [PubMed] [Google Scholar]
- 35.Mussolin L, Pillon M, D'Amore ES, et al. Prevalence and clinical implications of bone marrow involvement in pediatric anaplastic large cell lymphoma. Leukemia. 2005;19:1643–1647. doi: 10.1038/sj.leu.2403888. [DOI] [PubMed] [Google Scholar]
- 36.Damm-Welk C, Schieferstein J, Schwalm S, et al. Flow cytometric detection of circulating tumour cells in nucleophosmin/anaplastic lymphoma kinase-positive anaplastic large cell lymphoma: Comparison with quantitative polymerase chain reaction. Br J Haematol. 2007;138:459–466. doi: 10.1111/j.1365-2141.2007.06672.x. [DOI] [PubMed] [Google Scholar]
- 37.Reiter A, Schrappe M, Ludwig WD, et al. Intensive ALL-type therapy without local radiotherapy provides a 90% event-free survival for children with T-cell lymphoblastic lymphoma: A BFM group report. Blood. 2000;95:416–421. [PubMed] [Google Scholar]
- 38.Burkhardt B, Woessmann W, Zimmermann M, et al. Impact of cranial radiotherapy on central nervous system prophylaxis in children and adolescents with central nervous system-negative stage III or IV lymphoblastic lymphoma. J Clin Oncol. 2006;24:491–499. doi: 10.1200/JCO.2005.02.2707. [DOI] [PubMed] [Google Scholar]
- 39.Pui CH, Campana D, Evans WE. Childhood acute lymphoblastic leukemia: Current status and future perspectives. Lancet Oncology. 2001;2:597–607. doi: 10.1016/S1470-2045(01)00516-2. [DOI] [PubMed] [Google Scholar]
- 40.Weinstein HJ, Vance ZB, Jaffe N, et al. Improved prognosis for patients with mediastinal lymphoblastic lymphoma. Blood. 1979;53:687–694. [PubMed] [Google Scholar]
- 41.Patte C, Kalifa C, Flamant F, et al. Results of the LMT81 protocol, a modified LSA2L2 protocol with high dose methotrexate, on 84 children with non-B-cell (lymphoblastic) lymphoma. Med Pediatr Oncol. 1992;20:105–113. doi: 10.1002/mpo.2950200204. [DOI] [PubMed] [Google Scholar]


