

Abstract
For insight into transcriptional mechanisms mediating physiological responses to GH, data mining was performed on a profile of GH-regulated genes induced or inhibited at different times in highly responsive 3T3-F442A adipocytes. Gene set enrichment analysis indicated that GH-regulated genes are enriched in pathways including phosphoinositide and insulin signaling and suggested that suppressor of cytokine signaling 2 (SOCS2) and phosphoinositide 3′ kinase regulatory subunit p85α (Pik3r1) are important targets. Model-based Chinese restaurant clustering identified a group of genes highly regulated by GH at times consistent with its key physiological actions. This cluster included IGF-I, phosphoinositide 3′ kinase p85α, SOCS2, and cytokine-inducible SH2-containing protein. It also contains the most strongly repressed gene in the profile, B cell lymphoma 6 (Bcl6), a transcriptional repressor. Quantitative real-time PCR verified the strong decrease in Bcl6 mRNA after GH treatment and induction of the other genes in the cluster. Transcriptional network analysis of the genes implicated signal transducer and activator of transcription (Stat) 5 as hub regulating the most responsive genes, Igf1, Socs2, Cish, and Bcl6. Transcriptional activation analysis demonstrated that Bcl6 inhibits SOCS2-luciferase and blunts its stimulation by GH. Occupancy of endogenous Bcl6 on SOCS2 DNA decreased after GH treatment, whereas occupancy of Stat5 increased concomitantly. Thus, GH-mediated inhibition of Bcl6 expression may reverse the repression of SOCS2 and facilitate SOCS2 activation by GH. Together these analyses identify Bcl6 as a participant in GH-regulated gene expression and suggest an interplay between the repressor Bcl6 and the activator Stat5 in regulating genes, which contribute to GH responses.
An integrative computational strategy and functional studies reveal the transcriptional repressor Bcl6 as a novel participant in GH-regulated gene expression in adipocytes.
Sequencing of the human genome has provided new tools for addressing long-standing questions regarding transcription regulatory events. Whereas GH has long been recognized as a key regulator of growth and metabolism, new questions continually arise as to how it modulates cellular function. We have made considerable progress in understanding how GH signals through the GH receptor and its associated tyrosine kinase Janus kinase-2 (1,2) and have achieved some knowledge of how GH regulates gene transcription, through analysis of well-studied GH target genes such as those encoding IGF1, C-fos, Spi2.1, Cyp2, and Cyp3 family members (3,4,5,6,7,8,9,10). However, to understand the diverse and complex events that are modulated by GH, it is informative to gain a global perspective of how GH regulates target genes and how they relate to physiological responses to GH.
GH is a major promoter of postnatal longitudinal growth. In addition, GH antagonizes insulin action as part of the coordinated mechanisms by which multiple hormones maintain metabolic homeostasis. In conditions of chronic GH excess, development of insulin resistance and diabetes have long been recognized (11,12,13). The signaling molecule phosphoinositide 3′ kinase (PI3K) has been implicated in GH-induced insulin resistance (14,15), and the gene encoding its regulatory subunit p85 α (PI3K p85α) is induced by GH in adipocytes (15,16). Adipose tissue is one of the most sensitive target tissues for GH and plays a central role in its metabolic actions. In the present study, a profile of GH-regulated genes obtained using GH-treated adipocytes (16) was subjected to deep data mining to gain insight into genes involved in the physiological responses to GH. Through an integrative series of computational analyses, B celllymphoma 6 (Bcl6), a transcriptional repressor, was identified as a new participant in GH-regulated gene transcription. Functional studies support the role of Bcl6 in transcriptional repression of GH-regulated genes.
The gene profile used for analysis was obtained from microarray data sets from 3T3-F442A adipocytes treated with GH for 48 h, a time when GH induces insulin resistance, or for 4 h or 30 min for insight into triggering events. Genes were induced or inhibited by GH in time-dependent waves associated with biological processes regulated by GH. Expression of genes involved in transcription regulation was induced at 30 min, and expression of genes associated with lipid and cholesterol biosynthesis was inhibited at later times tested (48 h) (16). The present analysis used the gene data sets to assess physiological pathways in which the GH-regulated genes are enriched and to identify key regulatory genes, with results pinpointing the genes for suppressor of cytokine signaling 2 (SOCS2) and PI3K p85a. Clustering using the model-based Chinese restaurant clustering (CRC) algorithm identified the same genes in a cluster of genes highly responsive to GH at 48 h; the cluster also included the gene for Bcl6, a transcriptional repressor, which was potently inhibited by GH. Transcriptional network analysis predicted relationships among the GH-regulated genes and showed expression of several of them, including Bcl6, to be linked to signal transducer and activator of transcription (Stat) 5, an established GH-regulated transcription factor. The computational predictions led to measurements suggesting inverse roles of Bcl6 and Stat5 in regulating the SOCS2 gene. Together these analyses identify the transcriptional repressor Bcl6 as a new transcriptional mediator in GH action and suggest that Bcl6 may play general roles in responses to GH and other regulators of metabolism and growth.
Materials and Methods
Computational analysis
This study analyzes a microarray data set with 561 probe sets showing significant differential expression signals in 3T3-F442A adipocytes treated with GH (500 ng/ml) for 30 min, 4 h, or 48 h (16). Microarray data, based on U74A chip (Affymetrix, Santa Clara, CA), have been deposited in Gene Expression Omnibus (GSE2120). The data were submitted to the following computational analyses.
Gene set enrichment analysis (GSEA)
To identify pathways in which GH-regulated genes are enriched, GSEA (17) version 1.0 Java desktop application (http://www.broad.mit. edu/gsea/) was downloaded from Broad Institute of Massachusetts Institute of Technology and Harvard (Boston, MA). The analyses were performed separately on the microarray data at each of the three time points. The 175 gene sets used in the analysis were built from Kyoto Encyclopedia of Genes and Genomes (KEGG) pathways (18,19,20). Each gene set is comprised of all of the genes either in one murine KEGG pathway or in multiple murine KEGG pathways belonging to the same category documented by KEGG (http://www.genome.jp/kegg/pathway. html). For example, the cell growth and death category includes the pathways for cell cycle, apoptosis, and p53 signaling. The microarray data were normalized using robust multichip average (21) and then analyzed using GSEA, with the maximum gene set size of 500 and the minimum gene set size of 25; the other parameters were set as default. Outcomes were evaluated as normalized enrichment scores (NES).
Gene expression profile clustering
To examine patterns among highly regulated genes, the CRC algorithm 1.0 (22), a model-based algorithm capable of clustering genes displaying complex correlations (e.g. time shifted and/or inverted), was downloaded (http://www.sph.umich.edu/csg/qin/CRC). The CRC algorithm automatically infers the number of clusters and assigns cluster membership. CRC also ranks predicted clusters and their members. The settings for CRC clustering were selected to allow clustering of inverted, but not time-shifted correlations, due to the limited number of time points.
Transcriptional network analysis
To evaluate transcriptional relationships among genes highly responsive to GH, a transcriptional network was built using the GeneGo MetaCore database and tools for the cluster of genes (murine), which were strongly regulated by GH at 4 and 48 h (cluster D), except for interferon-inducible p47 GTPase, which was not available in the GeneGo database.
Promoter analysis
Conserved transcription factor binding sites of interest were predicted by scanning the promoters of the genes in the cluster showing a similar pattern of responses to GH at 4 and 48 h (cluster D), using Genomatix tools. The orthologs for six species (Homo sapiens, Pan troglodytes, Macaca mulatta, Canis familiaris, Bos Taurus, Rattus norvegicus) of the analyzed mouse genes were retrieved from the Genomatix (Munich, Germany) genome annotation system ElDorado. The Genomatix optimized promoter length was used when available; otherwise a default region of −500 bp upstream of first transcription start site and +100 bp downstream of last transcription start site was used. The promoter sequences of orthologs were aligned with Genomatix DiAlign and the binding sites were predicted with Genomatix MatInspector. The associated motif matrices of Stat5 and Bcl6 contained in Genomatix MatBase were used for query.
Physiological analyses
Gene expression
Murine 3T3-F442A adipocytes or preadipocytes were incubated with GH for various times. RNA was isolated and analyzed by quantitative real-time PCR as described previously (16). Published primer sequences were used for Atf3, Gadd45γ, Gapdh (16); Socs2 (23); Cish, Bcl6 (24); KLF5 (25), and Igf1 (26). The primers for Pik3r1 were designed using Primer Express software (Applied Biosystems, Foster City, CA): 5′-CGTGGCACAGACTTGGTGTTT-3′ (sense) and 5′-GGCAGTGCTGGTGGATCC-3′ (antisense). Data were normalized to glyceraldehyde-3-phosphate dehydrogenase, which was constant between experimental groups, and responses to GH are expressed either as (GH-control)/control, or as fold change, where control = 1.
Immunoblotting
Lysates of 3T3-F442A preadipocytes (from H. Green; Harvard University, Boston, MA) and H4IIE rat hepatoma cells (from J. Messina; University of Alabama, Birmingham, AL) were analyzed by immunoblotting with anti-Bcl6 (C-19) (1:500; Santa Cruz Biotechnology, Santa Cruz, CA) as described (27). Lysates from Ramos B cells [from R. Kwok (University of Michigan, Ann Arbor, MI) and W. Dunnick (University of Michigan, Ann Arbor, MI)] served as positive controls because they typically express Bcl6. The proteins were visualized using IRDye 800-coupled antirabbit IgG (1:12000; Rockland Immunochemicals, Gilbertsville, PA) on an Odyssey infrared scanning system (LI-COR Biosciences, Lincoln, NE). Molecular weight was estimated using protein molecular weight standards from Invitrogen (Carlsbad, CA).
Transcriptional activation
293T cells (28) were transfected by calcium phosphate coprecipitation with a SOCS2-luciferase (luc) plasmid in which the intronic GH-responsive sequence of human SOCS2 drives thymidine kinase-luc (29), in the presence of the plasmids CMV-human Bcl6 (30) or pcDNA3. Cells were additionally transfected with plasmids for rat GH receptor (31) and RSV-β-galactosidase for normalization. Eighteen hours later, cells were deprived of serum by replacing it with 1% BSA, incubated with human GH (500 ng/ml = 22 nm; Eli Lilly, Indianapolis, IN)) for 24–26 h and used to measure luciferase activity as described previously (32). Data were analyzed by ANOVA with Bonferroni correction for multiple comparisons, using Prism (GraphPad, La Jolla, CA).
Chromatin Immunoprecipitation (ChIP)
3T3-F442A adipocytes or preadipocytes were treated with GH (500 ng/ml) for the indicated times. Lysates of cross-linked cells (input) were used for ChIP as described (33) using anti-Bcl6 (N-3), anti-Stat5 (C-17) (Santa Cruz), antiacetylated histone H4 (AcH4, Millipore, Billerica, MA), or normal rabbit IgG (Santa Cruz). The anti-Stat5 antibody used recognizes both Stat-5a and -5b. The term Stat5 is used herein to refer to both Stat5a and Stat5b, unless a distinction between them is pertinent. Primers targeting the binding site for Stat5 in murine SOCS2 were based on published sequences (29). Quantification of the ChIP data were performed using Bio-Rad Multi-Analyst software (Hercules, CA).
Results
GSEA predicts GH-regulated pathways
For insight into mechanisms by which gene transcription mediates diverse responses to GH, a profile of genes regulated by GH was subjected to deep data mining. The profile identified 225 genes that were stimulated in time-dependent patterns after GH treatment in 3T3-F442A adipocytes as well as 287 genes that were repressed at the same times, as reported previously (16).
GSEA was used to identify pathways that showed overall gene expression changes with GH treatment. GSEA discerns changes between two biological states in the expression levels of sets of genes selected a priori in transcriptional profiling experiments. This method has the advantage of evaluating the overall effect of a gene set rather than any single gene, a feature important to studies of complex physiological responses such as growth or metabolic regulation, in which small changes in a set of genes in a pathway might have a larger impact than a greater change in a single gene (17). GSEA was performed on the entire microarray data set of GH-regulated genes in 3T3-F442A adipocytes. Because earlier analysis of the gene profile (16) revealed GH-regulated waves of gene transcription over time, the gene expression data for each time point were analyzed separately. The outcome yielded ranked gene sets at each time, evaluated through their NES, which indicate the extent that genes within the set are enriched in the study samples. Combining NES score rankings for each pathway at all time points indicated that the top five highly enriched gene sets regulated by GH include (in order) cell growth and death, insulin signaling, apoptosis, Janus kinase-Stat signaling and phosphoinositide signaling. These gene sets are consistent with reported biological processes and physiological functions regulated by GH (2,12,13,35). Another gene set that was relatively highly ranked was Toll-like receptor signaling; gene sets that were inhibited include pathways for tyrosine metabolism and glutathione metabolism. Because the original samples for microarray were obtained under conditions associated with GH-induced insulin resistance, the pathway for insulin signaling was examined further. Interestingly, within this pathway, the genes encoding SOCS2 and PI3K p85α were the most highly induced after GH treatment for 48 h.
Cluster analysis singles out Bcl6 as a novel gene inhibited by GH
The goal of clustering gene expression profiles is to group genes that display related expression patterns. Hierarchical clustering (36) of the data set of GH-regulated genes studied here had revealed clusters of genes sharing similar temporal patterns of response to GH (16). In the present analysis, a recently developed, model-based clustering approach based on the CRC algorithm (22) was applied to cluster the genes regulated by GH (16). CRC is able to recognize complex correlation patterns such as time-shifted and/or inverted patterns and group them into the same cluster and thus reveals functionally related genes not detected by most other clustering approaches. Inverted patterns are as important as positively correlated patterns because they show activities and regulatory functions of repressive transcription regulators.
Of the 12 clusters that were defined by CRC analysis (Fig. 1, left panel), Cluster D was selected for initial analysis because it contains genes showing the greatest fold changes 4–48 h after GH (Fig. 1, right panel), consistent with delayed timing of GH responses such as longitudinal growth and insulin resistance (12,13,35). The genes include well-studied GH target genes encoding IGF-I (3,4,37) and signaling molecules in the SOCS family, SOCS2 and CISH (29,38), as well as PI3K p85α (15). Note that genes for SOCS2 and PI3K p85α were also highlighted in the GSEA pathway analysis. Additional genes stimulated by GH in this paradigm encode the transcription factors activating transcription factor (ATF)-3 and Kruppel-like factor (KLF)-5; signaling molecules repressor of G-protein signaling 16 and interferon-inducible p47 GTPase; the cytokine IL-6; and growth arrest and DNA damage inducible-45γ. These genes were induced by GH in adipocytes, and all except IL-6 showed highest levels of induction at 4 and 48 h. Importantly, one other gene in the cluster stood out as being the most highly repressed by GH: the gene encoding the transcriptional repressor Bcl6 was inhibited by GH by almost 75%.
Figure 1.

CRC analysis of GH-regulated genes clusters coregulated genes. A, Heat map shows results of CRC cluster analysis of a data set of GH-regulated genes. Among the 12 defined clusters, Cluster D contains genes showing greatest differential regulation by GH at 4 and 48 h. Red indicates increase; green indicates decrease. B, Expanded heat map of Cluster D itemizing products of the individual genes.
The changes in expression of most of the genes in this cluster, including the dramatic decrease in Bcl6 expression, were confirmed by quantitative real-time PCR of RNA from GH-treated 3T3-F442A adipocytes (Fig. 2). The overall changes in mRNA for each gene correspond with microarray findings at 4 or 48 h: Expression of SOCS2 and CISH mRNA was the most highly stimulated by GH (50- to 60-fold). Bcl6 expression was inhibited almost 80%. These findings identify the gene encoding the transcriptional repressor Bcl6 as a novel target of GH and suggest that regulation of transcriptional repression plays a role in GH-regulated gene expression.
Figure 2.

Expression of mRNA for representative genes in Cluster D. 3T3-F442A adipocytes were treated with GH for the indicated times; RNA was prepared and analyzed by quantitative real-time PCR. Responses to GH are expressed as (GH-C)/C. Data are representative of two to eight independent experiments. The GH-responsive genes are grouped vertically in general categories related to function.
Transcriptional network analysis highlights Stat 5-regulated genes, including the repressor Bcl6
For an unbiased view of transcriptional relationships among the GH-regulated genes in Cluster D, a transcriptional regulation network (Fig. 3) was built for genes in this cluster and their known interacting transcription factors, using the GeneGo database (St. Joseph, MO) with MetaCore software from GeneGo. The network relates the genes submitted with transcription factors that regulate them, as reported in the literature; for genes submitted that encode transcription factors, the target genes that they regulate are also linked. The analysis revealed links for regulation of seven of the genes in the cluster. Prominently, Stat5 emerged as a hub linking four of the genes: Stat5 has been shown to activate expression of the genes for SOCS2, CISH, and IGF-I (4,29,38). Bcl6, the only gene in the cluster that was repressed by GH, was also linked to Stat5. Several reports have shown Stat5 to be a regulator of Bcl6 expression, either as an inducer or a repressor, depending on cell type (39,40,41). The coordination via Stat5 of these four genes, as revealed in the network, suggests that the genes may be coregulated by mechanisms involving Stat5 in response to GH. Genes for KLF5, ATF3, and IL-6 appear from the network analysis to be transcriptionally regulated by mechanisms not directly involving Stat5.
Figure 3.

Network analysis using GeneGo MetaCore identifies coregulated GH target genes coordinated by Stat 5. Boxes indicate genes submitted; oval designates transcription factor hub.
Because the genes in Cluster D had similar expression patterns in response to GH over time, it was speculated that they might be regulated by similar transcriptional mechanisms. The binding sites for five transcription factor families were searched in the promoter regions of genes in Cluster D (Table 1). Conserved sites for Stats and for Bcl6, as well as for CCAAT/enhancer binding protein (C/EBP), KLF/SP1, and ATF family factors, were predicted in almost every gene in the cluster. Stats and C/EBP family proteins are reported mediators of GH-regulated gene transcription (42,43); ATFs, members of the cAMP response element-binding protein family of transcription factors, are also regulated by GH (44,45). Bcl6 and KLFs/SP1 factors appear to be novel transcriptional regulators of the GH target genes containing these binding sites.
Table 1.
Predicted transcription factor binding sites in GH-regulated genes
| Gene | Stat sites | Bcl6 sites | C/EBP sites | KLF sites | ATF sites |
|---|---|---|---|---|---|
| Atf3 | Y (R) | N | Y (H, M, C, R) | Y (H, M, C, R) | Y (H, M, C, R) |
| Klf5 | Y (H, P, M, R) | Y (B, R) | Y (H, P, M, C, R) | Y (M, P, H, R, C) | Y (H, P, M, C, R) |
| Socs2 | Y (B, R) | Y (B, R) | Y (−) | Y (B, R) | Y (B, R) |
| Cish | Y (H, P, M, C, B, R) | Y (H, P, M, C, B, R) | Y (H, P) | Y (H, P, M, C, B, R) | Y (M, R, B) |
| Pik3r1 | Y (P, M) | Y (H, P, C) | Y (−) | Y (−) | N |
| Gadd45γ | Y (−) | Y (−) | N | Y (H, P, M, C, B, R) | N |
| Igf1 | Y (H, M, C, B, R) | Y (R) | Y (H, M, C, B) | Y (−) | Y (H, M, C, B) |
| Iigp1 | Y (−) | Y (−) | Y (−) | Y (−) | N |
| Rgs16 | Y (−) | Y (R) | Y (−) | Y (H, P, R) | N |
| Bcl6 | Y (H, P, M, C, B, R) | Y (H, P, M, C, B, R) | Y (H, P, M, C, R) | Y (H, P, M, C, R) | Y (−) |
| Il6 | Y (M, B) | N | Y (H, P, M, C, R, B) | Y (H, P, M, C, R, B) | Y (H, P, M, C, R, B) |
Promoters of murine genes in Cluster D were analyzed using Genomatix tools to predict binding sites for the indicated transcription factors. KLF sites were searched as SP1 sites; ATF sites were searched as cAMP response element-binding protein family sites. Letters indicate that conserved sites are found in orthologs of corresponding species as follows: H, Homo sapiens; P, Pan troglodytes; M, Macaca mulatta; C, Canis familiaris; B, Bos Taurus; R, Rattus norvegicus. Outcomes are expressed as Y, sites were found; Y(−), sites were found in mouse genes, but the sites were not conserved in any orthologs; N, no sites were found.
The transcriptional repressor Bcl6 mediates expression of GH target genes
The relationships between Bcl6 and Stat5 suggested by network and promoter analyses raise the possibility that these two transcription factors may be coordinated in regulating the expression of some of the other genes in this cluster. SOCS2 expression is not only highly stimulated by GH, but SOCS2 protein participates in GH signaling (46,47). When the most highly stimulated (SOCS2) and most highly repressed (Bcl6) genes in the present analysis were compared, the lowest GH concentrations (5 ng/ml) inhibited Bcl6 mRNA and induced SOCS2 expression, suggesting an inverse relationship that is highly responsive to GH (Fig. 4). Consistent with this, in multiple experiments, inhibition of Bcl6 and induction of SOCS2 expression by GH followed a similar time course, with little or no responses at 30 min and substantial responses at 4 or 48 h, in both 3T3-F442A adipocytes and preadipocytes (supplemental Fig. 1, published as supplemental data on The Endocrine Society’s Journals Online web site at http://endo.endojournals.org) Furthermore, the endogenous Bcl6 protein was detectable in 3T3-F442A preadipocytes (Fig. 4, inset); Bcl6 was also detected in H4IIE rat hepatoma cells.
Figure 4.
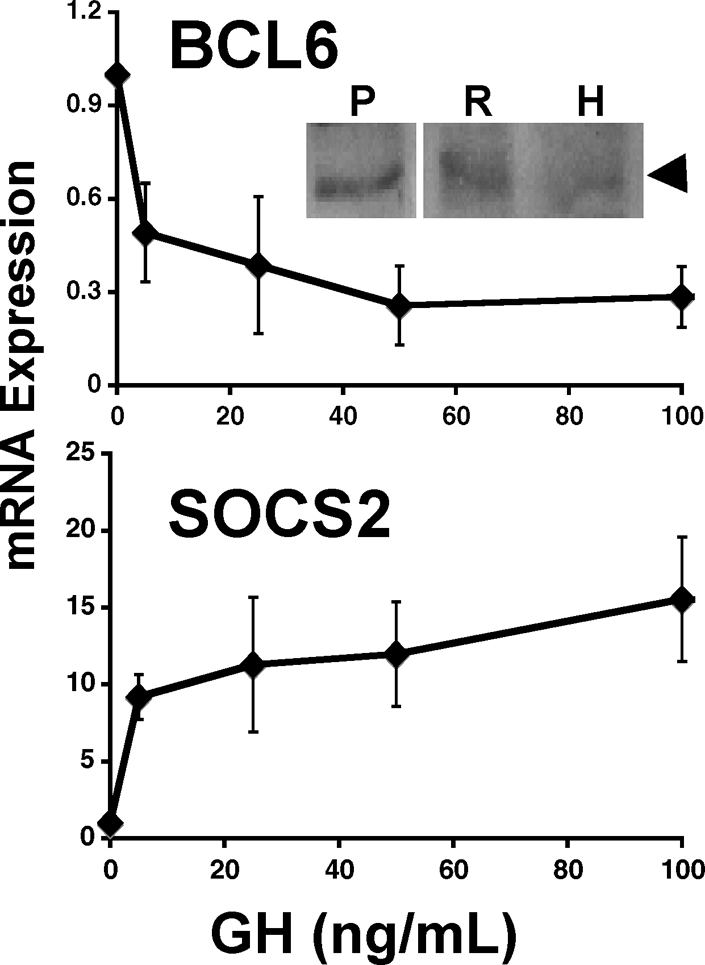
Inverse regulation of Bcl6 and SOCS2 mRNA in response to GH. Dose response: Comparison of Bcl6 (top) and SOCS2 (bottom) mRNA in 3T3-F442A preadipocytes after 48 h incubation with varying concentrations of GH. Data are expressed as fold change due to GH over control (set to 1). Each point shows mean ± se for three independent experiments. Inset, BCL6 protein is detected in 3T3-F442A preadipocytes and hepatoma cells. Immunoblotting with anti-Bcl6 demonstrates the presence of Bcl6 protein (arrowhead) in lysates of 3T3-F442A preadipocytes (lane P) and H4IIE hepatoma cells (lane H). Lane R shows Ramos B cells for reference.
The inverse regulation of Bcl6 and SOCS2 by GH was evaluated further because SOCS2 is an established Stat5 target gene. The human SOCS2 gene contains a GH-inducible region in the first intron, which contains two GH-responsive Stat5 binding sites (29). This sequence, fused upstream of thymidine kinase-luc (termed SOCS2-luc), was transfected into 293T cells along with DNA for GH receptor. Treatment with GH for 24 h stimulated SOCS2-luc as expected (Fig. 5A). However, when Bcl6 was expressed, the activity of SOCS2-luc was strongly inhibited (Fig. 5A, white bars), consistent with the role of Bcl6 as a transcriptional repressor. In the presence of Bcl6, GH failed to elicit a significant stimulation of SOCS2-luc over the repressed basal activity. Consistent with inverse regulation by GH, SOCS2-luc is inhibited by Bcl6, whereas Stat5 activates it, as expected (29) (data not shown).
Figure 5.

Bcl6 mediates expression of GH target genes. A, Bcl6 inhibits expression of SOCS2-luc. A plasmid containing the GH-responsive sequence of the SOCS2 gene upstream of luciferase (SOCS2-luc), and plasmids for the GH receptor and β-galactosidase were transfected into 293T cells in the absence or presence of an expression plasmid for Bcl6. Cells were treated without (white bars) or with GH (black bars) for 24 h, and luciferase activity was measured, expressed as RLU (relative luciferase units). Bars, mean ± se for observations in six independent experiments. The expression of SOCS2-luc in the presence of Bcl6 was significantly (P < 0.01) less than in the absence of Bcl6 (compare white bars). The response to GH (compare white and black bars) was significant (P < 0.01) in the absence of Bcl6 but was not significant in the presence of Bcl6. SOCS2-luc in the presence of GH (compare black bars) in the absence of Bcl6 was significantly (P < 0.01) greater than in the presence of Bcl6. B, Bcl6 and Stat5 occupy SOCS2 inversely in response to GH: 3T3-F442A adipocytes or preadipocytes were treated with GH for the indicated times and nuclei were analyzed by ChIP, using antibodies against Bcl6, Stat5, or acetylated histone 4 (AcH4), with primers for the GH-responsive sequence in the SOCS2 gene. Samples treated with IgG or no antibody served as controls; 1% or 0.5% input is shown as indicated. IP, Immunoprecipitation.
Endogenous Bcl6 and Stat5 also show an inverse relationship in occupying endogenous SOCS2 DNA, as demonstrated by ChIP. Because SOCS2 is regulated by Bcl6 as well as Stat5, the occupancy of these two factors on the SOCS2 GH-responsive sequence was examined in vivo by CHIP (Fig. 5B). Occupancy of endogenous Bcl6 on SOCS2 was evident in the absence of GH and decreased progressively after GH treatment; Bcl6 occupancy was almost undetectable 48 h after GH. For Stat5, occupancy on SOCS2 was negligible or absent without GH treatment (time 0), but Stat5 occupancy increased after GH. Thus, the occupancy of Bcl6 decreased as that of Stat5 increased (supplemental Fig. 2). Occupancy of acetylated histone H4 is a positive control consistent with transcriptional activation of SOCS2; no occupancy was detected with IgG or beads alone. Together these findings indicate that endogenous Bcl6 occupies the SOCS2 gene in vivo. The occupancy of Bcl6 on DNA encompassing the GH-responsive sequence of SOCS2 decreases with GH treatment, whereas occupancy of Stat5 increases with GH. The inverse relationship between occupancy of Bcl6 and Stat5 on SOCS2 DNA is consistent with their respective abilities to repress and activate SOCS2.
Discussion
An integrative computational strategy reveals novel aspects of GH-regulated transcription
High throughput technologies such as DNA microarrays provide a global view of the expression patterns of all genes in the genome. This is important for analyzing complex biological processes such as those regulated by GH, including longitudinal growth or insulin resistance, in which it is crucial to understand how genes cooperate to carry out related series of reactions. Despite the fundamental advantages offered by high-throughput technologies, a key challenge is how to extract biological insights effectively from massive and noisy data. Powerful computational and statistical data mining tools have been developed and are able to translate the raw and noisy data into new scientific knowledge when applied appropriately. The computational tools used, when applied independently, provide pieces of evidence from different perspectives. Here an integrative computational data mining strategy was used; the combined approaches allow interpretation in the face of limitations inherent in each computational tool. This study demonstrates the effectiveness of a strategy using an array of computational tools to bring fresh insights and provide new clues for understanding complex biological processes regulated by hormones.
Through deep data mining, this study used several distinct computational approaches which reinforced each other to identify Bcl6 as a new player in GH-regulated transcription, and suggest its interplay with Stat5. GSEA focused on functionally important GH target genes, which facilitated identifying a cluster of interest. CRC clustering singled out Bcl6 because it identified Bcl6 among the genes most highly regulated by GH at 4–48 h, despite the fact that Bcl6 was the one gene that was highly repressed, whereas other genes in the cluster were stimulated. Construction of a transcriptional network highlighted the role of Stat5 by linking Bcl6 with Stat5 as well as SOCS2 with Stat5, suggesting SOCS2 as a possible target gene of Bcl6. Promoter analysis predicted that some GH target genes contain both Stat5 and Bcl6 sites. Thus, the combination of high throughput technologies, integrative use of data mining tools, and statistical analysis, applied to questions in understanding GH transcription and its physiological actions have provided an efficient strategy to improve our understanding of mechanisms of transcriptional repression and their interface with transcriptional activation in the context of GH action.
The transcriptional repressor Bcl6 participates in GH-regulated transcription
This work implicates Bcl6 in GH-regulated transcription and demonstrates that Bcl6 serves as a potent repressor. The transcriptional repression properties of Bcl6 are well documented (48), based on its established roles in immune function. Bcl6 is a member of the poxvirus and zinc finger/broad-complex, tramtrack and bric-a-brac zinc finger family of proteins. Translocations involving Bcl6 occur frequently in B cell lymphomas. Bcl6 is known for its essential role in B cell differentiation in germinal centers (48,49). Transcriptional repression by Bcl6 involves a variety of mechanisms: it recruits corepressors such as silencing mediator of retinoid and thyroid receptors (SMRT), nuclear receptor corepressor (NCoR), and Bcl6 interacting corepressor (BCoR) as well as histone deacetylases (50,51,52,53), and it associates with chromatin remodeling complexes and other repressors (54,55,56). A potent transcriptional repressor such as Bcl6 has not previously been implicated in GH-regulated transcription. Previous investigation of gene repression by GH showed that Stat5 was modulated by other transcription regulatory molecules such as Forkhead box O1 (FoxO1), and hepatocyte nuclear factor (HNF)-3β, -4α, and -6 (9,57,58,59). It remains to be determined whether Bcl6, and associated transcription regulatory factors, interact in complexes to regulate GH target genes.
Because Bcl6 expression is dramatically inhibited by GH, the consequence of such reversal of repression likely contributes to activation of genes in response to GH. SOCS2 is an excellent candidate because Bcl6 occupies SOCS2 DNA within a GH-responsive sequence (29), and its occupancy decreases on GH treatment. Furthermore, expression of Bcl6 inhibited SOCS2-luc under basal conditions; a small residual increase with GH was not statistically significant. Together these findings are consistent with SOCS2 being a new gene target of Bcl6. It can be speculated that in response to GH, Bcl6 functions in coordination with Stat5, which increases occupancy on SOCS2 DNA in a pattern reciprocal to the decrease in occupancy of Bcl6 after GH treatment. The consequence of both the increase in Stat5 and the decrease in Bcl6 is to increase expression of SOCS2 in response to GH. Thus, Bcl6 and Stat5 may participate in an inverse transcriptional repressor/activator relationship to facilitate expression of SOCS2 and perhaps other GH-regulated genes. It is relevant in this regard that the consensus DNA sequences that bind Bcl6 and Stat5 are remarkably similar (60,61). It is also recognized that reduced availability of Bcl6 protein through its degradation or inactivation may contribute to its reduced occupancy after GH; Erk-mediated phosphorylation and acetylation of Bcl6 have been reported to result in its degradation or inactivation (62,63). GH is known to induce phosphorylation via Erk 1/2 and acetylation to activate transcription factors such as C/EBPβ (28,32) and may similarly modulate other transcription regulatory proteins in the nucleus. Overall, Bcl6 appears to be a highly responsive new player in GH-regulated transcription.
Several studies have implicated Stats, particularly Stat5, in the regulation of Bcl6 gene expression. This regulation may be cell type specific because in a subset of germinal center cells, Stat5 increased expression of Bcl6 (41), whereas in B-lymphoma and other hematopoietic cell lines, Stat5 inhibited expression of Bcl6 (40). Interestingly, Stat3 activation is coordinated with Bcl6 inhibition in regulating Blimp1 in plasma cell differentiation during B cell maturation (64). Furthermore, prolactin, which activates Stat5, induces Bcl6 in pancreatic β-cells (39); Bcl6 in turn represses Menin expression, which allows the β-cell proliferation of adaptive islet growth, as in pregnancy or obesity (39). However, a preliminary report indicates that prolactin inhibits Bcl6 expression in breast cancer cell lines (65), suggesting that regulation of Bcl6 may vary with cell type. Further analysis of the role(s) of Bcl6 in repressing GH-regulated gene expression will provide new mechanistic insights into GH action.
Contributions of Bcl6 to physiological responses to GH
A novel observation in this study is that the transcriptional repressor Bcl6 is expressed and tightly regulated in adipocytes. Bcl6 is also detected in hepatoma cells, consistent with preliminary findings of Bcl6 mRNA in mouse liver (LaPensee, C., and J. Schwartz, unpublished data). These observations raise possibilities for identifying previously unrecognized functions of Bcl6 in metabolic regulation. Bcl6−/− mice are reported to show growth retardation (66,67,68), but their metabolic status has not been described. In a gene profile of human muscle biopsy samples before and after euglycemic insulin clamp studies, the gene for Bcl6 was reported to be repressed by insulin (69). A metabolic role of Bcl6 is further supported in this study by the observed coordination of the functions of Bcl6 with those of Stat5 in regulating SOCS2 because Stat5 has been amply demonstrated to participate in regulation of genes implicated in metabolic regulation and adipogenesis (70,71,72,73). In this regard, it is of note that the original microarray experiments that generated the gene profile analyzed in this study were performed using adipocytes under conditions in which GH can induce insulin resistance (16,74). The functions of many of the GH-regulated genes, identified by gene ontology categories, correspond with established physiological responses to GH (16). GSEA identified insulin signaling pathway as one of the major pathways regulated by GH, implicating SOCS2 and PI3K p85α. Suggestions that SOCS2 contributes to insulin resistance are also reported (34). The present findings that Bcl6 is expressed in adipocytes and highly regulated by GH, which can induce insulin resistance, open new directions for analyzing mechanisms involving Bcl6 and transcriptional repression in regulation of metabolism in conditions such as obesity and diabetes.
Together, these studies demonstrate how systems biology approaches involving integrative computational strategies can lead to identification of Bcl6 as a new participant in GH-regulated gene transcription, incorporating a potent and tightly regulated repressor as part of its regulatory mechanisms. Bcl6 is of additional interest because of its potential interplay with Stat5 in regulating target genes; such interactions may have broad relevance in metabolic and growth regulation and in the spectrum of cytokine actions that contribute to immune regulation and overall growth in normal and pathological conditions.
Supplementary Material
Acknowledgments
We thank Dr. Amilcar Flores-Morales for the SOCS2-luciferase plasmid, Dr. Beverly Baron for Bcl6 expression plasmids, and N. Lanning for H4IIE cell lysates. The authors also thank Drs. T. X. Cui, J. D. Lin, T. Maures, and C. LaPensee for comments on the manuscript.
Footnotes
This work was supported by Grant 1-06-RA-120 from the American Diabetes Association and Grant DK46072 from the National Institutes of Health (NIH) (to J.S.). Y.C. was supported in part by the Bioinformatics Program at the University of Michigan and NIH Grants R01 LM008106 and U54 DA021519 (to DJS). G.L. and J.S.H. were supported by NIH Grant T32 GM07315. J.S.H. was recipient of predoctoral fellowships from National Defense Science and Engineering Graduate Fellowship and National Science Foundation. T.L. was supported by a fellowship from the American Physiological Society.
Disclosure Summary: The authors have nothing to disclose.
First Published Online April 30, 2009
Abbreviations: ATF, Activating transcription factor; Bcl6, B cell lymphoma 6; C/EBP, CCAAT/enhancer-binding protein; ChIP, chromatin Immunoprecipitation; CRC, Chinese restaurant clustering; GSEA, gene set enrichment analysis; KEGG, Kyoto Encyclopedia of Genes and Genomes; KLF, Kruppel-like factor; NES, normalized enrichment scores; PI3K, phosphoinositide 3′ kinase; SOCS2, suppressor of cytokine signaling 2; Stat, signal transducer and activator of transcription.
References
- Lanning NJ, Carter-Su C 2006 Recent advances in growth hormone signaling. Rev Endocr Metab Disord 7:225–235 [DOI] [PubMed] [Google Scholar]
- Carter-Su C, Schwartz J, Smit LS 1996 Molecular mechanism of growth hormone action. Annu Rev Physiol 58:187–207 [DOI] [PubMed] [Google Scholar]
- Mathews LS, Norstedt G, Palmiter RD 1986 Regulation of insulin-like growth factor I gene expression by growth hormone. Proc Nat Acad Sci USA 83:9343–9347 [DOI] [PMC free article] [PubMed] [Google Scholar]
- Woelfle J, Billiard J, Rotwein P 2003 Acute control of insulin-like growth factor-I gene transcription by growth hormone through Stat5b. J Biol Chem 278:22696–22702 [DOI] [PubMed] [Google Scholar]
- Enberg B, Hulthén A, Möller C, Norstedt G, Francis SM 1994 Growth hormone (GH) regulation of a rat serine protease inhibitor fusion gene in cells transfected with GH receptor cDNA. J Mol Endocrinol 12:39–46 [DOI] [PubMed] [Google Scholar]
- Bergad PL, Schwarzenberg SJ, Humbert JT, Morrison M, Amarasinghe S, Towle HC, Berry SA 2000 Inhibition of growth hormone action in models of inflammation. Am J Physiol Cell Physiol 279:C1906–C1917 [DOI] [PubMed] [Google Scholar]
- Doglio A, Dani C, Grimaldi P, Ailhaud G 1989 Growth hormone stimulates c-fos gene expression by means of protein kinase C without increasing inositol lipid turnover. Proc Natl Acad Sci USA 86:1148–1152 [DOI] [PMC free article] [PubMed] [Google Scholar]
- Sundseth SS, Alberta JA, Waxman DJ 1992 Sex-specific, growth hormone-regulated transcription of the cytochrome P450 2C11 and 2C12 genes. J Biol Chem 267:3907–3914 [PubMed] [Google Scholar]
- Waxman DJ, O'Connor C 2006 Growth hormone regulation of sex-dependent liver gene expression. Mol Endocrinol 20:2613–2629 [DOI] [PubMed] [Google Scholar]
- Gurland G, Ashcom G, Cochran BH, Schwartz J 1990 Rapid events in growth hormone action. Induction of c-fos and c-jun transcription in 3T3-F442A preadipocytes. Endocrinology 127:3187–3195 [DOI] [PubMed] [Google Scholar]
- Houssay BA, Biasotti A 1930 Hypophysectomie et diabete pancreatique chez le crapaud. C R Soc Biol (Paris) 104:407–412 [Google Scholar]
- Dominici FP, Turyn D 2002 Growth hormone-induced alterations in the insulin-signaling system. Exp Biol Med (Maywood) 227:149–157 [DOI] [PubMed] [Google Scholar]
- Davidson MB 1987 Effect of growth hormone on carbohydrate and lipid metabolism. Endocr Rev 8:115–131 [DOI] [PubMed] [Google Scholar]
- Barbour LA, Mizanoor Rahman S, Gurevich I, Leitner JW, Fischer SJ, Roper MD, Knotts TA, Vo Y, McCurdy CE, Yakar S, Leroith D, Kahn CR, Cantley LC, Friedman JE, Draznin B 2005 Increased P85α is a potent negative regulator of skeletal muscle insulin signaling and induces in vivo insulin resistance associated with growth hormone excess. J Biol Chem 280:37489–37494 [DOI] [PubMed] [Google Scholar]
- del Rincon JP, Iida K, Gaylinn BD, McCurdy CE, Leitner JW, Barbour LA, Kopchick JJ, Friedman JE, Draznin B, Thorner MO 2007 Growth hormone regulation of p85α expression and phosphoinositide 3-kinase activity in adipose tissue: mechanism for growth hormone-mediated insulin resistance. Diabetes 56:1638–1646 [DOI] [PubMed] [Google Scholar]
- Huo JS, McEachin RC, Cui TX, Duggal NK, Hai T, States DJ, Schwartz J 2006 Profiles of growth hormone (GH)-regulated genes reveal time-dependent responses and identify a mechanism for regulation of activating transcription factor 3 by GH. J Biol Chem 281:4132–4141 [DOI] [PubMed] [Google Scholar]
- Subramanian A, Tamayo P, Mootha VK, Mukherjee S, Ebert BL, Gillette MA, Paulovich A, Pomeroy SL, Golub TR, Lander ES, Mesirov JP 2005 Gene set enrichment analysis: a knowledge-based approach for interpreting genome-wide expression profiles. Proc Natl Acad Sci USA 102:15545–15550 [DOI] [PMC free article] [PubMed] [Google Scholar]
- Ogata H, Goto S, Sato K, Fujibuchi W, Bono H, Kanehisa M 1999 KEGG: Kyoto encyclopedia of genes and genomes. Nucleic Acids Res 27:29–34 [DOI] [PMC free article] [PubMed] [Google Scholar]
- Kanehisa M, Goto S, Kawashima S, Nakaya A 2002 The KEGG databases at GenomeNet. Nucleic Acids Res 30:42–46 [DOI] [PMC free article] [PubMed] [Google Scholar]
- Kanehisa M, Goto S 2000 KEGG: Kyoto encyclopedia of genes and genomes. Nucleic Acids Res 28:27–30 [DOI] [PMC free article] [PubMed] [Google Scholar]
- Irizarry RA, Hobbs B, Collin F, Beazer-Barclay YD, Antonellis KJ, Scherf U, Speed TP 2003 Exploration, normalization, and summaries of high density oligonucleotide array probe level data. Biostatistics 4:249–264 [DOI] [PubMed] [Google Scholar]
- Qin ZS 2006 Clustering microarray gene expression data using weighted Chinese restaurant process. Bioinformatics 22:1988–1997 [DOI] [PubMed] [Google Scholar]
- Sugimoto N, Oida T, Hirota K, Nakamura K, Nomura T, Uchiyama T, Sakaguchi S 2006 Foxp3-dependent and -independent molecules specific for CD25+CD4+ natural regulatory T cells revealed by DNA microarray analysis. Int Immunol 18:1197–1209 [DOI] [PubMed] [Google Scholar]
- Pritchard CC, Hsu L, Delrow J, Nelson PS 2001 Project normal: defining normal variance in mouse gene expression. Proc Natl Acad Sci USA 98:13266–13271 [DOI] [PMC free article] [PubMed] [Google Scholar]
- Salazard B, Bellon L, Jean S, Maraninchi M, El-Yazidi C, Orsière T, Margotat A, Botta A, Bergé-Lefranc JL 2004 Low-level arsenite activates the transcription of genes involved in adipose differentiation. Cell Biol Toxicol 20:375–385 [DOI] [PubMed] [Google Scholar]
- Waters KM, Safe S, Gaido KW 2001 Differential gene expression in response to methoxychlor and estradiol through ERα, ERβ, and AR in reproductive tissues of female mice. Toxicol Sci 63:47–56 [DOI] [PubMed] [Google Scholar]
- Liao J, Piwien-Pilipuk G, Ross SE, Hodge CL, Sealy L, MacDougald OA, Schwartz J 1999 CCAAT/enhancer-binding protein β (C/EBPβ) and C/EBPδ contribute to growth hormone-regulated transcription of c-fos. J Biol Chem 274:31597–31604 [DOI] [PubMed] [Google Scholar]
- Ceseña TI, Cardinaux JR, Kwok R, Schwartz J 2007 CCAAT/enhancer-binding protein (C/EBP) β is acetylated at multiple lysines: acetylation of C/EBPβ at lysine 39 modulates its ability to activate transcription. J Biol Chem 282:956–967 [DOI] [PubMed] [Google Scholar]
- Vidal OM, Merino R, Rico-Bautista E, Fernandez-Perez L, Chia DJ, Woelfle J, Ono M, Lenhard B, Norstedt G, Rotwein P, Flores-Morales A 2007 In vivo transcript profiling and phylogenetic analysis identifies suppressor of cytokine signaling 2 as a direct signal transducer and activator of transcription 5b target in liver. Mol Endocrinol 21:293–311 [DOI] [PubMed] [Google Scholar]
- Baron BW, Zeleznik-Le N, Baron MJ, Theisler C, Huo D, Krasowski MD, Thirman MJ, Baron RM, Baron JM 2007 Repression of the PDCD2 gene by BCL6 and the implications for the pathogenesis of human B and T cell lymphomas. Proc Nat Acad Sci USA 104:7449–7454 [DOI] [PMC free article] [PubMed] [Google Scholar]
- Wang X, Möller C, Norstedt G, Carter-Su C 1993 Growth hormone-promoted tyrosyl phosphorylation of a 121-kDa growth hormone receptor-associated protein. J Biol Chem 268:3573–3579 [PubMed] [Google Scholar]
- Piwien-Pilipuk G, MacDougald O, Schwartz J 2002 Dual regulation of phosphorylation and dephosphorylation of C/EBPβ modulate its transcriptional activation and DNA binding in response to growth hormone. J Biol Chem 277:44557–44565 [DOI] [PubMed] [Google Scholar]
- Cui TX, Piwien-Pilipuk G, Huo JS, Kaplani J, Kwok R, Schwartz J 2005 Endogenous CCAAT/enhancer binding protein β and p300 are both regulated by growth hormone to mediate transcriptional activation. Mol Endocrinol 19:2175–2186 [DOI] [PubMed] [Google Scholar]
- Kato H, Nomura K, Osabe D, Shinohara S, Mizumori O, Katashima R, Iwasaki S, Nishimura K, Yoshino M, Kobori M, Ichiishi E, Nakamura N, Yoshikawa T, Tanahashi T, Keshavarz P, Kunika K, Moritani M, Kudo E, Tsugawa K, Takata Y, Hamada D, Yasui N, Miyamoto T, Shiota H, Inoue H, Itakura M 2006 Association of single-nucleotide polymorphisms in the suppressor of cytokine signaling 2 (SOCS2) gene with type 2 diabetes in the Japanese. Genomics 87:446–458 [DOI] [PubMed] [Google Scholar]
- Isaksson OG, Edén S, Jansson JO 1985 Mode of action of pituitary growth hormone on target cells. Annu Rev Physiol 47:483–499 [DOI] [PubMed] [Google Scholar]
- Eisen MB, Spellman PT, Brown PO, Botstein D 1998 Cluster analysis and display of genome-wide expression patterns. Proc Natl Acad Sci USA 95:14863–14868 [DOI] [PMC free article] [PubMed] [Google Scholar]
- Woelfle J, Rotwein P 2004 In vivo regulation of growth hormone-stimulated gene transcription by STAT5b. Am J Physiol Endocrinol Metab 286:E393–E401 [DOI] [PubMed] [Google Scholar]
- Tollet-Egnell P, Flores-Morales A, Stavréus-Evers A, Sahlin L, Norstedt G 1999 Growth hormone regulation of SOCS-2, SOCS-3, and CIS messenger ribonucleic acid expression in the rat. Endocrinology 140:3693–3704 [DOI] [PubMed] [Google Scholar]
- Karnik SK, Chen H, McLean GW, Heit JJ, Gu X, Zhang AY, Fontaine M, Yen MH, Kim SK 2007 Menin controls growth of pancreatic β-cells in pregnant mice and promotes gestational diabetes mellitus. Science 318:806–809 [DOI] [PubMed] [Google Scholar]
- Walker SR, Nelson EA, Frank DA 2007 STAT5 represses BCL6 expression by binding to a regulatory region frequently mutated in lymphomas. Oncogene 26:224–233 [DOI] [PubMed] [Google Scholar]
- Scheeren FA, Naspetti M, Diehl S, Schotte R, Nagasawa M, Wijnands E, Gimeno R, Vyth-Dreese FA, Blom B, Spits H 2005 STAT5 regulates the self-renewal capacity and differentiation of human memory B cells and controls Bcl-6 expression. Nat Immunol 6:303–313 [DOI] [PubMed] [Google Scholar]
- Ceseña TI, Cui TX, Piwien-Pilipuk G, Kaplani J, Calinescu AA, Huo JS, Iñiguez-Lluhí JA, Kwok R, Schwartz J 2007 Multiple mechanisms of growth hormone-regulated gene transcription. Mol Genet Metab 90:126–133 [DOI] [PMC free article] [PubMed] [Google Scholar]
- Herrington J, Smit LS, Schwartz J, Carter-Su C 2000 The role of STAT proteins in growth hormone signaling. Oncogene 19:2585–2597 [DOI] [PubMed] [Google Scholar]
- Yarwood SJ, Kilgour E, Anderson NG 1998 Cyclic AMP potentiates growth hormone-dependent differentiation of 3T3-F442A preadipocytes: possible involvement of the transcription factor CREB. Mol Cell Endocrinol 138:41–50 [DOI] [PubMed] [Google Scholar]
- Cui TX, Kwok R, Schwartz J 2008 Cooperative regulation of endogenous cAMP-response element binding protein and CCAAT/enhancer-binding protein β in GH-stimulated c-fos expression. J Endocrinol 196:89–100 [DOI] [PubMed] [Google Scholar]
- Turnley AM 2005 Role of SOCS2 in growth hormone actions. Trends Endocrinol Metab 16:53–58 [DOI] [PubMed] [Google Scholar]
- Krebs DL, Hilton DJ 2001 SOCS proteins: negative regulators of cytokine signaling. Stem Cells 19:378–387 [DOI] [PubMed] [Google Scholar]
- Jardin F, Ruminy P, Bastard C, Tilly H 2007 The BCL6 proto-oncogene: a leading role during germinal center development and lymphomagenesis. Pathol Biol (Paris) 55:73–83 [DOI] [PubMed] [Google Scholar]
- Ci W, Polo JM, Melnick A 2008 B-cell lymphoma 6 and the molecular pathogenesis of diffuse large B-cell lymphoma. Curr Opin Hematol 15:381–390 [DOI] [PMC free article] [PubMed] [Google Scholar]
- Wong CW, Privalsky ML 1998 Components of the SMRT corepressor complex exhibit distinctive interactions with the POZ domain oncoproteins PLZF, PLZF-RARα, and BCL-6. J Biol Chem 273:27695–27702 [DOI] [PubMed] [Google Scholar]
- Huynh KD, Bardwell VJ 1998 The BCL-6 POZ domain and other POZ domains interact with the co-repressors N-CoR and SMRT. Oncogene 17:2473–2484 [DOI] [PubMed] [Google Scholar]
- Huynh KD, Fischle W, Verdin E, Bardwell VJ 2000 BCoR, a novel corepressor involved in BCL-6 repression. Genes Dev 14:1810–1823 [PMC free article] [PubMed] [Google Scholar]
- Dhordain P, Albagli O, Lin RJ, Ansieau S, Quief S, Leutz A, Kerckaert JP, Evans RM, Leprince D 1997 Corepressor SMRT binds the BTB/POZ repressing domain of the LAZ3/BCL6 oncoprotein. Proc Nat Acad Sci USA 94:10762–10767 [DOI] [PMC free article] [PubMed] [Google Scholar]
- Chevallier N, Corcoran CM, Lennon C, Hyjek E, Chadburn A, Bardwell VJ, Licht JD, Melnick A 2004 ETO protein of t(8;21) AML is a corepressor for Bcl-6 B-cell lymphoma oncoprotein. Blood 103:1454–1463 [DOI] [PubMed] [Google Scholar]
- Fujita N, Jaye DL, Geigerman C, Akyildiz A, Mooney MR, Boss JM, Wade PA 2004 MTA3 and the Mi-2/NuRD complex regulate cell fate during B lymphocyte differentiation. Cell 119:75–86 [DOI] [PubMed] [Google Scholar]
- Mendez LM, Polo JM, Yu JJ, Krupski M, Ding BB, Melnick A, Ye BH 2008 CtBP is an essential corepressor for BCL6 autoregulation. Mol Cell Biol 28:2175–2186 [DOI] [PMC free article] [PubMed] [Google Scholar]
- Ono M, Chia DJ, Merino-Martinez R, Flores-Morales A, Unterman TG, Rotwein P 2007 Signal transducer and activator of transcription (Stat) 5b-mediated inhibition of insulin-like growth factor binding protein-1 gene transcription: a mechanism for repression of gene expression by growth hormone. Mol Endocrinol 21:1443–1457 [DOI] [PubMed] [Google Scholar]
- Wauthier V, Waxman DJ 2008 Sex-specific early growth hormone response genes in rat liver. Mol Endocrinol 22:1962–1974 [DOI] [PMC free article] [PubMed] [Google Scholar]
- Holloway MG, Laz EV, Waxman DJ 2006 Codependence of growth hormone-responsive, sexually dimorphic hepatic gene expression on signal transducer and activator of transcription 5b and hepatic nuclear factor 4α. Mol Endocrinol 20:647–660 [DOI] [PubMed] [Google Scholar]
- Harris MB, Chang CC, Berton MT, Danial NN, Zhang J, Kuehner D, Ye BH, Kvatyuk M, Pandolfi PP, Cattoretti G, Dalla-Favera R, Rothman PB 1999 Transcriptional repression of Stat6-dependent interleukin-4-induced genes by BCL-6: specific regulation of iepsilon transcription and immunoglobulin E switching. Mol Cell Biol 19:7264–7275 [DOI] [PMC free article] [PubMed] [Google Scholar]
- Nelson EA, Walker SR, Alvarez JV, Frank DA 2004 Isolation of unique STAT5 targets by chromatin immunoprecipitation-based gene identification. J Biol Chem 279:54724–54730 [DOI] [PubMed] [Google Scholar]
- Bereshchenko OR, Gu W, Dalla-Favera R 2002 Acetylation inactivates the transcriptional repressor BCL6. Nat Genet 32:606–613 [DOI] [PubMed] [Google Scholar]
- Niu H, Ye BH, Dalla-Favera R 1998 Antigen receptor signaling induces MAP kinase-mediated phosphorylation and degradation of the BCL-6 transcription factor. Genes Dev 12:1953–1961 [DOI] [PMC free article] [PubMed] [Google Scholar]
- Diehl SA, Schmidlin H, Nagasawa M, van Haren SD, Kwakkenbos MJ, Yasuda E, Beaumont T, Scheeren FA, Spits H 2008 STAT3-mediated up-regulation of BLIMP1 Is coordinated with BCL6 down-regulation to control human plasma cell differentiation. J Immunol 180:4805–4815 [DOI] [PMC free article] [PubMed] [Google Scholar]
- Tran TH, Utama FE, Lin J, Neilson LM, Sjolund AB, Rui H, Prolactin inhibits expression of B-cell lymphoma 6 (BCL6) in breast cancer through a Stat5 dependent mechanism. Program of the 90th Annual Meeting of The Endocrine Society, San Francisco, CA, 2008, p 634 (Abstract P3-135) [Google Scholar]
- Ye BH, Cattoretti G, Shen Q, Zhang J, Hawe N, de Waard R, Leung C, Nouri-Shirazi M, Orazi A, Chaganti RS, Rothman P, Stall AM, Pandolfi PP, Dalla-Favera R 1997 The BCL-6 proto-oncogene controls germinal-centre formation and Th2-type inflammation. Nat Genet 16:161–170 [DOI] [PubMed] [Google Scholar]
- Yoshida T, Fukuda T, Hatano M, Koseki H, Okabe S, Ishibashi K, Kojima S, Arima M, Komuro I, Ishii G, Miki T, Hirosawa S, Miyasaka N, Taniguchi M, Ochiai T, Isono K, Tokuhisa T 1999 The role of Bcl6 in mature cardiac myocytes. Cardiovasc Res 42:670–679 [DOI] [PubMed] [Google Scholar]
- Dent AL, Shaffer AL, Yu X, Allman D, Staudt LM 1997 Control of inflammation, cytokine expression, and germinal center formation by BCL-6. Science 276:589–592 [DOI] [PubMed] [Google Scholar]
- Parikh H, Carlsson E, Chutkow WA, Johansson LE, Storgaard H, Poulsen P, Saxena R, Ladd C, Schulze PC, Mazzini MJ, Jensen CB, Krook A, Björnholm M, Tornqvist H, Zierath JR, Ridderstråle M, Altshuler D, Lee RT, Vaag A, Groop LC, Mootha VK 2007 TXNIP regulates peripheral glucose metabolism in humans. PLoS Med 4:e158 [DOI] [PMC free article] [PubMed] [Google Scholar]
- Hogan JC, Stephens JM 2005 The regulation of fatty acid synthase by STAT5A. Diabetes 54:1968–1975 [DOI] [PubMed] [Google Scholar]
- White UA, Coulter AA, Miles TK, Stephens JM 2007 The STAT5A-mediated induction of pyruvate dehydrogenase kinase 4 expression by prolactin or growth hormone in adipocytes. Diabetes 56:1623–1629 [DOI] [PubMed] [Google Scholar]
- Shang CA, Waters MJ 2003 Constitutively active signal transducer and activator of transcription 5 can replace the requirement for growth hormone in adipogenesis of 3T3-F442A preadipocytes. Mol Endocrinol 17:2494–2508 [DOI] [PubMed] [Google Scholar]
- Kawai M, Namba N, Mushiake S, Etani Y, Nishimura R, Makishima M, Ozono K 2007 Growth hormone stimulates adipogenesis of 3T3-L1 cells through activation of the Stat5A/5B-PPARγ pathway. J Mol Endocrinol 38:19–34 [DOI] [PubMed] [Google Scholar]
- Foster CM, Hale PM, Jing HW, Schwartz J 1988 Effects of human growth hormone on insulin-stimulated glucose metabolism in 3T3-F442A adipocytes. Endocrinology 123:1082–1088 [DOI] [PubMed] [Google Scholar]
Associated Data
This section collects any data citations, data availability statements, or supplementary materials included in this article.