Abstract
Propofol, like most general anesthetic drugs, can induce both behavioral and electroencephalographic (EEG) manifestations of excitation, rather than sedation, at low doses. Neuronal excitation is unexpected in the presence of this GABAA-potentiating drug. We construct a series of network models to understand this paradox. Individual neurons have ion channel conductances with Hodgkin–Huxley-type formulations. Propofol increases the maximal conductance and time constant of decay of the synaptic GABAA current. Networks range in size from 2 to 230 neurons. Population output is measured as a function of pyramidal cell activity, with the electroencephalogram approximated by the sum of population AMPA activity between pyramidal cells.
These model networks suggest propofol-induced paradoxical excitation may result from a membrane level interaction between the GABAA current and an intrinsic membrane slow potassium current (M-current). This membrane level interaction has consequences at the level of multicellular networks enabling a switch from baseline interneuron synchrony to propofol-induced interneuron antisynchrony. Large network models reproduce the clinical EEG changes characteristic of propofol-induced paradoxical excitation. The EEG changes coincide with the emergence of antisynchronous interneuron clusters in the model networks. Our findings suggest interneuron antisynchrony as a potential network mechanism underlying the generation of propofol-induced paradoxical excitation. As correlates of behavioral phenomenology, these networks may refine our understanding of the specific behavioral states associated with general anesthesia.
Keywords: propofol anesthesia, paradoxical excitation, GABAA, M-current, EEG, beta rhythms
Introduction
General anesthesia is defined as a reversible, drug-induced conjunction of four behavioral states: analgesia, amnesia, immobility, and loss of consciousness. Despite extensive knowledge of the molecular targets of general anesthetic drugs, the mechanism of anesthetic action in the CNS remains elusive. One commonly used monitor of brain electrical activity during general anesthesia is the record of cortical voltage oscillations detectable at the scalp known as the electroencephalogram (EEG) (Rampil, 1998). The EEG changes as a patient passes into deeper planes of general anesthesia (John et al., 2001). EEG slowing generally accompanies loss of consciousness. An unexpected phenomenon, however, occurs with low doses of some kinds of general anesthesia in which the patient becomes increasingly excited. This state is marked by disinhibition and loss of both motor and affective control (Fulton and Mullen, 2000). The EEG also depicts a picture of CNS excitation during this phase, with increased oscillatory activity in the higher beta frequency bands (12.5–25 Hz) and decreased activity in slower frequency bands (3.5–12.5 Hz) (Gugino et al., 2001). This state, referred to as paradoxical excitation, is encountered with many sedative and general anesthetic drugs (Gibbs et al., 1937). A common general anesthetic induction agent, propofol (2,6-diisopropylphenol), which potentiates GABAA currents (Bai et al., 1999), is one such drug that induces paradoxical excitation at low doses (Borgeat et al., 1997). A cohesive representation of brain activity requires integration of the paradoxical coexistence of cellular level inhibition with systems level excitation. Any resolution to this paradox will likely include understanding the dynamics of the brain at the intermediate level of functioning, that of neural networks.
Mathematical modeling is used extensively in computational neuroscience to study network level phenomena (Koch and Segev, 1999). Mathematical modeling, however, has not been used extensively to study the mechanism of action of general anesthesia. Here, we develop a series of mathematical network models of neurons with Hodgkin–Huxley-type formulations to investigate the dynamics that emerge in both large and small networks with the addition of low-dose propofol. We discover that the EEG changes associated with paradoxical excitation can arise in these networks out of an interaction between the synaptic GABAA current and an intrinsic membrane slow-potassium current (M-current) that leaves the postsynaptic neuron in a more excited state over a portion of its interspike interval. This interaction occurs only at low doses of propofol, whereas postsynaptic inhibition dominates with higher, anesthetic doses of propofol. One consequence of this membrane level interaction is the network level generation of beta frequency (∼20 Hz) antisynchrony between reciprocally connected interneurons. The GABAA/M-current interaction further results in a tendency of the pyramidal cells to pattern their spiking behavior after the interneuron beta rhythm. This network mechanism of propofol-induced EEG changes potentially has significant bearing on our understanding of “excitatory beta behavior” in drug-induced states, as well as the prevalence of EEG beta rhythms in both normal motor and emotional states (Ray and Cole, 1985; Kilner et al., 1999).
Materials and Methods
Definition of low-dose propofol, and behavioral and EEG phenomenology of paradoxical excitation
Excitatory behavior in the presence of an otherwise sedative drug is the characteristic presentation of paradoxical excitation. Behavioral manifestations of paradoxical excitation include disinhibition of motor and affective functioning: spontaneous movements, restlessness, agitation, talkativeness, hostility, violence, rage (Fulton and Mullen, 2000), small, spontaneous muscle movements (Sneyd, 1992), or dystonic or choreiform movements of the arms and legs during induction (Borgeat et al., 1991). This excitation is unexpected in the presence of a GABAA-potentiating drug such as propofol. Propofol dose-dependently potentiates the GABA response (Adodra and Hales, 1995), and thus only relatively small amounts of GABAA potentiation are necessary for low doses of propofol to induce the state of paradoxical excitation. General anesthesia is realizable in 50% of people when the free aqueous concentration (EC50) of propofol in the blood reaches 0.4 μm (Franks and Lieb, 1994). This concentration of propofol potentiates the GABA response by ∼200% (Adodra and Hales, 1995). We expect this level of GABAA potentiation is approximately the upper limit for the production of paradoxical excitation. Thus, we define low-dose propofol as a dose that potentiates the baseline GABAA response by up to 200%.
One measure of neuronal population activity in the cortex is the trace of voltage oscillations recorded at the scalp in the EEG (Nunez and Srinivasan, 2006). Frequency information extracted from the EEG correlates with both normal and abnormal behavioral, affective, and cognitive states (Ray and Cole, 1985; Niedermeyer and Lopes da Silva, 1999). The EEG during propofol-induced paradoxical excitation depicts a picture of CNS excitation in which voltage oscillations tend to increase in higher frequency bands. Specifically, doses of propofol associated with paradoxical excitation result in increased EEG power in the beta range (12–25 Hz) accompanied by decreased power in the lower frequency alpha (7.5–12.5 Hz) and theta (3.5–7.5 Hz) bands (Gugino et al., 2001).
There is no clear evidence we know of for changes in the gamma power at the low level of propofol that we use, although there are suggestions that it may decrease. One human EEG study looking at gamma rhythm changes with propofol shows gamma decreasing at lead Cz at a dose between 0 and one-third of the burst suppression dose (this study also shows a rise in delta, theta, and alpha powers at this dose as well as an increase in gamma at locations within the medial temporal lobe) (Fell et al., 2005). However, because one-third of the burst suppression dose is ∼3.2 μg/ml (Mustola et al., 2003) and is within the hypnosis-inducing dosage range, we cannot say these EEG results truly reflect those seen with low-dose propofol. Propofol has also been shown to cause a concentration-dependent decrease in the gamma oscillation frequency in rat hippocampus in vitro (Dickinson et al., 2003). The lowest concentration of propofol used in this study was 1 μm, which is above what we consider the EC50 of propofol. Another study shows a concentration-dependent decrease in the minimum gamma oscillation frequency with propofol, although by gamma they refer to frequencies we consider high beta; moreover, the maximum gamma oscillation frequency does not decrease at their lowest dose (0.5 μm) (Whittington et al., 1996). Although these studies are suggestive of a low-dose propofol-induced power decrease in the lower gamma range, we are not aware of any study of propofol on gamma rhythms that looks at the dose of propofol we consider low dose (less than the EC50 of 0.4 μm).
Most of the EEG signal is thought to derive from the synchronous activation of cortical layer V and layer III pyramidal cells (Murakami and Okada, 2006). The EEG thus provides us with a degree of quantification of the cortical system excitation that we see expressed behaviorally during general anesthesia-induced paradoxical excitation. The EEG also provides an important link between dynamics at the cellular level and those at the systems level of brain functioning. We use the paradoxical correspondence between cellular-level inhibition (propofol-induced GABAA potentiation) and systems-level excitation (beta frequency EEG) to begin investigating possible network dynamics at work in cortical systems during paradoxical excitation. In describing the dynamics of our models, we use “paradoxical excitation” to mean the EEG phenomenology associated with low-dose propofol.
Computational model
Neurons.
The objective of our mathematical models is to suggest possible cortical network activity involved in the production of propofol-induced paradoxical excitation. We use conductance-based models of cortical pyramidal cells (e-cells) and interneurons (i-cells) to track the effect of propofol-induced GABAA potentiation on individual cells and on networks. We model pyramidal cells, fast spiking interneurons (FS cells) and low-threshold spiking interneurons (LTS cells) as single compartments. Neuronal voltage changes in time according to an equation that equates the capacitive membrane current with the channel currents. This equation is formulated as follows:
 |
The individual collection of membrane and synaptic currents, Imemb and Isyn, respectively, determine the dynamics of each type of neuron. All model neurons contain the spiking currents: a fast sodium current (INa), a fast potassium current (IK), and a leak current (IL). The M-current (IM), a slow-potassium current that we place in our model pyramidal cells and LTS cells (Cunningham et al., 2004), provides these two cell types with spike frequency adaptation. Spike frequency adaptation is not a prominent characteristic of fast spiking interneurons (Kawaguchi and Kubota, 1997; Gibson et al., 1999), and thus our model FS interneurons do not have an M-current.
We use Hodgkin–Huxley-type dynamics to model our neurons. An important feature of Hodgkin–Huxley neurons is that they begin to spike at a well defined frequency (f0) under DC stimulation (Koch, 1999). The Hodgkin–Huxley membrane cannot sustain spiking at frequencies lower than f0. The mechanism underlying this phenomenon is a Hopf bifurcation, a well known mechanism in the production of the onset of oscillatory activity in nonlinear differential equations (Rinzel and Ermentrout, 1999). The frequency at which our pyramidal cells begin to spike under DC stimulation is in the alpha range. In one simulation requiring a lower pyramidal cell baseline spiking frequency, an A-like current (IA) is added to lower f0 into the theta frequency range. Additionally, in some simulations we remove the M-current from the pyramidal cells, which allows f0 to drop below alpha. The background drive (Iapp) is a constant term that determines the frequency of spiking of an individual cell. Neuron heterogeneity is provided by deterministically separating the value of Iapp to each individual cell by at least 0.001 μA/cm2.
Membrane voltage (V) is measured in millivolts. Currents have units in microamperes per square centimeter. The specific membrane capacitance (Cm) is held at 1 μF/cm2 for all simulations.
All membrane and synaptic currents have Hodgkin–Huxley-type conductances formulated as follows:
The activation and inactivation gating variables (m and h, respectively) evolve in time according to a two-state kinetic equation formulated (written for the gating variable m) as follows:
 |
The steady-state function (m∞) and the time constant of decay (τm) are taken from previous models (Mainen and Sejnowski, 1996; Olufsen et al., 2003; Traub et al., 2003). The mathematical formulations for each of these functions, the number of activation and inactivation gates (n and k, respectively), as well as the parameter values for the maximal conductance (ḡ) and reversal potential (Eion) of each cellular current are provided in Appendix. Equations 1, 2, and 3 completely describe the membrane properties of a neuron and its associated dynamics.
Networks.
Our models contain two types of synaptic currents (Isyn), AMPA currents (IAMPA), and GABAA currents (IGABAA) modeled using Hodgkin–Huxley dynamics formulated as follows:
Each synaptic current has a single activation gate that depends on the voltage of the presynaptic neuron (vpre). The activation gate has kinetics described by Equation 3. The equations for the time constant and steady-state functions associated with the gating variable for each synaptic current, as well as the values of synaptic conductances and reversal potentials, are detailed in Appendix.
Large networks consist of 220–230 neurons. We choose the proportion of pyramidal cells to interneurons (200:20 to 200:30) slightly larger than histologic studies suggest (Shepherd, 1998) to account for the high electrical connectivity of cortical interneurons (Gibson et al., 1999) not explicitly modeled in these networks. Each interneuron thus represents a lumped population of electrically coupled interneurons. Two types of interneuron populations are modeled: FS cells and LTS cells. Large networks contain either one type of interneuron or both types in equal proportions. These networks have an all-to-all synaptic connection scheme between interneurons and pyramidal cells, as well as between all interneurons of the same type. No synaptic connections exist between FS cells and LTS cells or between pyramidal cells. The background drive term (Iapp) assumes the function of excitatory input to all neuronal subtypes. This term accounts for the sum of all the cortical and subcortical input to the neuron that is not explicitly modeled in these networks. Pyramidal cells are given a background drive of sufficient magnitude to produce individual spiking frequencies within the range of 6–40 Hz either in isolation or connected to one interneuron. In contrast, the Iapp term for both types of interneurons is insufficient to result in spontaneous spiking activity. The interneurons function as local feedback inhibitors and thus spike in response to AMPA input from nearby pyramidal cells rather than receiving their primary source of excitation from more distant sources. Heterogeneity is added by separating the values of Iapp by 0.001 for interneurons and by 0.005 for pyramidal cells.
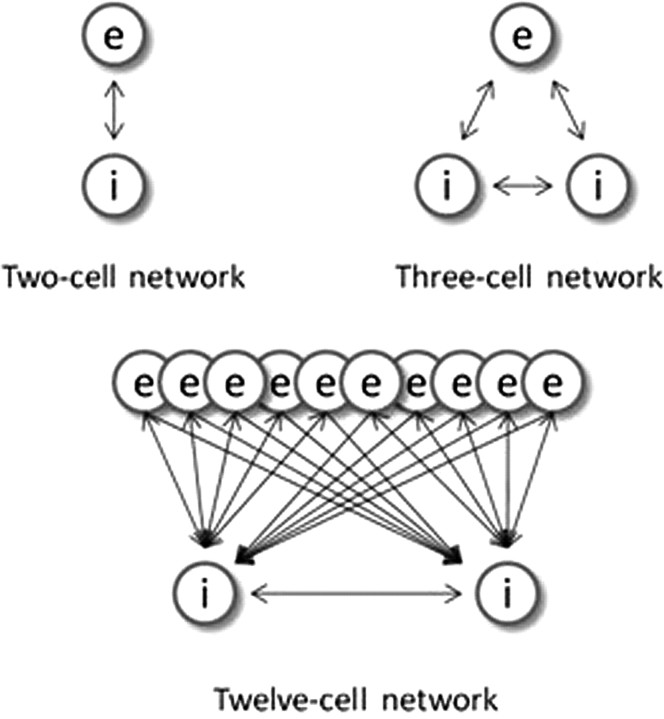
Smaller network constructions include two-cell and three-cell models (Fig. 1) that also use an all-to-all connection scheme. For these models, interneurons consist of either FS cells or LTS cells, but not both cell types, for any particular simulation. A medium-size network (Fig. 1) of 12 cells (10 pyramidal cells and two LTS interneurons) has all-to-all pyramidal cell to interneuron connections and more local (each LTS interneuron connects to one-half of the pyramidal cells) inhibition.
Figure 1.
Small network connection schemes. Pyramidal cells are represented by the letter “e,” and interneurons denoted by the letter “i.” The double arrows represent reciprocal connections. The single arrows indicate one-way connections.
Noise.
Noise provides our networks with a test of robustness and also provides the variability needed to prevent excess synchrony. We simulate background noise in our large model by appending a stochastic term to Iapp in the pyramidal cells. Oscillations are prevalent in neural systems (Traub et al., 1999). Thus, the sum of all inputs to the cortical neurons will necessarily have spectral characteristics. Subthreshold voltage oscillations provide some insight regarding the spectral characteristics of the background noise. At least one study characterizes the spectral content of subthreshold voltage noise in neocortical pyramidal cells (Jacobson et al., 2005). We use a second-order autoregressive model to approximate their results. Thus, our spectral noise term (Ispec) is formulated as follows:
The variable ε represents Gaussian random noise. The regression coefficients (α1 and α2) are constants that determine the spectral content of the noise. Details of the estimation procedure used to find appropriate regression coefficients can be found in Appendix.
We have described the model for the baseline state of our model neurons and networks and the equations that control their dynamics. We now describe how propofol potentially acts on such networks.
Propofol
Propofol potentiates the GABAA current (IGABAA) by altering the kinetics of channel opening (Bai et al., 1999). We model the action of propofol on the GABAA current by increasing its time constant of decay (τGABAA) and its maximal conductance (ḡGABAA) in a manner consistent with propofol-induced potentiation of GABA receptors in the presence of relatively high GABA concentration ([GABA] = 100 μm; EC50 of [GABA] = 27 μm) (Adodra and Hales, 1995). These changes to the GABAA receptor dynamics increase the peak amplitude of the GABAA current, lengthen its time in the open state, and increase the amount of current that passes through this receptor at each moment after opening until it returns to its closed state. We choose the values of τGABAA and gGABAA to match experimental data showing that the GABA response conductance can increase up to ∼200% of baseline in the presence of low doses of propofol (Adodra and Hales, 1995) [but see Whittington et al. (1996), which suggests that propofol causes a concentration-dependent decrease in IPSC amplitude at propofol concentrations between 0 and 0.5 μm as well as almost no change in the time constant of decay]. We define low-dose propofol as a dose less than the EC50 of propofol. The EC50 of propofol is 0.4 μm (Franks and Lieb, 1994). Another study suggests that the EC50 concentration of propofol is 1.5 μm (Violet et al., 1997). However, given that a propofol plasma concentration of ∼2 μg/ml, which equals 11.2 μm, is needed for propofol anesthesia (Miller, 2000) and that at most 3.4% of plasma propofol is free (at most 1.7% of whole blood propofol is free and nonplasma elements account for 51% of whole blood) (Mazoit and Samii, 1999), we calculate that the EC50 concentration for propofol is ∼0.38 μm. Therefore, we use the results from Franks and Lieb (1994) stating the EC50 for propofol is 0.4 μm, which is in close agreement with our calculation of the EC50. In some simulations, we introduce a higher, anesthetic dose of propofol. This is a dose of propofol that can induce hypnosis (slightly more than 5 μg/ml) but not a dose that can produce burst suppression (∼9.65 μg/ml) (Mustola et al., 2003), an EEG pattern seen with higher doses of propofol.
In simulations requiring an anesthetic dose of propofol, we increase the maximal conductance and time constant of decay such that the GABAA response conductance is ∼300% of baseline. Additional details are given in Appendix.
Modeling the EEG
We aim to correlate our model networks to the systems behavior manifest in the clinical EEG. Because the same currents serve as the source of both EEG and magnetoencephalogram (MEG) signals (Hari, 1999), we derive our approximation of the EEG from previous work modeling MEG signals (Jensen et al., 2005). We use the sum of all synaptic AMPA currents in the pyramidal cell population to model the EEG. Pyramidal cell-to-pyramidal cell connections do not exist in our networks. However, we calculate the summed magnitude of AMPA currents in a nonspiking pyramidal cell outside our network that receives synaptic input from all our network pyramidal cells. Thus, these AMPA currents approximate currents that affect more distant pyramidal cells, which contribute to the extracellular potentials generating the EEG. However, these currents play no role in the local pyramidal cell dynamics in our model networks. They are used only to approximate the EEG signal. The model of the EEG is thus formulated as follows:
 |
We sum over the number of pyramidal cells (N) in the network population. The maximal AMPA conductance is represented by ḡe, the AMPA gating dynamics are denoted by sj, and V represents the membrane voltage of the pyramidal cell outside our network that receives AMPA synaptic input from all our network pyramidal cells.
We use the multitaper method (Mitra and Bokil, 2007) for calculating the power spectral density for frequencies ranging from 0.1 to 100 Hz. For data tapers, we use seven discrete prolate spheroidal sequences. Absolute power is found for standard frequency bands: delta (0.1–3 Hz), theta (4–8 Hz), alpha (9–11 Hz), beta1 (12–21 Hz), beta2 (22–29 Hz), and gamma (>30 Hz).
Results
In this section, we report the results of simulation studies of paradoxical excitation induced by low-dose propofol. We begin with a large network model and subsequently explore the generative mechanisms of its network dynamics by examining smaller network models.
Cortical model reproduces characteristic EEG changes of propofol-induced paradoxical excitation
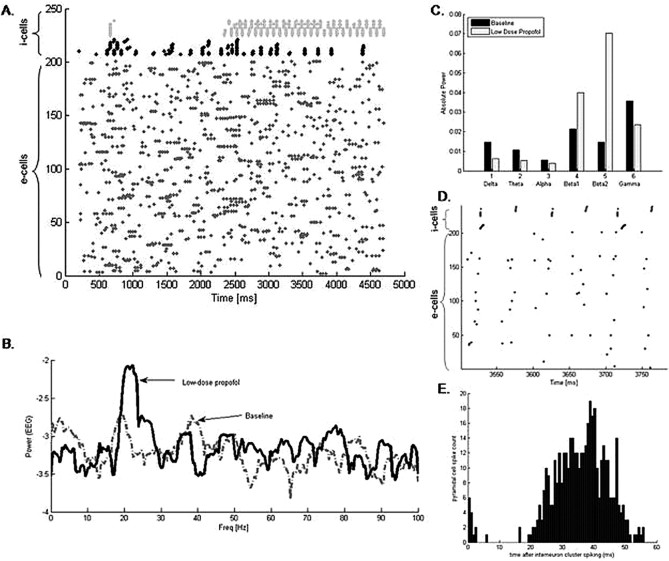
Our large cortical network of 200 e-cells and 30 i-cells displays a distinct switch in dynamics as we potentiate the GABAA receptor consistent with the addition of low-dose propofol. In this large network, baseline conditions result in no distinguishable pattern of spiking activity. FS cells spike sporadically when enough e-cell input is present, and FS cells spike more frequently than LTS cells. However, when we mimic the effect of propofol by increasing the time constant and conductance of the GABAA receptor, the LTS cells spontaneously pattern themselves into antisynchronous clusters (Fig. 2A). The clusters of LTS cells spike with a population frequency of ∼20 Hz. Most of the LTS cells in the network participate in this rhythm. The FS cells do not participate in the antisynchronous rhythm but rather tend to spike more synchronously after the addition of propofol. In our simulated EEG, the power spectral density rises in the beta1 and beta2 frequency bands with the addition of low-dose propofol (Fig. 2B). Absolute power also rises in both the beta1 and beta2 frequency bands and decreases in all the lower frequency bands of delta, theta, and alpha, as well as, in the higher gamma band (Fig. 2C).
Figure 2.
Propofol facilitates the formation of antisynchronous clusters of LTS interneurons. A, A raster plot of the spiking times of 200 e-cells (labeled 1–200 on the y-axis) and 30 i-cells (labeled 210–240 on the y-axis) of which 15 are FS cells (black) and 15 are LTS cells (gray). Each spike time is represented by a dot. Low-dose propofol was added to the system at 2200 ms. The LTS cells spontaneously form antisynchronous clusters after the addition of propofol. B, The spectral density taken from the simulated EEG shows a large increase in power in the beta range with the addition of propofol. C, The absolute power of the simulated EEG rises in both the beta1 and beta2 frequency bands and decreases in the lower frequency bands with the addition of propofol. D, An enlarged portion of the raster plot in A after the addition of low-dose propofol shows e-cell spikes tend to cluster between the antisynchronous LTS cell clusters with the majority of e-cells spiking toward the later one-half of the inter-LTS cell cluster interval. E, A histogram of e-cell spike times after the spiking of an LTS cell cluster reveals the majority of e-cells spike between 20 and 50 ms after an LTS cell cluster spikes.
The EEG is approximated by the sum of AMPA currents within the pyramidal cell population. Thus, the increased beta power in the simulated EEG suggests that the e-cells have been entrained to the i-cell beta rhythm. Enlarging a raster plot of the e-cell and i-cell spike times shows that the e-cells tend to spike between the LTS cell clusters when low-dose propofol is present (Fig. 2D). A histogram of spike times between sequential LTS cell clusters further reveals that the majority of pyramidal cell spikes occur between 20 and 50 ms after the spiking of an LTS cell cluster (Fig. 2E).
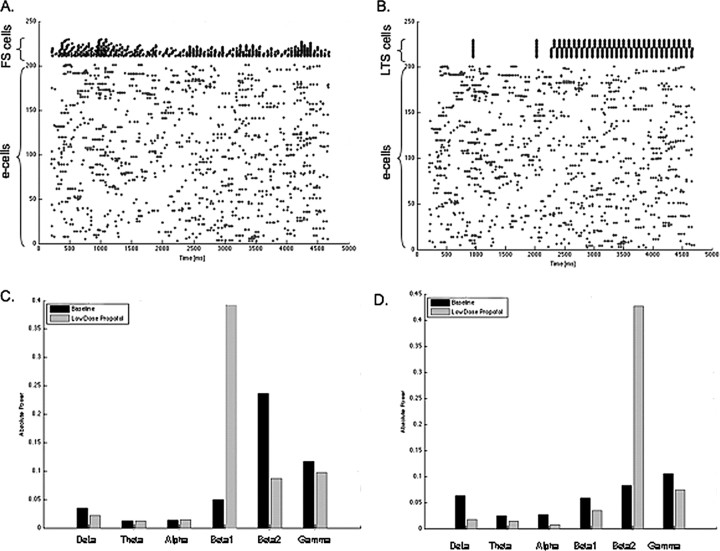
We further examine the individual roles of the two types of interneurons in our model by constructing large models with only one type of interneuron present. Networks with only LTS cells still form antisynchronous clusters of these LTS cells in the presence of low-dose propofol (Fig. 3B). However, spectral analysis of the model EEG shows a rise in power only in the beta2 frequency range with low-dose propofol (Fig. 3D). In networks with only FS cells present, no immediately observable change in the raster plots is apparent other than some increased synchrony among the FS cell population. However, in contrast to the power spectrum that emerges from the network with only LTS cell, this network shows elevation in power only in the beta1 frequency (Fig. 3C). These results lead us to speculate that the rise in beta power seen with low-dose propofol is the result of the combined network activity changes brought about by these two types of interneurons.
Figure 3.
FS cells and LTS cells have different network effects in the presence of low-dose propofol. A, A raster plot of 200 e-cells and 20 FS cells shows FS interneurons tend to synchronize in the presence of low-dose propofol added at 2200 ms. B, A raster plot with 200 e-cells and 20 LTS cells shows LTS cells form antisynchronous clusters in the presence of low-dose propofol added at 2200 ms. C, The absolute power of the model EEG rises sharply the beta1 frequency band in the low-dose propofol condition when only FS interneurons are present in the network. D, The absolute power rises most in the beta2 frequency band in the low-dose propofol condition when only LTS interneurons are present in the network.
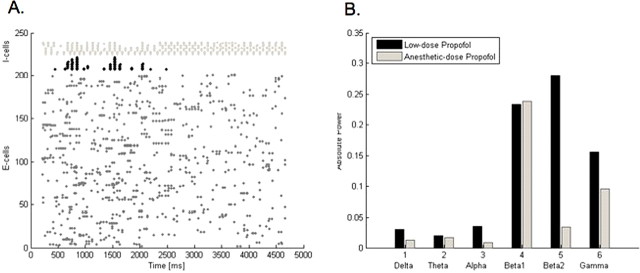
To test whether the above effects are specific to low doses of propofol, we examine the behavior of our large network with a higher, anesthetic dose of propofol. With an anesthetic dose of propofol, the antisynchronous clusters of LTS interneurons remain active, but the FS interneurons become suppressed (Fig. 4A). Furthermore, the power of the fastest rhythms (beta2 and gamma) in our model EEG decreases compared with low-dose propofol as well compared with the no-propofol case (Fig. 4B). The beta1 power stays increased to approximately the same level as with low-dose propofol. The slower rhythms (delta, alpha, and theta) stay below their baseline values. We expect the power in the slower frequency bands to be elevated above baseline with the minimal dose of propofol required to produce loss of consciousness (Gugino et al., 2001). The failure of our large model to reproduce the phenomenology of increased low-frequency EEG power with an anesthetic dose of propofol is most likely attributable to a limitation of model complexity. Nevertheless, we demonstrate that the combined rise in beta1 and beta2 power in our model is specific to low-dose propofol.
Figure 4.
Anesthetic-dose propofol promotes different network behavior in the 230-neuron network than does low-dose propofol. A, A raster plot with 200 e-cells, 15 LTS cells (black), and 15 FS cells (light gray) shows FS cells stop participating in the network rhythm shortly after the addition of an anesthetic dose of propofol, which is added at 2200 ms. In contrast, LTS cells spike in antisynchronous clusters both with low-dose and anesthetic-dose propofol. B, The absolute power in the model EEG is elevated in the beta1 frequency band with both low-dose and anesthetic-dose propofol. However, the anesthetic-dose of propofol correlates with a drop in beta2 and gamma power compared with that seen with low-dose propofol.
Our large cortical model thus provides a view of possible network dynamics underlying the formation of propofol-induced paradoxical excitation. However, given the complexity of this network, it is difficult to understand the fundamental causes of the switching behavior that occurs with GABAA potentiation. We look to smaller models to help us understand the dynamics that we see emerging from our large network model. Specifically, we are interested in explaining the spontaneous emergence of LTS interneuron antisynchrony with GABAA potentiation. We also aim to identify the source of the FS cell-induced increased beta1 power. We are further interested in understanding the source of the additional excitation in the e-cell population as it moves to higher spiking frequencies with the administration of low-dose propofol.
Interaction of the GABAA current and the M-current produces paradoxical excitation in a minimal model
We find that a minimal network of one pyramidal cell and one interneuron of either type reciprocally connected can increase its spiking frequency in response to GABAA potentiation under specific conditions that we now describe.
We can set the periodic, spiking frequency of the system anywhere from alpha to gamma frequency by changing the applied current to the pyramidal cell. Because the pyramidal cell sets the baseline network spiking frequency, and its bifurcation spiking frequency (f0) is in the alpha range, the network is unable to spike below alpha frequency at baseline. However, each neuron in our reduced network represents a population of neurons, and thus the spiking rate of the sole pyramidal cell in our two-cell model represents the entire pyramidal cell population spiking rate.
In all our networks, the primary function of the i-cell is to provide negative feedback in response to e-cell spiking. Thus, we set the magnitude of the applied current of an i-cell such that an i-cell will not spike faster than any e-cell. In this way, an i-cell spikes only in response to e-cell input. If we were to allow the i-cell spiking rate to exceed that of the e-cell, the e-cell would be suppressed, effectively removing it from the network. For these reasons, the interneuron is not allowed to spike faster than the pyramidal cell.
An unexpected phenomenon arises when we start the e-cell spiking in the alpha frequency range (9–11 Hz). In this case, simulating the addition of low-dose propofol to the system results in an increase of the population frequency into the low beta range (15 Hz) (Fig. 5B). The expression of this excitation is generated solely by potentiating the only inhibitory component of our system, the GABAA receptor, making it a paradoxical phenomenon.
Figure 5.
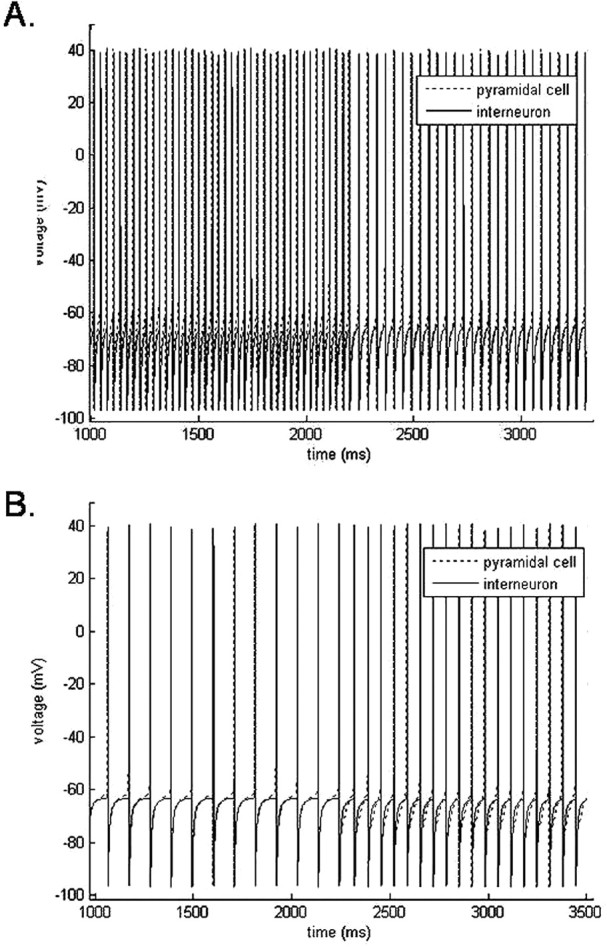
Two sources of propofol-induced beta emerge from the two-cell network. A, A baseline gamma frequency (33 Hz) population rhythm slows to a beta2 frequency (25 Hz) rhythm with the addition of low-dose propofol at 2200 ms. B, A baseline alpha frequency (9 Hz) population rhythm increases to a beta1 frequency (15 Hz) with the addition of low-dose propofol at 2200 ms. In both cases, the pyramidal cell leads the LTS interneuron by a short synaptic delay both before and after the addition of propofol.
Setting the baseline frequency of this two-cell system in the gamma range between 30 and 41 Hz, we see a decrease in the oscillation frequency of the system into the high beta range, 23.5–29.5 Hz, with the addition of low-dose propofol to the system (Fig. 5A). This is the expected behavior of the system after increasing the time constant and conductance of the GABAA receptor. This displays the emergence of beta frequency rhythms from the slowing of gamma rhythms consistent with results showing that propofol causes a concentration-dependent decrease in the gamma oscillation frequency in rat hippocampus in vitro (Dickinson et al., 2003).
Beginning our two-cell model with a baseline frequency in the midbeta range (∼20 Hz), we observe that the addition of low-dose propofol to the system results in little or no frequency change to the system. The population frequency, if it does change, changes by such a small amount that it remains in the mid-beta range. Thus, low-dose propofol does not appear to have any significant effect on the frequency of this system in the mid-beta frequency range.
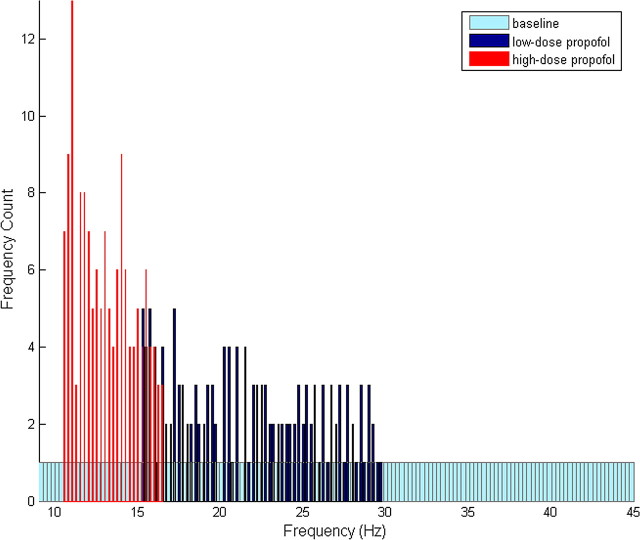
These simulations indicate that low-dose propofol tends to promote the convergence of high and low baseline frequency oscillations into the beta frequency range. To demonstrate this phenomenon more explicitly, we run a set of simulations with baseline frequencies uniformly distributed from the alpha to the gamma frequency range. We run the same simulations with the addition of low-dose propofol and plot a histogram of the frequencies that emerge from each of these conditions. The histogram reveals an increase in beta frequency oscillations in the presence of low-dose propofol along with a decrease in both low-frequency alpha and high-frequency gamma oscillations (Fig. 6). If we run the same set of simulations with a higher, anesthetic dose of propofol, we note that all frequencies tend toward the lower alpha and beta1 regions (Fig. 6). The latter result is consistent with the phenomenology expected in the presence of GABAA potentiation. The increase in beta frequency rhythms in the presence of low-dose but not anesthetic-dose propofol suggests that the mechanism leading to paradoxical excitation is dependent on the magnitude of GABAA potentiation. A small amount of GABAA potentiation results in membrane excitation, whereas larger amounts of GABAA potentiation result in depression of membrane excitability. This result is in agreement with the behavioral and EEG manifestations of the stage of paradoxical excitation in human patients, which emerge only with low doses of propofol and disappear as the dose is increased.
Figure 6.
Propofol changes the distribution of the frequency of oscillations of two-cell networks. Histograms show the distribution of the frequency of oscillations of 145 independently oscillating two-cell networks at baseline and with low and anesthetic doses of propofol. The system is given a uniform distribution of baseline oscillation frequencies. Spikes were counted over a 4 s time window for each category, and each histogram was constructed using 145 bins. The small amount of variability observed in these histograms most likely results from the short time window over which the spikes were counted.
Because our e-cells at baseline do not spike below alpha frequency, we cannot from this model test to what extent propofol increases the frequency of baseline rhythms lower than alpha. However, we note that low-dose propofol can produce spiking activity in the alpha to beta1 range from cells that are quiescent at baseline (data not shown).
Additional examination of this system reveals that paradoxical excitation from alpha to low beta only occurs with the presence of the M-current in the e-cell. Removal of the M-current from the e-cell results in the expected slowing of a baseline alpha (9 Hz) rhythm to a slightly slower rhythm (8 Hz). We also note that removal of the M-current from the i-cell does not affect the phenomenon of paradoxical alpha to beta1 excitation. From this, we gain the insight that it is specifically the dynamical interaction of the GABAA current with the M-current, not the action of either current individually, which brings about increased excitation of the neuronal membrane. Furthermore, excitation induced only at low frequencies indicates that the GABAA/M-current interaction has a time dependence, evolving fully only with a sufficiently long interspike interval.
In summary, two conditions are necessary in order for our two-cell network to increase its spiking frequency in response to GABAA potentiation: the presence of an M-current in the e-cell and an e-cell spiking frequency that is low (less than beta1) at baseline. We next consider the GABAA/M-current interaction in more detail.
The GABAA current reduces the M-current
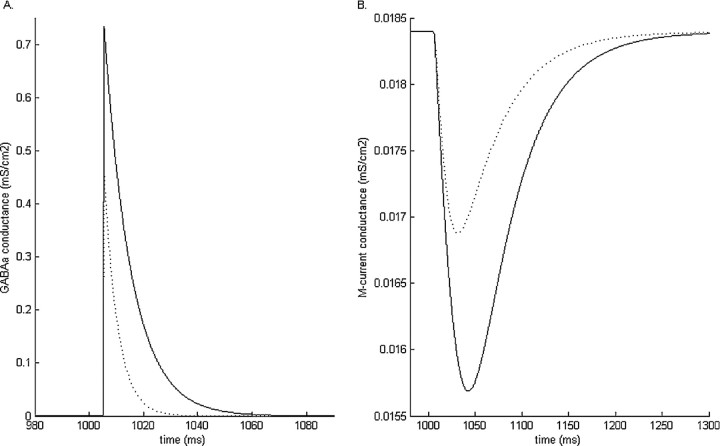
Simulations of a single-compartment neuron containing only the spiking currents, the M-current, and a GABAA-synaptic current reveal the nature of the interaction that occurs between the GABAA current and the M-current. In a resting neuron, the GABAA current will reliably cause a decrease in the M-current conductance (Fig. 7). Increasing the amplitude or the time constant of decay of the GABAA receptor results in a correspondingly larger reduction of the M-current conductance (Fig. 7). The source of GABAA-induced M-current reduction is understood by examination of the equations governing the M-current dynamics. GABAA-induced hyperpolarization both decreases the fraction of open M-current channels and brings the membrane potential closer to the M-current reversal potential, both working together to effectively reduce the membrane M-current.
Figure 7.
Simulation results of the GABAA conductance (A) and the M-current conductance (B) in a model pyramidal cell at baseline (dashed line) and with low-dose propofol (solid line). Low-dose propofol-induced potentiation of the GABAA conductance results in a greater reduction of the M-current conductance than that caused by the baseline GABAA condition.
The M-current is a non-inactivating current with a slow and voltage-dependent time constant of decay and can therefore influence membrane dynamics during the interspike interval. The M-current is also an outward, potassium current that normally acts to stabilize the membrane against excitability. Reduction of this current increases membrane excitability leading to increased spiking frequency in a periodically oscillating system. This then gives us a basis for understanding the generation of the paradoxical excitation that we observe in our two-cell system. Increased membrane excitability occurs during the interspike interval after GABAA potentiation because of an increased reduction of the M-current. This results in an increase in the spiking frequency of pyramidal cells that have a low intrinsic spiking frequency at baseline.
GABAA-induced excitation is frequency and phase dependent
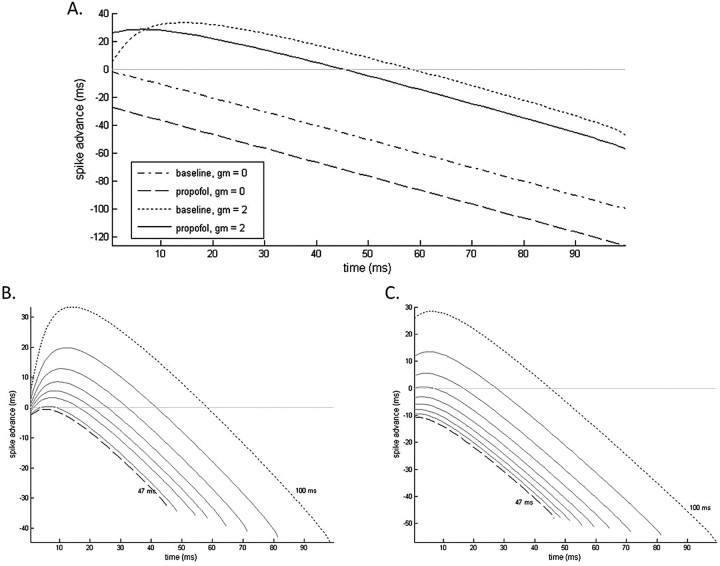
It is important to note that GABAA-induced suppression of the M-current is a temporal phenomenon limited to a portion of the interspike interval. The extent of M-current suppression varies across the length of the interspike interval because of its slow and voltage-dependent decay kinetics. The resultant membrane voltage during the interspike interval is an outcome of the competition between the hyperpolarizing GABAA current and the depolarizing force caused by M-current suppression. We can appreciate these dynamics more fully by examining the spike time response curves (STRCs) of an oscillating pyramidal cell given GABAA inhibition at various times during its spiking cycle. We first notice from these STRCs that, without an M-current present in the pyramidal cell, GABAA inhibition always results in a delay of the pyramidal cell spiking response (Fig. 8A). The M-current must be present in the pyramidal cell for a spike advance to take place. The STRCs further reveal that an advance of pyramidal cell spiking only takes place if inhibition comes during approximately the first one-half of the 10 Hz spiking cycle (Fig. 8A). Delay of pyramidal cell spiking takes place when inhibition arrives during the later one-half of the cycle. This suggests that additional membrane excitability because of M-current suppression is realizable only after GABAA-induced membrane hyperpolarization has decayed enough to allow for the expression of the suppressed M-current.
Figure 8.
A, e-cell STRCs to GABAA inhibition both with and without M-current present in the e-cell. GABAA kinetics are simulated at baseline and with low-dose propofol. STRCs for periodically spiking e-cells with spiking cycles varying between 47 ms (dashed line) and 100 ms (dotted line) are shown at baseline (B) and in the presence of low-dose propofol (C).
This last result further implies that, if the interspike interval is of short enough duration, the membrane depression caused by the GABAA current will dominate any of the excitatory effects caused by suppression of the M-current. This is precisely what we observe in our two-cell model in which GABAA-induced membrane excitation only occurs with low baseline e-cell spiking rates (large interspike intervals) in the alpha or beta1 frequency ranges. Higher baseline spiking rates in the gamma frequency range are associated with slowed spiking rates in the presence of low-dose propofol. Mechanistically, the underlying cause of this discrepancy relates to the time contingency of M-current expression on the decay kinetics of the dominating GABAA current. To examine this phenomenon more explicitly, we look at the STRCs of pyramidal cells oscillating with progressively shorter periods. We note that, in the absence of propofol, with interspike intervals below ∼47 ms (oscillation frequency of 21 Hz), pyramidal cell spikes no longer advance with GABAA inhibition (Fig. 8B). Pyramidal cells with longer periods of oscillation will show spike advances for at least a portion of their STRCs. STRCs constructed using the low-dose propofol condition show pyramidal cells stop advancing with interspike intervals ∼65 ms (∼15 Hz), although over most of this range (interspike intervals of 65–100 ms) there is a much greater initial advance with GABAA potentiation than at baseline (Fig. 8C).
The STRCs further show that the increased membrane excitation because of propofol-potentiated GABAA receptors is restricted to approximately the first 7 ms after a low-frequency spiking pyramidal cell spikes. However, given that both FS cells and LTS cells act solely as feedback inhibitors, this is exactly the period of time in which the inhibition will occur. GABAA inhibition tends to fall between 2 and 2.5 ms after pyramidal cell spiking in our model neurons. Thus, GABAA inhibition with propofol-altered kinetics can advance the next spike of a 10 Hz spiking cell by ∼36 ms. The baseline advance in these postspike milliseconds is ∼18 ms. We thus see a substantial increase in the frequency of oscillations with the addition of low-dose propofol to our two-cell system.
In summary, our analysis suggests that the interaction between the kinetics of the GABAA current and the M-current, specifically their respective decay kinetics during the interspike interval, determines much of the postspiking temporal structure of membrane excitability. Of note is that only neurons with relatively long interspike intervals (greater than ∼84 ms) can support GABAA-induced increased membrane excitability and thus express propofol-induced paradoxical excitation. Therefore, in the presence of low doses of propofol, we expect low-frequency spiking cells (less than beta1) to increase their spiking frequency. This provides a potential mechanism by which we may observe a net loss of lower frequency spiking cells and a simultaneous increase in the number of higher frequency spiking cells.
GABAA/M-current interaction produces antiphase LTS interneurons
Using the three-cell model, we increase the complexity of the model minimally with the addition of an inhibitory neuron. Both model interneurons are LTS cells. We establish all-to-all connections between the three model neurons. As in the case of the two-cell model, we can set the population frequency of this slightly more complex model to any frequency from theta to gamma by changing the value of the applied current to the pyramidal neuron. We are able to obtain a minimal spiking frequency (f0) lower than alpha in the pyramidal cells by removing the M-current from those cells. We thus set the baseline spiking frequency of the three-cell model to theta by removing the M-current from the pyramidal cell. As we discuss later, M-current is not needed in the pyramidal cell in the three-cell network to produce propofol-induced excitation. We set the applied current to the LTS interneurons so that they respond with a spike to e-cell input, but they have no intrinsic spiking frequency of their own. Because the pyramidal cell sends excitatory input to both LTS cells, the LTS cells spike almost synchronously and are phase-locked to the excitatory cell after a short synaptic delay. Thus, the population frequency of the network at baseline is controlled by the frequency of oscillation of the pyramidal cell.
This three-cell model undergoes a dramatic switch in network behavior with the addition of low-dose propofol. Starting the e-cell spiking in theta frequency range, the baseline population synchrony is broken, as we potentiate the GABAA receptor, by the spontaneous formation of LTS interneuron antisynchrony (Fig. 9A). The LTS interneurons spike as a population in the midbeta frequency range (∼20 Hz). This rhythm is self-sustained and independent of pyramidal cell spiking. The switch to antisynchrony results in a frequency that can be more than double of the LTS interneuron baseline population frequency. In Figure 9A, we see the LTS interneuron population frequency jump from 7 Hz at baseline to 19 Hz with low-dose propofol. This higher interneuron population frequency suppresses all spiking from the pyramidal cell, which has an intrinsic spiking rate in the theta frequency range, but which is now bombarded with midbeta frequency inhibition. Thus, the population frequency, although in midbeta, reflects solely LTS interneuron activity. In this three-cell network, we see the emergence of a mechanism for paradoxical excitation reminiscent of the phenomenology observed in our large cortical model, specifically, the spontaneous formation of LTS interneuron antisynchrony.
Figure 9.
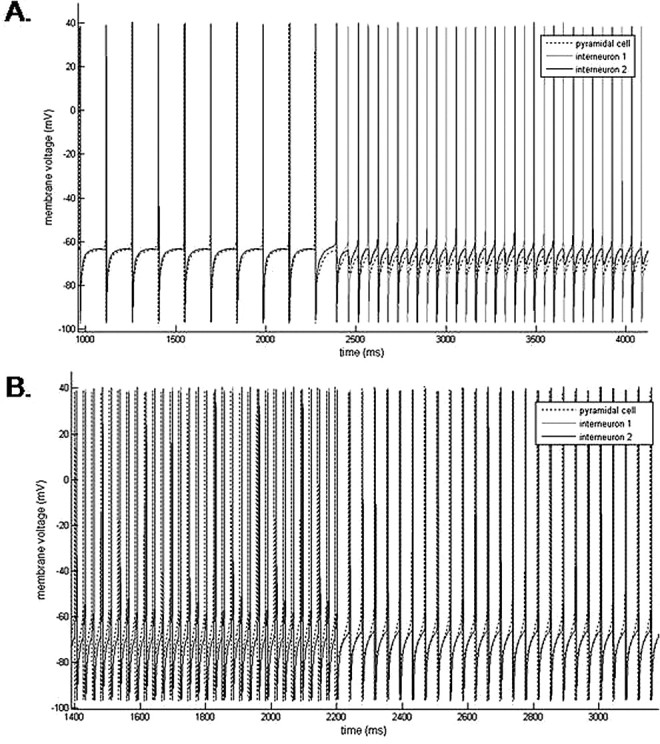
The three-cell network generates beta frequency population spiking with the addition of low-dose propofol by two mechanisms. A, A baseline theta frequency (7 Hz) population rhythm increases to a midbeta frequency (19 Hz) population rhythm with the addition of low-dose propofol. After the addition of propofol, the LTS interneurons form a 19 Hz antisynchronous rhythm. The antisynchronous LTS interneuron rhythm suppresses pyramidal cell spiking. At baseline, all three neurons spike together with the pyramidal cell leading the LTS interneurons by a short synaptic delay. B, A baseline gamma frequency (38 Hz) population rhythm slows to a beta2 frequency (25 Hz) rhythm with the addition of low-dose propofol. The pyramidal cell drives the LTS interneurons to spike synchronously both before and after the addition of propofol. In both sets of simulations, propofol is added at 2200 ms.
This mechanism is sensitive to changes in the applied current to the LTS interneurons. If the LTS interneuron population spikes at a rate that exceeds the population spiking of the pyramidal neurons, then the pyramidal cells are suppressed, and only the LTS interneuron rhythm remains. Specifically, if the applied current to the LTS interneurons is ≥1.9 μA/cm2, the LTS interneurons will spike antisynchronously at baseline as well as in the presence of low-dose propofol. This effectively removes the pyramidal cell population from our full network. Thus, interesting pyramidal cell–LTS interneuron network dynamics occur only when the population of e-cells spike at a rate higher than that of the interneurons. However, if the applied current to the LTS interneurons is too low (Iapp, <1.81 μA/cm2), the transition to antisynchrony with the addition of low-dose propofol does not occur and the LTS interneurons continue to spike synchronously patterned by the pyramidal cell spikes. We further note that starting the population spiking in the lower gamma range will result in the emergence of a synchronous beta2 rhythm (21–29 Hz) with the addition of low-dose propofol (Fig. 9B). Thus, with the three-cell model, we also see the convergence of high-frequency and low-frequency baseline sources to beta frequency rhythms with low-dose propofol, but with a different mechanism than that of the two-cell model.
The difference in mechanism between the two- and three-neuron models affects their behavior with higher, anesthetic doses of propofol. In the presence of an anesthetic dose of propofol, our three-neuron model continues to spike in the midbeta frequency range. The neurons are not purely antisynchronous but rather spike alternately with pairs of spikes. The anesthetic dose of propofol necessary to produce loss of consciousness not only correlates with increased EEG power in lower frequency bands, but also correlates with increased beta power over baseline (Gugino et al., 2001). The difference in the behavior of the two- and three-neuron models with anesthetic doses of propofol suggests that the increased EEG power in the beta band with anesthetic doses of propofol may originate from LTS cell interactions, whereas the increased power in the lower frequency bands may depend more on FS cell inhibition of pyramidal cells.
As in our two-cell model, we notice that the phenomenon of increasing population frequency with low-dose propofol is dependent on the presence of neuronal M-current, this time in the inhibitory cell: the switch to LTS interneuron antisynchrony in the presence of low-dose propofol does not occur without M-current present in the interneurons. Thus, only interneurons of the LTS cell type produce propofol-induced interneuron antisynchrony in our three-cell model. (FS cells can still produce paradoxical excitation in the three cell model if the e-cell has an M-current. Such a network will result in baseline alpha frequency spiking increasing to beta1 in the presence of low-dose propofol. However, all cells remain synchronous in both the baseline and low-dose propofol cases. This FS cell-induced paradoxical excitation in the three-cell model occurs for the same reasons we have outlined for the two-cell model.) In the three-cell case with LTS cells, the emergence of paradoxical excitation by LTS interneuron antisynchrony is dependent on the presence of the M-current only in the LTS interneurons. Because the LTS interneurons establish the mechanism of paradoxical excitation in the three-cell model, this result suggests that the interaction critical to propofol-induced excitation is again to be found in the dynamical relationship between the intrinsic membrane M-current and the synaptic GABAA current. We therefore examine more closely the GABAA/M-current interaction within the LTS interneurons and its role in modulating the switch between LTS cell synchrony and antisynchrony.
LTS cell synchrony/antisynchrony depends on the timing of GABAA input
Our model LTS interneurons are quiescent if unperturbed. Spiking occurs only in response to a depolarizing input from a pyramidal cell or as a rebound spike generated by a hyperpolarizing current from another interneuron. The mechanism of rebound spiking is GABAA-induced M-current suppression.
As with the periodically spiking e-cell, we examine the effect of GABAA inhibition coming at different stages of an LTS cell action potential cycle. Because the LTS cells do not spike when unperturbed, we look at the rebound spiking behavior of these neurons when inhibition comes at various times postspiking. If rebound spiking occurs, then we construct STRCs to investigate LTS cell spike time response properties.
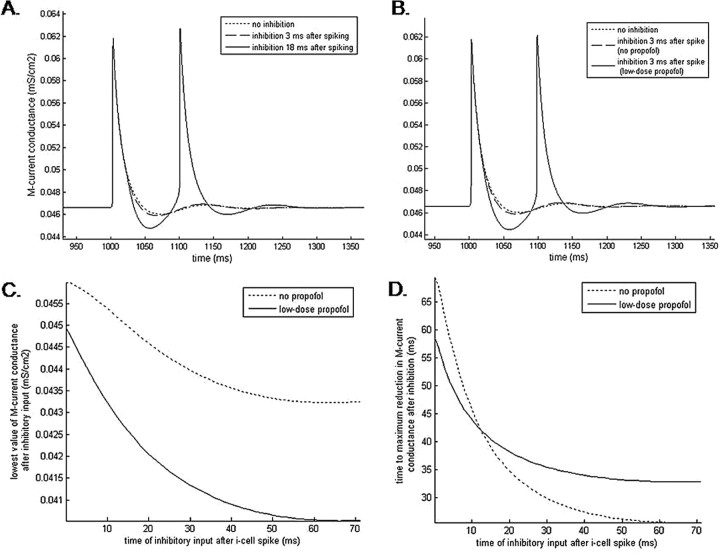
A pulse of inhibition coming immediately after LTS cell excitation results in an IPSP that coincides with the repolarization phase of the action potential cycle. During this phase, the membrane potential is nearer to both the potassium and chloride reversal potentials than it is during rest. This effectively reduces the size of the GABAA current that would be generated if the IPSP came during the resting phase of the cell. Thus, the influence of the GABAA current on the M-current during the repolarization phase is correspondingly reduced: the M-current conductance is only marginally reduced beyond the reduction that normally occurs during each repolarization phase as a result of the hyperpolarization of the membrane (Fig. 10A). This minimal M-current reduction is ineffective in causing the LTS interneuron to deviate from its original behavior. Thus, inhibition coming during the repolarization phase of an LTS interneuron spike will not cause rebound spiking, but rather the LTS interneuron will return to its quiescent state.
Figure 10.
The effect of the GABAA current on the M-current is both phase dependent and propofol dependent. A, Simulation results show the time course of the M-current conductance during and after an LTS cell spike both without postspiking inhibitory input (dotted line) and when inhibitory input follows spiking with delays of 3 ms (dashed line) and 18 ms (solid line). The postinhibitory reduction in M-current conductance increases as the delay to inhibition lengthens. Postinhibitory rebound spiking occurs with sufficient M-current reduction. B, In the presence of low-dose propofol, short (3 ms) time-to-inhibition can cause significant reduction of the M-current conductance sufficient to produce postinhibitory rebound spiking. C, The lowest value of the postspiking M-current conductance decreases as the time-to-inhibition increases. Low-dose propofol consistently causes a larger decrease in M-current conductance than baseline conditions for all inhibitory input times. D, The time after inhibitory input needed to reach the minimum value of M-current conductance progressively shortens with increasing input delay times. Low-dose propofol speeds up the time to reach the minimum M-current conductance only if the inhibitory input arrives within approximately the first 12 ms after neuronal spiking.
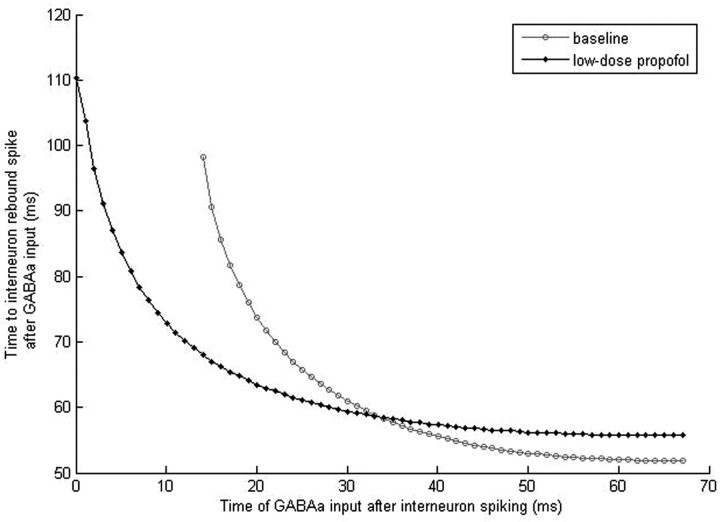
In contrast, if inhibition comes to a resting LTS neuron or to an LTS neuron that is at least 14 ms past its last spike, the incoming IPSP will hyperpolarize the membrane, driving its voltage potential toward −80 mV. As a consequence, the M-current will also be reduced by the mechanisms described above (Fig. 10A). This reduction of the M-current supplies the membrane with enough additional excitation to produce a postinhibitory spike. The rebound spike will occur ∼52 ms after the inhibitory input if the LTS cell starts in a quiescent state or if the cell is ∼45 ms past its last spike (Fig. 11). Inhibition arriving between 14 and 45 ms postspiking will also result in a rebound spike but with longer lag times between the inhibitory input and the rebound spike. These lag times peak at ∼98 ms for inhibition arriving at 14 ms postspiking and monotonically decrease for inhibition arriving at later times (Fig. 11). The decreasing lag times parallel a decrease in M-current conductance observed as the time to inhibitory input is lengthened (Fig. 10C), suggesting a dependence of rebound spike times on the magnitude of the M-current. Because this time-to-rebound is sufficiently long, two LTS cells reciprocally connected will produce an antisynchronous rhythm if one LTS cell is either depolarized and thus produces a hyperpolarization and rebound spike in its neighboring LTS cell, or it is hyperpolarized sufficiently to produce a rebound spike itself. Under these conditions, one LTS cell inhibits the other LTS cell, causing a postinhibitory rebound spike at ∼52 ms. This rebound spike in turn hyperpolarizes the first LTS cell, causing it to rebound spike, and thus antisynchrony is generated with a period of ∼52 ms between spikes. We thus see the creation of a self-sustained antisynchronous LTS interneuron rhythm in the midbeta frequency band.
Figure 11.
Time of the rebound spike of an LTS interneuron given inhibition at various times after spiking. Under baseline conditions, the LTS interneuron will not rebound spike if inhibition comes within the first 14 ms after a spike. Rebound spiking occurs regardless of the time of inhibition in the presence of low-dose propofol.
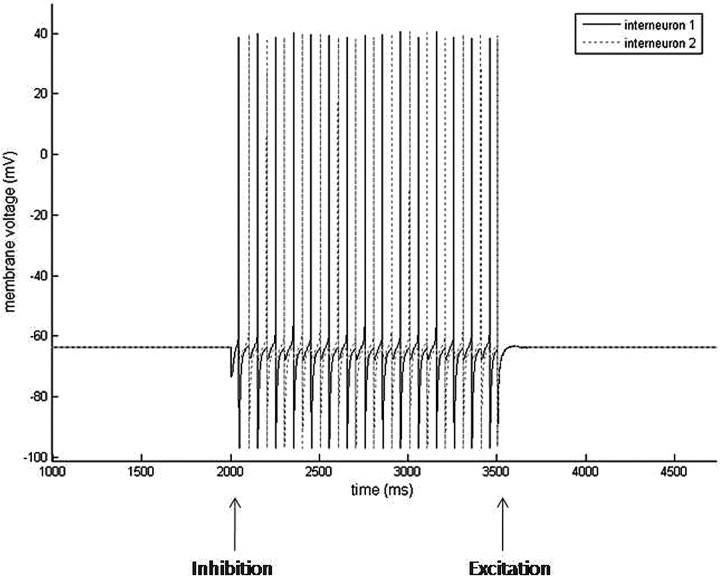
These reciprocally connected LTS interneurons form the foundation for the creation of an easily modulated, self-sustained rhythm. Simultaneous pyramidal cell input to the LTS cells will result in a synchronous LTS cell rhythm driven and rate-determined by the frequency of the pyramidal cell. However, either pyramidal cell input to one LTS cell or inhibitory input to one LTS cell will lead to the emergence of the antisynchronous LTS cell beta rhythm (Fig. 12). This rhythm is immediately terminated by simultaneous e-cell input, which synchronizes the LTS cells, preventing the conditions necessary for rebound spiking (Fig. 12).
Figure 12.
Simulations results of two reciprocally connected LTS interneurons. LTS interneurons are quiescent without perturbation (<2200 ms). External GABAA inhibition is given to one LTS interneuron at 2000 ms. The LTS interneurons respond to GABAA inhibition by forming an antisynchronous rhythm. External AMPA excitation is given to both LTS interneurons at 3500 ms. The LTS interneurons respond to simultaneous AMPA input by returning to their quiescent state.
Propofol blocks the ability of e-cells to entrain LTS cells at low frequencies
With low doses of propofol, the GABAA current is potentiated, which leads to a larger and longer IPSP. Thus, even if a pulse of inhibition arrives during the repolarization phase of a spiking cell, the GABAA current is able to exert enough of an effect over an extended period of time to cause a functionally significant reduction of the M-current (Fig. 10B). With propofol present, the reduction of the M-current conductance resulting from inhibitory input arriving 0.5 ms after LTS cell spiking is approximately equal to the reduction of the M-current conductance that follows inhibitory input 16 ms after spiking under baseline conditions (Fig. 10C). As a result of this enhanced M-current reduction during the repolarization phase, the LTS cell that receives inhibition will generate a postinhibitory rebound spike regardless of the phase of its spiking cycle. Thus, the phase dependence of the postinhibitory rebound spike is lost (Fig. 11). Excitatory inputs are no longer able to entrain the LTS cells to slower theta or alpha rhythms because the spiking of one LTS cell will cause a postinhibitory rebound spike in the other LTS cell that will in turn cause rebound spiking of the first LTS cell. This initiates the formation of the self-sustained LTS interneuron antisynchronous beta rhythm that in turn inhibits the slower e-cell. Thus, in the presence of low-dose propofol, simultaneous excitatory inputs to the LTS cells will result in the generation of LTS cell antisynchrony. Because this rhythm is no longer terminated by simultaneous e-cell input, the rhythm will persist uncontrolled. The rhythm will be at a slightly lower frequency than the baseline rhythm because GABAA potentiation attributable to propofol results in a longer time-to-rebound of ∼56 ms compared with the 52 ms time-to-rebound produced at baseline (Fig. 11). This longer time-to-rebound may be the result of a slower time to maximal M-current conductance reduction in neurons receiving inhibition at least 13 ms postspiking in the presence of propofol (Fig. 10D). To summarize, GABAA potentiation with low doses of propofol results in the loss of control of the e-cell over the LTS cells resulting in e-cell activation, rather than suppression, of the LTS cell beta rhythm.
We also note that, because LTS interneuron rebound spiking occurs ∼90 ms after spiking given our parameters with low-dose propofol, an e-cell must be spiking below ∼11 Hz for LTS interneuron antisynchrony to be established. Simulations verify this result. e-cell spiking rates >11 Hz lead to synchrony of all three cells with the e-cell leading both LTS cells.
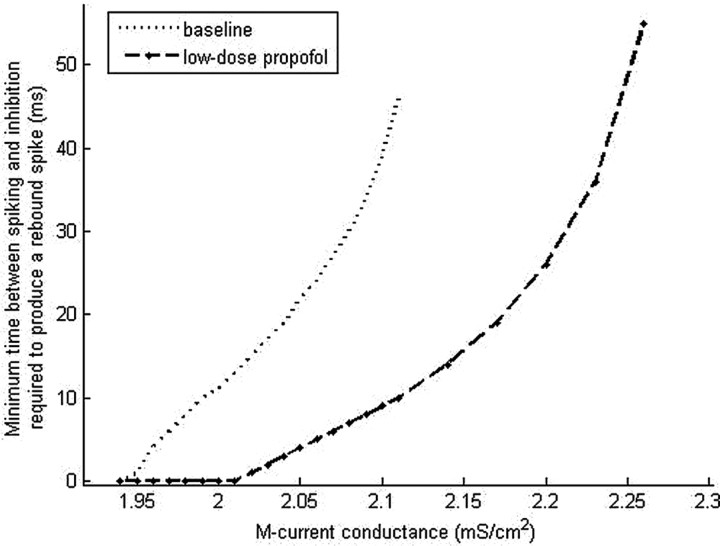
The size of the M-current conductance appears to play a key role in determining the dynamics of rebound spiking. Thus, we examine the dependence of rebound spiking on M-current conductance by varying the maximal M-current conductance. As ḡM is increased, inhibition is unable to produce rebound spiking for longer periods of time after a spike in both the baseline and low-dose propofol cases (Fig. 13). However, the minimal time between spiking and inhibition at which rebound occurs in the presence of low-dose propofol is always less than or equal to that at baseline. Only at the lowest values of ḡM do the baseline and low-dose propofol cases coincide. At these low values of maximal M-current conductance, in both the baseline and low-dose propofol cases, postexcitatory inhibition results in rebound spiking of the LTS cell regardless of the time of the inhibitory input. This suggests that e-cell control over LTS cell antisynchrony is lost even at baseline if the maximal M-current conductance is below ∼1.94 mS/cm2. With higher values of ḡM, the increased minimal time between spiking and inhibition at which rebound occurs suggests that the mechanism of paradoxical excitation that depends on the spontaneous production of LTS interneuron antisynchrony is robust to axonal conduction delays if appropriate levels of ḡM are present in the LTS interneurons. For example, our results predict that a three-cell network with conduction delays of 20 ms and LTS interneurons with a maximal M-current conductance of 2.1 ms/cm2 will result in baseline population synchrony and low-dose propofol-induced LTS interneuron antisynchrony.
Figure 13.
Simulation results show increasing time of block of postexcitatory inhibition with increasing values of the maximal M-current conductance. The maximal M-current conductance is varied in one LTS cell, which is given excitation followed by inhibition at various lag times. The points on the graph show the shortest lag between LTS cell spiking and inhibition at which the LTS cell responds with a rebound spike.
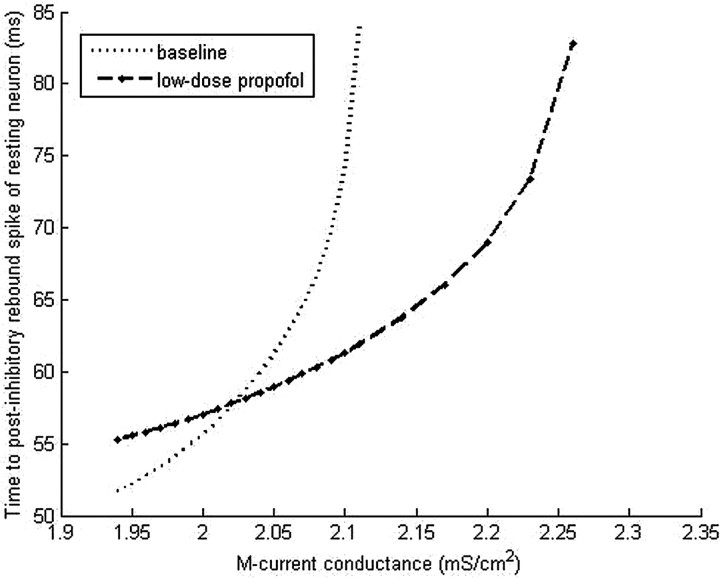
We also note that increasing the maximal M-current conductance increases the time to rebound of a resting neuron (Fig. 14). Moreover, with a ḡM value greater than ∼2.02 mS/cm2, the baseline time-to-rebound exceeds that of the low-dose propofol case, suggesting that with higher values of ḡM the frequency of LTS interneuron antisynchrony will be slower at baseline than with low-dose propofol.
Figure 14.
Simulation results of the time to rebound spiking after inhibitory input to a quiescent LTS cell with increasing values of maximal M-current conductance.
Medium-sized network enhances the e-cell rhythm
Increasing the pyramidal cell to interneuron ratio to a value more representative of the ratio found in the neocortex leads us to consider a 12-neuron system consisting of 10 e-cells and 2 LTS cells. With this slightly larger network, we again notice the emergence of paradoxical excitation with GABAA potentiation consistent with the addition of low-dose propofol. Similar to the three-cell system, the potentiation of the GABAA current acts to switch the system from a synchronous low-frequency population rhythm (11 Hz) at baseline to a midbeta frequency population rhythm with low-dose propofol (Fig. 15). The baseline frequency is maintained at alpha frequency by one or more e-cells leading the LTS cells at every cycle. After the addition of low-dose propofol to the system, the LTS cells express their own antisynchronous rhythm, which serves to pattern the e-cells to spike as a population in the midbeta frequency (19 Hz). One to three e-cells spike on each LTS cell cycle at baseline, and one to two e-cells spike on each LTS cell cycle with low-dose propofol. Individual pyramidal cells spike at rates no more than 6 Hz. However, as a population, the e-cells transition from 11 Hz at baseline to 19 Hz with low-dose propofol.
Figure 15.
Increasing the pyramidal cell-to-interneuron ratio allows the pyramidal cells to participate in the antisynchronous LTS interneuron rhythm. The population spiking frequency of 10 pyramidal cells and 2 LTS interneurons increases from 11 Hz at baseline to 19 Hz with the addition of low-dose propofol. Propofol is added at 2200 ms. The LTS interneurons spike synchronously at 11 Hz at baseline and form an antisynchronous 19 Hz population rhythm with low-dose propofol. One or more pyramidal cells lead the LTS interneurons in both the baseline and low-dose propofol cases.
Thus, we see expressed in the 12-cell system a phenomenon not expressed in the lower dimensional models, namely the emergence of an LTS interneuron patterned, e-cell beta rhythm. This phenomenon is quite sensitive to small parameter changes and thus not robust. However, it is an important development as we seek to use the sum of the e-cell-generated AMPA currents to approximate of our EEG signal. Thus, we see in the 12-cell model that the antisynchronous LTS cell rhythm can coexist with, indeed even direct, e-cell spiking.
Robustness of the large network model
We have tested the robustness of our large (200 e-cells, 20 LTS cells) network to various types of phasic and spectral input, to changes in network connectivity, and to the addition of electrical synapses. We generally find in this large network, LTS cell antisynchrony robust to many of these changes. The large model (200 e-cells, 15 FS cells, 15 LTS cells) is sensitive to changes in the applied current to the LTS cells, but we found that increasing the proportion of FS cells relative to LTS cells along with increasing the applied current to the FS cells helps to increase robustness. However, the presentation of these results is beyond the scope of this paper.
Discussion
Our model EEG matches the EEG changes characteristic of the clinical state of paradoxical excitation. The large 230 neuron network model shows increased EEG beta1 and beta2 power with the addition of low-dose propofol to the system. Network patterns that correlate with increased beta power include the formation of antisynchronous clusters of LTS interneurons spiking at midbeta frequency and the patterning of pyramidal cell spiking between LTS interneuron clusters. Large network simulations suggest that much of the increase in beta1 power with low-dose propofol depends on FS cell activity, whereas the increase in beta2 power develops from LTS cell antisynchrony. The large 230 cell network and the 220 cell network with only LTS cells both show a decrease in EEG power in both the theta and alpha bands with low-dose propofol. We turn to small network models to gain insight into how these dynamics evolve in the presence of GABAA potentiation.
Our two-cell model reveals that GABAA potentiation can increase postsynaptic pyramidal cell excitation leading to increased frequency of spiking from alpha to beta1. GABAA-induced reduction of the M-current drives the postsynaptic excitation. Interestingly, GABAA-induced excitation is limited by the magnitude of the GABAA potentiation. Small amounts of GABAA potentiation can excite the postsynaptic membrane, whereas significantly large amounts of GABAA potentiation slow postsynaptic spiking as the GABAA current dominates membrane dynamics. This GABAA potentiation window closely parallels the dose dependency of paradoxical excitation observed clinically, in which low doses of most general anesthetics excite and higher, anesthetic doses sedate. The two-cell model further reveals a dependence of GABAA-induced excitation on the preexisting level of excitation of the postsynaptic neuron. Additionally, our model indicates that only neurons with intrinsic spiking frequencies below beta1 will excite to higher frequency spiking by GABAA. This again correlates well with the clinical observation of decreased EEG power in the lower frequencies and increased power in the beta bands (Gugino et al., 2001). It further offers a potential mechanistic explanation of this phenomenology.
The three-cell model allows us to investigate interneuron-to-interneuron dynamics. Interconnected model LTS interneurons tend to spike antisynchronously at midbeta frequency. However, at baseline LTS interneurons are synchronized and frequency controlled by simultaneous pyramidal cell input. GABAA potentiation releases LTS interneurons from the synchronizing effect of pyramidal cells, allowing them to spike in beta frequency antisynchrony without restraint. The transition from baseline LTS interneuron synchrony to LTS interneuron antisynchrony in the presence of propofol results from GABAA-induced reduction of the M-current in the LTS interneurons. As in the two-cell model, this excitatory phenomenon only occurs if the pyramidal cell spikes below beta1 frequency. Increased participation of pyramidal cells in the propofol-induced antisynchronous beta rhythm arises in networks with a more accurate cortical pyramidal cell-to-interneuron ratio, such as in our medium-sized (12-cell) network. This is important because the cortical layer V pyramidal cells are thought to be a main source of the EEG potential.
Features not included in the models
Gap junctions are involved in the production of some beta rhythms (Roopun et al., 2006). Moreover, the anesthetic sevoflurane has been shown to increase neuronal firing frequency in the locus ceruleus of rats in a manner dependent on gap junction connections (Yasui et al., 2007). Propofol has not been shown to affect gap junctions at the concentrations in which we are interested (Wentlandt et al., 2006). Thus, we did not explicitly include gap junctions in this study. Nevertheless, they are implicitly modeled in our interneurons because each interneuron represents a population of interneurons of the same type spiking synchronously, aided by gap junctions.
The hyperpolarization-induced excitation in our network dynamics is reminiscent of modeling studies of hippocampal OLM cells. With a hyperpolarization-activated current (h-current) present, reciprocally coupled OLM cells have a stable antisynchronous solution (Pervouchine et al., 2006), similar to what we observe in our model LTS interneurons with the presence of the M-current. The mechanism governing the inhibition-induced excitation is different in these two cases: the OLM cells are excited by a hyperpolarization-activated inward current (inward at hyperpolarized potentials), whereas the LTS cells in our model are excited by a hyperpolarization-induced reduction of an outward current. Because propofol has not been shown to influence h-currents at the concentrations we use in our model, we do not include them in our model neurons.
We expect the introduction of different neuron types in our circuits to lead to emergent behavior not expressed in our reduced network models. For example, the three-neuron thalamocortical circuit described by Steriade and Timofeev (2003) is a powerful generator of slow oscillations, which synchronize cortical and thalamic neurons during slow-wave sleep. We simulate background input to our pyramidal cells with a peak in the delta frequency range, much of which presumably comes from thalamocortical circuits. Including this thalamocortical circuit may increase the robustness of our model in the presence of an anesthetic dose of propofol. However, this investigation is beyond the scope of the current paper.
Pharmacological and behavioral implications
The excitation produced by other general anesthetic and sedative drugs, such as the benzodiazepines, is likely closely related to propofol-induced paradoxical excitation. The benzodiazepine drugs act on GABAA receptors and enhance the GABA response (Campo-Soria et al., 2006), and the inhalation anesthetics also potentiate GABAA receptor-mediated inhibition (Campagna et al., 2003). Moreover, both of these types of drugs are associated with increased EEG beta power (Fink et al., 1976; Wolffgramm et al., 1994; Niedermeyer and Lopes da Silva, 1999; Gugino et al., 2001; Venkatakrishnan et al., 2005). Common network mechanisms may be active during the expression of paradoxical excitation in a broader class of sedative drugs.
Different network mechanisms, however, may be at work in excitatory states associated with other anesthetics. Although most anesthetics potentiate GABA (Franks and Lieb, 1994), anesthetics may also influence other membrane and synaptic currents. For example, the anesthetics enflurane and halothane both decrease T-type calcium currents (McDowell et al., 1999), with enflurane reducing this current significantly more than halothane (McDowell et al., 1999). T-type calcium currents are thought to be important in producing intrinsic membrane oscillatory activity in certain types of neurons such as thalamic reticular cells (Huguenard, 1996). Halothane additionally blocks gap junctions (He and Burt, 2000). Such actions on membrane currents may alter or mask the beta-producing network effect we describe in our models, which we generate by changing only the GABAA current. Biophysical networks of neurons, modeled with currents known to be altered with a given anesthetic, may thus be able to answer such questions as why chemically similar anesthetic agents such as enflurane and halothane have differential manifestations of excitation. Furthermore, although we focus on cortical networks, GABAA-induced excitation may also result from the action of GABA on other networks. For example, the paradoxical arousing effect of the GABAA-potentiating drug zolpidem (Brefel-Courbon et al., 2007) may be a consequence of GABAA potentiation-induced activation of the corticostriatopallidal–thalamocortical loop (Schiff and Posner, 2007). Other anesthetics, such as ketamine, work through completely different pathways (Franks and Lieb, 1994).
One of the most evident behavioral manifestations of propofol-induced paradoxical excitation is disinhibited movement. Within the motor cortex, a prominent beta frequency rhythm (15–30 Hz) is expressed during steady muscle contractions and is coherent with oscillatory muscle EMG activity (Kilner et al., 1999). The EEG power of this motor cortex beta rhythm increases in the presence of the GABAA-potentiating drug diazepam (Baker and Baker, 2003), indicating a role for interneurons in the networks generating this rhythm. These findings suggest that the network mechanisms generating increased beta power during paradoxical excitation may represent a disregulated expression of an underlying in vivo motor network that normally generates oscillatory potentials in the beta frequency range under conditions of regulated motor behavior. Our modeling studies thus suggest LTS interneuron antisynchrony as a possible network dynamic modulating motor behavior. We further note that, although propofol has been associated with seizure-like events (Walder et al., 2002), the increased EEG beta power seen with low-dose propofol is not considered to be associated with near-epileptiform activity. The beta wave activity that we are modeling, if anything, appears to be anticorrelated with near-epileptiform activity as suggested by a study demonstrating propofol-induced beta wave activity is associated with a suppression (rather than an increase) of EEG spike wave patterns in children with epilepsy (Meyer et al., 2006).
Another prominent behavioral manifestation of paradoxical excitation is affective disregulation. In fact, the discovery of anesthesia itself has its roots in the ether follies of the mid-1800s, in which low doses of the general anesthetic ether were used as an agent of euphoria (Flagg, 1916). Moreover, EEG beta activity has been linked to both positive and negative emotional tasks (Ray and Cole, 1985). Possible connections may exist between the dysphoria/euphoria accompanying general anesthesia-induced paradoxical excitation and the underlying networks involved in processing emotion.
The mechanism of general anesthesia remains a mystery. However, identifying network dynamics operative under general anesthesia will doubtlessly bring us closer to a more accurate mechanistic understanding of the action of general anesthetics in the CNS.
Appendix
Models of the spiking currents (INa, IK, IL) for the pyramidal cells, the fast spiking interneurons, and the LTS interneurons are taken from a previous formulation of these currents in a model examining the dynamics of pyramidal cells and interneurons in beta and gamma wave formation (Olufsen et al., 2003). The maximal sodium conductance is ḡNa = 100 mS/cm2, and the sodium reversal potential is ENa = 50 mV. The sodium current has three activation gates (n = 3) and one inactivation gate (k = 1). The rate functions for the sodium current activation (m) and inactivation (h) variables are described by the following:
 |
 |
 |
 |
The maximal conductance for the fast potassium channel is ḡK = 80 mS/cm2, and the reversal potential for potassium is EK = −100 mV. The fast potassium channel has no inactivation gates but has four activation gates described by the following rate functions:
 |
 |
The leak current (IL) has no gating variables. The maximal leak channel conductance is gL = 0.1 mS/cm2, and the leak channel reversal potential is EL = −67 mV.
The M-current is formulated as in the study by Mainen and Sejnowski (1996) with one activation gate and no inactivation gate. The maximal conductance for the M-current, ḡM, is varied between 0 and 4 mS/cm2 to evaluate its effect on network dynamics. For our large models, we use a maximal M-current conductance of 4 mS/cm2 for both pyramidal cells and LTS interneurons. The rate functions for the M-current activation variable are given by the following:
 |
 |
For the M-current, a Q10 factor of 2.3 is used in scaling the rate functions because the kinetics were originally derived from experiments performed at 23°C. At a normal body temperature of 37°C, the rate equations for the M-current are scaled by the following:
 |
The A-like current (IA) is described mathematically by Saraga et al. (2003), using one activation and one inactivation gate. The dynamics of the A-like current activation steady-state variable (m∞) and time constant (τr) are formulated as follows (Traub et al., 2003):
 |
 |
The inactivation steady-state variable (h∞) and time constant (τh) are formulated as follows (Traub et al., 2003):
 |
 |
The maximal IA conductance is ḡA = 1 mS/cm2. We set ḡA lower than usual because our only purpose for including this current is to slow the baseline spiking rate of the pyramidal cells. The use of the A-like current in our models is restricted to the 12-cell network.
Both synaptic currents (IAMPA and IGABAA) have a single activation gate dependent on the presynaptic voltage. The activation gate of the AMPA current is described mathematically by the following equation (Olufsen et al., 2003):
 |
The variable se represents the sum of the synaptic activation variables from all pyramidal cells in the network from which a given interneuron receives excitatory input.
For the jth interneuron in the network,
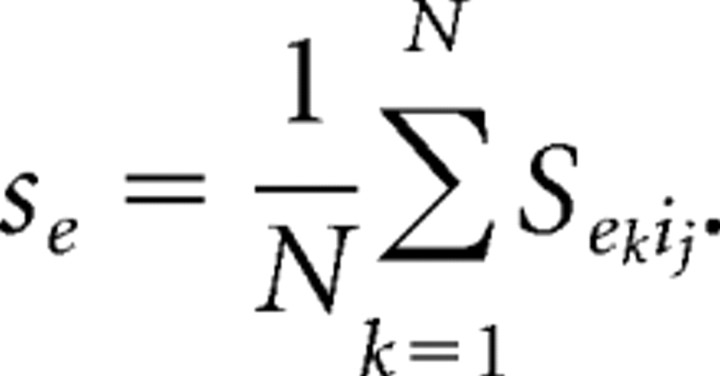 |
In this formula, N is the number of pyramidal cells that make connections with the jth interneuron. The kinetics of the synaptic activation variable from pyramidal cell k to interneuron j are denoted by
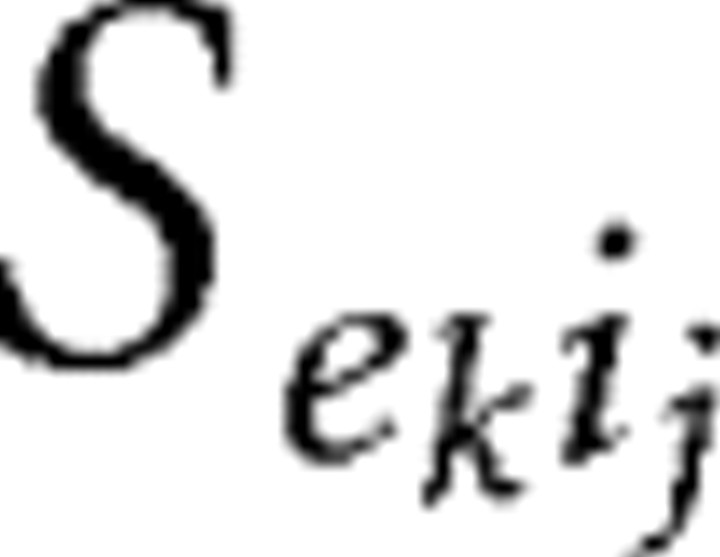 |
and described by the following:
 |
The time constant of decay for the AMPA synapse is τe = 2 ms and the rate function for the open state, gee (Vk), which is dependent on the membrane voltage of the kth e-cell follows the mathematical formulation:
 |
The maximal AMPA conductance equals ḡe = 0.08 mS/cm2 for e-cell to i-cell connections in small networks. For our largest network, we set ḡe = 0.7 mS/cm2 for e-cell to i-cell connections to get sufficient activation of the i-cells. The 12-cell network has an intermediate value of ḡe = 0.17 mS/cm2. We use a value of ḡe = 0.01 mS/cm2 for e-cell to e-cell connections to model the EEG, although e-cell to e-cell connections are not present in our network. The maximal AMPA conductance is scaled according to the number of AMPA synaptic connections received by a given cell by dividing ḡe by the number of AMPA synapses made onto that cell. The reversal potential for all AMPA synapses is Ee = 0 mV.
The GABAA current is formulated mathematically by Olufsen et al. (2003):
 |
The variable si represents the gating variable for inhibitory GABAA synaptic transmission. For the jth interneuron in the network or the mth e-cell in the system:
 |
 |
The variable N is the number of interneurons that make connections with the receiving neuron. The synaptic kinetics of the gating variable from the kth interneuron to the jth interneuron (Sikij) evolves according to the following first-order differential equation:
 |
Similarly, the kinetics of the synaptic activation variable from the kth interneuron to the mth pyramidal cell is denoted by
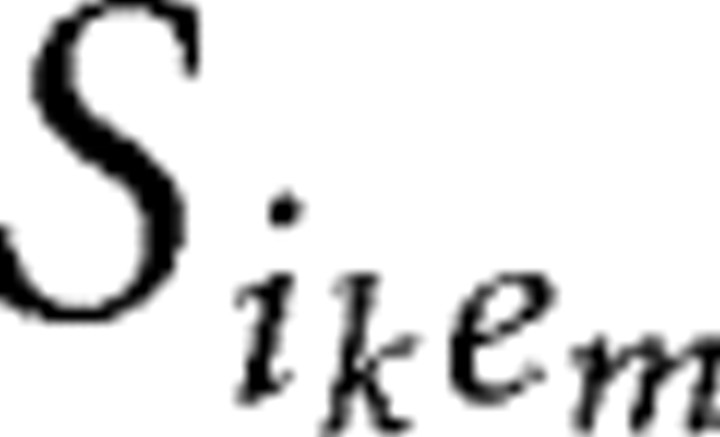 |
and is mathematically formulated as follows:
 |
When propofol is not present, τi = 5 ms. The rate functions for the open state of the GABAA receptor, gii (Vk) and gie (Vk) follow the equation:
 |
The reversal potential for all GABAA receptors is Ei = −80 mV. The maximal GABAA conductance, ḡi equals 0.165 mS/cm2 for i-cell to i-cell connections and equals 0.638 mS/cm2 for i-cell to e-cell connections. These represent the maximal conductance values of the GABAA receptors at baseline. These values change with the addition of propofol.
We choose the maximal conductance for the GABAA receptors so that the GABAA conductance in the presence of low-dose propofol is slightly less than 200% of the peak GABAA conductance amplitude at baseline. Thus, in our models, the addition of low-dose propofol to our networks is simulated by increasing the maximal conductance of the GABAA receptors to 0.25 mS/cm2 for interneuron-to-interneuron connections and to 1 mS/cm2 for interneuron-to-pyramidal cell connections. Similarly, the time constant of decay for the GABAA receptor (τi) is increased to 10 ms when we simulate the addition of low-dose propofol. An anesthetic dose of propofol potentiates the GABAA conductance 300% of baseline, and thus we let the maximal GABAA conductance from i-cell to i-cell equal 0.5 mS/cm2 and from i-cell to e-cell equal 2 mS/cm2 for anesthetic-dose propofol. The anesthetic dose of propofol makes τi = 20.
Our spectral noise term (Ispec) is constructed using the following second-order autoregressive model:
Gaussian random noise is introduced through the variable ε. The regression coefficients (a1 and a2) determine the spectral content of the noise term. These constants are estimated by constructing a sine wave of known frequency (delta frequency in our models) with Gaussian random noise of mean 0 and variance 1. This model is fit using the Yule–Walker method, and estimates of the regression coefficients are obtained. The spectral content of the signal can be varied by changing the frequency of the sine wave and calculating new regression coefficients. Using this methodology, our regression coefficients have values of a1 = −1.8744 and a2 = 0.8785. The Ispec term is multiplied by a constant amplitude term equal to 0.05 to give it a sufficient height.
Our 12-cell network is nonrobust. The parameter values used to generate Figure 15 are as follows: Iapp = 2.89 μA/cm2 to one e-cell with additional e-cells receiving Iapp successively increased by a value of 0.005 μA/cm2, Iapp = 1.81, 1.80 μA/cm2 to the first and second LTS interneuron, respectively, ḡe = 0.17 mS/cm2. e-cells are sequentially ordered in terms of increasing Iapp and i-cell1 projects to the odd-numbered e-cells, whereas i-cell2 projects to the even-numbered e-cells.
Our network models were programmed in C++ and compiled using Microsoft Visual C++, version 6.0. The differential equations were integrated using a fourth-order Runge–Kutta algorithm. The integration time step was 0.05 ms. Model output is graphed and analyzed using MatLab, version 7.0.4.365 (R14), Service Pack 2. The autoregressive coefficients were also estimated using this version of MatLab.
Footnotes
This work was supported by National Institutes of Health Director's Pioneer Award NIH/OD DP1 OD003646, National Institutes of Health/National Institute on Drug Abuse Grant R01 DA015644, and National Institute of General Medical Sciences Grant T32 GM008185.
References
- Adodra S, Hales TG. Potentiation, activation and blockade of GABAA receptors of clonal murine hypothalamic GT1–7 neurones by propofol. Br J Pharmacol. 1995;115:953–960. doi: 10.1111/j.1476-5381.1995.tb15903.x. [DOI] [PMC free article] [PubMed] [Google Scholar]
- Bai D, Pennefather PS, MacDonald JF, Orser BA. The general anesthetic propofol slows deactivation and desensitization of GABAA receptors. J Neurosci. 1999;19:10635–10646. doi: 10.1523/JNEUROSCI.19-24-10635.1999. [DOI] [PMC free article] [PubMed] [Google Scholar]
- Baker MR, Baker SN. The effect of diazepam on motor cortical oscillations and corticomuscular coherence studies in man. J Physiol. 2003;546:931–942. doi: 10.1113/jphysiol.2002.029553. [DOI] [PMC free article] [PubMed] [Google Scholar]
- Borgeat A, Dessibourg C, Popovic V, Meier D, Blanchard M, Schwander D. Propofol and spontaneous movements: an EEG study. Anesthesiology. 1991;74:24–27. doi: 10.1097/00000542-199101000-00005. [DOI] [PubMed] [Google Scholar]
- Borgeat A, Fuchs T, Tassonyi E. Induction characteristics of 2% propofol in children. Br J Anaesth. 1997;78:433–435. doi: 10.1093/bja/78.4.433. [DOI] [PubMed] [Google Scholar]
- Brefel-Courbon C, Payoux P, Ory F, Sommet A, Slaoui T, Raboyeau G, Lemesle B, Puel M, Montastruc JL, Demonet JF, Cardebat D. Clinical and imaging evidence of zolpidem effect in hypoxic encephalopathy. Ann Neurol. 2007;62:102–105. doi: 10.1002/ana.21110. [DOI] [PubMed] [Google Scholar]
- Campagna JA, Miller KW, Forman SA. Mechanisms of actions of inhaled anesthetics. N Engl J Med. 2003;348:2110–2124. doi: 10.1056/NEJMra021261. [DOI] [PubMed] [Google Scholar]
- Campo-Soria C, Chang Y, Weiss DS. Mechanism of action of benzodiazepines on GABAA receptors. Br J Pharmacol. 2006;148:984–990. doi: 10.1038/sj.bjp.0706796. [DOI] [PMC free article] [PubMed] [Google Scholar]
- Cunningham MO, Whittington MA, Bibbig A, Roopun A, LeBeau FE, Vogt A, Monyer H, Buhl EH, Traub RD. A role for fast rhythmic bursting neurons in cortical gamma oscillations in vitro. Proc Natl Acad Sci U S A. 2004;101:7152–7157. doi: 10.1073/pnas.0402060101. [DOI] [PMC free article] [PubMed] [Google Scholar]
- Dickinson R, Awaiz S, Whittington MA, Lieb WR, Franks NP. The effects of general anaesthetics on carbachol-evoked gamma oscillations in the rat hippocampus in vitro. Neuropharmacology. 2003;44:864–872. doi: 10.1016/s0028-3908(03)00083-2. [DOI] [PubMed] [Google Scholar]
- Fell J, Widman G, Rehberg B, Elger CE, Fernández G. Human mediotemporal EEG characteristics during propofol anesthesia. Biol Cybern. 2005;92:92–100. doi: 10.1007/s00422-004-0538-7. [DOI] [PubMed] [Google Scholar]
- Fink M, Weinfeld RE, Schwartz MA, Conney AH. Blood levels and electroencephalographic effects of diazepam and bromazepam. Clin Pharmacol Ther. 1976;20:184–191. doi: 10.1002/cpt1976202184. [DOI] [PubMed] [Google Scholar]
- Flagg PJ. The art of anesthesia. Philadelphia: Lippincott; 1916. [Google Scholar]
- Franks NP, Lieb WR. Molecular and cellular mechanisms of general anaesthesia. Nature. 1994;367:607–614. doi: 10.1038/367607a0. [DOI] [PubMed] [Google Scholar]
- Fulton SA, Mullen KD. Completion of upper endoscopic procedures despite paradoxical reaction to midazolam: a role for flumazenil? Am J Gastroenterol. 2000;95:809–811. doi: 10.1111/j.1572-0241.2000.01866.x. [DOI] [PubMed] [Google Scholar]
- Gibbs FA, Gibbs EL, Lennox WG. Effects on the electroencephalogram of certain drugs which influence the nervous activity. Arch Intern Med. 1937;60:154–166. [Google Scholar]
- Gibson JR, Beierlein M, Connors BW. Two networks of electrically coupled inhibitory neurons in neocortex. Nature. 1999;402:75–79. doi: 10.1038/47035. [DOI] [PubMed] [Google Scholar]
- Gugino LD, Chabot RJ, Prichep LS, John ER, Formanek V, Aglio LS. Quantitative EEG changes associated with loss and return of consciousness in healthy adult volunteers anaesthetized with propofol or sevoflurane. Br J Anaesth. 2001;87:421–428. doi: 10.1093/bja/87.3.421. [DOI] [PubMed] [Google Scholar]
- Hari R. Magnetoencephalography as a tool of clinical neurophysiology. In: Niedermeyer E, Lopes da Silva F, editors. Electroencephalography, basic principles, clinical applications, and related fields. Ed 4. Baltimore: Lippincott Williams and Wilkins; 1999. p. 1107. [Google Scholar]
- He DS, Burt JM. Mechanism and selectivity of the effects of halothane on gap junction channel function. Circ Res. 2000;86:E104–E109. doi: 10.1161/01.res.86.11.e104. [DOI] [PubMed] [Google Scholar]
- Huguenard JR. Low-threshold calcium currents in central nervous system neurons. Annu Rev Physiol. 1996;58:329–348. doi: 10.1146/annurev.ph.58.030196.001553. [DOI] [PubMed] [Google Scholar]
- Jacobson GA, Diba K, Yaron-Jakoubovitch A, Oz Y, Koch C, Segev I, Yarom Y. Subthreshold voltage noise of rat neocortical pyramidal neurons. J Physiol. 2005;564:145–160. doi: 10.1113/jphysiol.2004.080903. [DOI] [PMC free article] [PubMed] [Google Scholar]
- Jensen O, Goel P, Kopell N, Pohja M, Hari R, Ermentrout B. On the human sensorimotor-cortex beta rhythm: sources and modeling. Neuroimage. 2005;26:347–355. doi: 10.1016/j.neuroimage.2005.02.008. [DOI] [PubMed] [Google Scholar]
- John ER, Prichep LS, Kox W, Valdés-Sosa P, Bosch-Bayard J, Aubert E, Tom M, di Michele F, Gugino LD, diMichele F. Invariant reversible QEEG effects of anesthetics. Conscious Cogn. 2001;10:165–183. doi: 10.1006/ccog.2001.0507. [DOI] [PubMed] [Google Scholar]
- Kawaguchi Y, Kubota Y. GABAergic cell subtypes and their synaptic connections in rat frontal cortex. Cereb Cortex. 1997;7:476–486. doi: 10.1093/cercor/7.6.476. [DOI] [PubMed] [Google Scholar]
- Kilner JM, Baker SN, Salenius S, Jousmaki V, Hari R, Lemon RN. Task-dependent modulation of 15–30 Hz coherence between rectified EMGs from human hand and forearm muscles. J Physiol. 1999;516:559–570. doi: 10.1111/j.1469-7793.1999.0559v.x. [DOI] [PMC free article] [PubMed] [Google Scholar]
- Koch C. Biophysics of computation: information processing in single neurons. New York: Oxford UP; 1999. [Google Scholar]
- Koch C, Segev I. Methods in neuronal modeling, from ions to networks. Ed 2. Cambridge, MA: MIT; 1999. [Google Scholar]
- Mainen ZF, Sejnowski TJ. Influence of dendritic structure on firing pattern in model neocortical neurons. Nature. 1996;382:363–366. doi: 10.1038/382363a0. [DOI] [PubMed] [Google Scholar]
- Mazoit JX, Samii K. Binding of propofol to blood components: implications for pharmacokinetics and for pharmacodynamics. Br J Clin Pharmacol. 1999;47:35–42. doi: 10.1046/j.1365-2125.1999.00860.x. [DOI] [PMC free article] [PubMed] [Google Scholar]
- McDowell TS, Pancrazio JJ, Barrett PQ, Lynch C. Volatile anesthetic sensitivity of T-type calcium currents in various cell types. Anesth Analg. 1999;88:168–173. doi: 10.1097/00000539-199901000-00032. [DOI] [PubMed] [Google Scholar]
- Meyer S, Shamdeen MG, Kegel B, Mencke T, Gottschling S, Gortner L, Grundmann U. Effect of propofol on seizure-like phenomena and electroencephalographic activity in children with epilepsy vs children with learning difficulties. Anaesthesia. 2006;61:1040–1047. doi: 10.1111/j.1365-2044.2006.04782.x. [DOI] [PubMed] [Google Scholar]
- Miller RD. Anesthesia. Ed 5. Vol 1. Philadelphia: Churchill Livingstone; 2000. [Google Scholar]
- Mitra P, Bokil H. Observed brain dynamics. New York: Oxford UP; 2007. [Google Scholar]
- Murakami S, Okada Y. Contributions of principal neocortical neurons to magnetoencephalography and electroencephalography signals. J Physiol. 2006;575:925–936. doi: 10.1113/jphysiol.2006.105379. [DOI] [PMC free article] [PubMed] [Google Scholar]
- Mustola ST, Baer GA, Toivonen JK, Salomäki A, Scheinin M, Huhtala H, Laippala P, Jäntti V. Electroencephalographic burst suppression versus loss of reflexes anesthesia with propofol or thiopental: differences of variance in the catecholamine and cardiovascular response to tracheal intubation. Anesth Analg. 2003;97:1040–1045. doi: 10.1213/01.ANE.0000080156.05749.17. [DOI] [PubMed] [Google Scholar]
- Niedermeyer E, Lopes da Silva F. Electroencephalography, basic principles, clinical applications, and related fields. Ed 4. Baltimore: Lippincott Williams and Wilkins; 1999. [Google Scholar]
- Nunez PL, Srinivasan R. Electric fields of the brain, the neurophysics of EEG. Ed 2. New York: Oxford UP; 2006. [Google Scholar]
- Olufsen MS, Whittington MA, Camperi M, Kopell N. New roles for the gamma rhythm: population tuning and preprocessing for the beta rhythm. J Comput Neurosci. 2003;14:33–54. doi: 10.1023/a:1021124317706. [DOI] [PubMed] [Google Scholar]
- Pervouchine DD, Netoff TI, Rotstein HG, White JA, Cunningham MO, Whittington MA, Kopell NJ. Low-dimensional maps encoding dynamics in entorhinal cortex and hippocampus. Neural Comput. 2006;18:2617–2650. doi: 10.1162/neco.2006.18.11.2617. [DOI] [PubMed] [Google Scholar]
- Rampil IJ. A primer for EEG signal processing in anesthesia. Anesthesiology. 1998;89:980–1002. doi: 10.1097/00000542-199810000-00023. [DOI] [PubMed] [Google Scholar]
- Ray WJ, Cole HW. EEG alpha activity reflects attentional demands, and beta activity reflects emotional and cognitive processes. Science. 1985;228:750–752. doi: 10.1126/science.3992243. [DOI] [PubMed] [Google Scholar]
- Rinzel J, Ermentrout BB. Analysis of neural excitability and oscillations. In: Koch C, Segev I, editors. Methods in neuronal modeling. Ed 2. Cambridge, MA: MIT; 1999. pp. 251–292. [Google Scholar]
- Roopun AK, Middleton SJ, Cunningham MO, LeBeau FE, Bibbig A, Whittington MA, Traub RD. A beta2-frequency (20–30 Hz) oscillation in nonsynaptic networks of somatosensory cortex. Proc Natl Acad Sci U S A. 2006;103:15646–15650. doi: 10.1073/pnas.0607443103. [DOI] [PMC free article] [PubMed] [Google Scholar]
- Saraga F, Wu CP, Zhang L, Skinner FK. Active dendrites and spike propagation in multi-compartment models of oriens-lacunosum/moleculare hippocampal interneurons. J Physiol. 2003;552:673–689. doi: 10.1113/jphysiol.2003.046177. [DOI] [PMC free article] [PubMed] [Google Scholar]
- Schiff ND, Posner JB. Another “Awakenings.”. Ann Neurol. 2007;62:5–7. doi: 10.1002/ana.21158. [DOI] [PubMed] [Google Scholar]
- Shepherd G. The synaptic organization of the brain. Ed 4. New York: Oxford UP; 1998. [Google Scholar]
- Sneyd JR. Excitatory events associated with propofol anaesthesia: a review. J R Soc Med. 1992;85:288–291. doi: 10.1177/014107689208500516. [DOI] [PMC free article] [PubMed] [Google Scholar]
- Steriade M, Timofeev I. Neuronal plasticity in thalamocortical networks during sleep and waking oscillations. Neuron. 2003;37:563–576. doi: 10.1016/s0896-6273(03)00065-5. [DOI] [PubMed] [Google Scholar]
- Traub RD, Jefferys JGR, Whittington MA. Fast oscillations in cortical circuits. Cambridge, MA: MIT; 1999. [Google Scholar]
- Traub RD, Buhl EH, Gloveli T, Whittington MA. Fast rhythmic bursting can be induced in layer 2/3 cortical neurons by enhancing peristent Na+ conductance or by blocking BK channels. J Neurophysiol. 2003;89:909–921. doi: 10.1152/jn.00573.2002. [DOI] [PubMed] [Google Scholar]
- Venkatakrishnan K, Culm KE, Ehrenberg BL, Harmatz JS, Corbett KE, Fleishaker JC, Greenblatt DJ. Kinetics and dynamics of intravenous adinazolam, N-desmethyl adinazolam, and alprazolam in healthy volunteers. J Clin Pharmacol. 2005;45:529–537. doi: 10.1177/0091270004269105. [DOI] [PubMed] [Google Scholar]
- Violet JM, Downie DL, Nakisa RC, Lieb WR, Franks NP. Differential sensitivities of mammalian neuronal and muscle nicotinic acetylcholine receptors to general anesthetics. Anesthesiology. 1997;86:866–874. doi: 10.1097/00000542-199704000-00017. [DOI] [PubMed] [Google Scholar]
- Walder B, Tramèr MR, Seeck M. Seizure-like phenomena and propofol: a systematic review. Neurology. 2002;58:1327–1332. doi: 10.1212/wnl.58.9.1327. [DOI] [PubMed] [Google Scholar]
- Wentlandt K, Samoilova M, Carlen PL, El Beheiry H. General anesthetics inhibit gap junction communication in cultured organotypic hippocampal slices. Anesth Analg. 2006;102:1692–1698. doi: 10.1213/01.ane.0000202472.41103.78. [DOI] [PubMed] [Google Scholar]
- Whittington MA, Jefferys JGR, Traub RD. Effects of intravenous anaesthetic agents on fast inhibitory oscillations in the rat hippocampus in vitro. Br J Pharmacol. 1996;118:1977–1986. doi: 10.1111/j.1476-5381.1996.tb15633.x. [DOI] [PMC free article] [PubMed] [Google Scholar]
- Wolffgramm J, Mikolaiczyk C, Coper H. Acute and subchronic benzodiazepine-barbiturate-interactions on behaviour and physiological responses of the mouse. Naunyn Schmiedebergs Arch Pharmacol. 1994;349:279–286. doi: 10.1007/BF00169294. [DOI] [PubMed] [Google Scholar]
- Yasui Y, Masaki E, Kato F. Sevoflurane directly excites locus coeruleus neurons of rats. Anesthesiology. 2007;107:992–1002. doi: 10.1097/01.anes.0000291453.78823.f4. [DOI] [PubMed] [Google Scholar]


