

Abstract
Collagen accumulation likely contributes to increased vascular and airway impedance in hypoxia-induced pulmonary hypertension (HPH). Collagen exists in multiple subtypes and can accumulate via increased synthesis or decreased degradation. To better understand the individual contributions of fibrillar (FB) and basement membrane (BM) collagen, matrix metalloproteinases (MMPs) and tissue inhibitors of MMPs (TIMPs) to pulmonary vascular and airway remodeling in HPH, we investigated the temporal changes in gene and protein expression in the lungs of mice exposed to hypoxia for 0, 3, 6, 10 and 15 days. The earliest and largest change in gene expression was of type I FB collagen, which was significantly increased over control levels at 6, 10 and 15 days of hypoxia (p < 0.05). Type III FB and type IV BM collagen were increased at 10 and 15 days of hypoxia (p < 0.05); MMP and TIMP gene expression levels were typically higher but sometimes lower than control levels at various time points. Collagen protein content was increased in whole lungs as early as 6 days of hypoxia and increased monotonically with longer exposures. However, neither qualitative nor semi-quantitative analysis of immunohistochemistry demonstrated accumulation of type I FB collagen in compartments of the lung other than large airways, suggesting that other collagen subtypes may be important contributors to collagen protein accumulation. These results provide insight into the patterns of gene and protein expression relevant to collagen accumulation in the lung in response to chronic hypoxia, through which we can develop a better understanding of the time course of changes in matrix biology and biomechanics that occur in HPH.
Keywords: extracellular matrix, pulmonary vascular remodeling, airway remodeling, hypoxia-induced pulmonary hypertension
Introduction
Pulmonary hypertension can lead to hypertrophy of the right ventricle, right ventricular failure and even death. Chronic exposure to hypoxia, which initially causes pulmonary hypertension via hypoxic pulmonary vasoconstriction (22, 24), is often used to induce chronic pulmonary hypertension in animal models. In addition, hypoxia-induced pulmonary hypertension (HPH) is a consequence of living at altitude and of chronic lung diseases such as chronic obstructive pulmonary disease, cystic fibrosis and sleep apnea (19, 21, 24, 28). One characteristic of HPH is pulmonary vascular remodeling, which is characterized by cellular hypertrophy and hyperplasia and increased extracellular matrix (ECM) deposition in large and small arteries (9, 22, 24). More specifically, hypertrophy and hyperplasia of fibroblasts, smooth muscle cells, and endothelial cells as well as accumulation of collagen, elastin, and fibronectin are known to occur (12). A second consequence of HPH is airway remodeling via thickening of airway fibrous tissue and smooth muscle layers (10). The structural and biomechanical changes that result from vascular and airway remodeling alter the hemodynamic and airflow environments, which then perpetuate the remodeling. Thus, understanding the processes of pulmonary vascular and airway remodeling are critical to prevention and treatment strategies.
Collagen, one of the major structural components in the ECM of vessels, airways, and the lung parenchyma, plays an important role in hypoxia-induced pulmonary vascular and airway remodeling (25, 27). Collagen synthesis and degradation are regulated by matrix metalloproteinases (MMPs) and tissue inhibitors of MMPs (TIMPs). Since collagenases (MMP-8, and MMP-13) have substrate affinity for fibrillar collagen (types I and III), and gelatinases (MMP-2 and MMP-9) have substrate affinity for basement membrane collagen (type IV), the gene expression and enzymatic activity of these proteins are likely to be critical to the accumulation of collagen in the vasculature and airways with HPH. Similarly, the gene expression of tissue-inhibitors of MMPs (TIMPs), which inhibit proteolytic activation of latent MMPs and enzymatic activities of active MMPs, can limit collagen degradation.
With the goal of advancing our understanding of the earliest aspects of pulmonary remodeling in response to HPH, we investigated the expression of genes and proteins involved in collagen synthesis and degradation. To do so, we exposed C57BL/6J mice to hypobaric hypoxia for two weeks and measured the gene and protein expression of fibrillar and basement membrane collagen, MMPs, and TIMPs at five time points in this period. We also qualitatively and semi-quantitatively analyzed fibrillar collagen protein content in large and small vessels and airways and measured collagen content in whole lungs. We found significant increases in collagen gene expression over time and also increased lung collagen content over time. Interestingly, the collagen type with the earliest and most dramatic increase in gene expression (fibrillar type I) did not accumulate in the lung except in large airways. The gene expression levels of MMPs and TIMPs, as well as the enzymatic activity of MMPs, were variable, suggesting complex time-dependent regulation of collagen synthesis and degradation during pulmonary vascular and airway remodeling in HPH.
Materials and Methods
Experimental protocol
Six to eight-week-old C57BL/6J male mice were obtained from Jackson Laboratories (Bar Harbor, ME). Mice were exposed to hypobaric hypoxia in a small altitude chamber that generates an equivalent inspired oxygen level of 10% by reducing barometric pressure to 380 mmHg as previously described (13). Exposure durations were 3, 6, 10 and 15 days. Control (0-day) mice were exposed to neither hypoxic nor hypobaric conditions. Following completion of the prescribed exposure duration, mice were euthanized with a pentobarbital injection (0.4 mg/g body weight). The heart and lungs were removed en bloc and rinsed in Dulbecco’s PBS (without CaCl2 or MgCl2, Sigma Chemical Co., St. Louis, MO). All protocols and procedures were approved by the University of Wisconsin Institutional Animal Care and Use Committee.
Semi-quantitative reverse-transcriptase multiplex PCR
For gene expression studies, right lung lobes stored in RNALater (Ambion Inc., Austin, TX) were flash frozen in liquid nitrogen and homogenized. Total RNA was extracted with the RNeasy Mini Kit according to the manufacturer’s instructions (Qiagen, Valencia, CA). The concentration of the isolated total RNA was quantified on a NanoDrop spectrophotometer (NanoDrop Technologies, Rockland, DE). Total RNA (250 ng) was reverse transcribed with 1 µM oligo dT primers (Ambion Inc., Austin, TX) and Omniscript reverse transcriptase according to manufacturer’s instructions (Omniscript RT, Qiagen). PCR was performed using the Multiplex PCR Kit (Qiagen) in a 25 µL reaction volume containing 5 µL of cDNA and 0.2 µM each of sense and anti-sense primers of similar melting temperatures (60 °C) for the target gene and the reference housekeeping gene, β-actin. Cycling conditions for PCR amplification were performed a protocol optimized in preliminary studies. PCR products were electrophoresed in agarose and stained with ethidium bromide. The semi-quantitative band density was determined using Kodak 1D Image analysis software (version 3.5, Scientific Imaging Systems, New Haven, CT). Most primers were outlined with Primer3 software (http://frodo.wi.mit.edu/cgi-bin/primer3/primer3_www.cgi) and were analyzed for specificity in Basic Local Alignment Search Tool (Table 1). The primers for MMP-9 were obtained from previously published mouse sequences (17). All primers were purchased from Integrated DNA Technologies (Coralville, IA).
Table 1.
Genes and primers for Multiplex PCR
| Gene | Sense Primer (5’ to 3’) | Anti-sense Primer (5’ to 3’) | Product bp | Reference or Accession No. |
|---|---|---|---|---|
| β-actin | CTTCTTTGCAGCTCCTTCGTTG | CTTCTGACCCATTCCCACCATC | 199 | NM_007393 |
| Col1a1 | AACTTTGCTTCCCAGATGTCC | CTCGGTGTCCCTTCATTCC | 331 | NM_007742 |
| Col1a2 | GTTCGTGGTTCTCAGGGTAGC | ATCCTTGGTTAGGGTCAATCC | 325 | NM_007743 |
| Col3a1 | CTTCTGGTTCTCCTGGTCTGC | GCCTCCTTCACCTTTCTCTCC | 359 | NM_009930 |
| Col4a1 | GGGAGAACCTGGCATTGG | AGAGCCTTTATCGCCTTTGG | 349 | NM_009931 |
| Col4a2 | CACCAGCACTCATTCCAACC | CATCTCCTCCTCCAAGAAACC | 370 | NM_009932 |
| MMP-2 | CAGTGATGGCTTCCTCTGG | TCGTAGTTGGTTGTGGTTGC | 391 | NM_008610 |
| MMP-8 | CCTATTTCTCGTGGCTGCTC | ATCAATGGCTTGGACACTCC | 505 | NM_008611 |
| MMP-9 | AGGCCTCTACAGAGTCTTTG | CAGTCCAACAAGAAAGGACG | 825 | (17) |
| MMP-13 | CCTGATTCTTGCGTGCTATG | CCACCTCCACTGTCCTTGTAG | 399 | NM_008607 |
| TIMP-1 | GCATCTGGCATCCTCTTGTT | GACGGCTCTGGTAGTCCTCA | 538 | NM_011593 |
| TIMP-2 | AAGCAGTGAGCGAGAAGGAG | GACAGCGAGTGATCTTGCAC | 336 | NM_011594 |
The relative band density, which is proportional to the relative mRNA level of the target gene in the lung extract, was calculated as target gene band density normalized to β-actin band density. Although β-actin gene expression has been previously reported to vary with normobaric hypoxia (30), we analyzed β-actin gene expression from the 22 gels and found no significant differences between 0-day and all other time points (p = 0.87). Then, to express the relative density results as percent change relative to control, the relative densities of each target gene at 3, 6, 10, and 15 days of exposure to hypoxia were normalized to the respective controls. Note that the 0-day values were normalized to the mean 0-day value; the percent change was found by subtracting 1, which yielded a mean percent change of zero. This normalization method was used for each target gene.
Hydroxyproline
Lung tissue was analyzed for collagen content with a hydroxyproline assay modified from (29). The tissue concentration of hydroxyproline, an amino acid specific to the collagen molecule, is directly proportional to the tissue concentration of collagen (all subtypes). Identical sections from the left lung were taken from each mouse, flash frozen and homogenized with mortar and pestle. Samples were subsequently digested in papain solution (2.4 U/ml in 20 mM sodium phosphate buffer, pH 6.8, containing 1 mM ethylenediaminetetraacetic acid and 2 mM dithiothreitol) at 60°C overnight. Samples were then hydrolyzed (autoclaved for 20 minutes with 2 N hydrochloric acid) and neutralized (cooled to 25°C with 2 N NaOH). Hydroxyproline content was determined by oxidation with chloramine T and development with p-dimethylaminobenzaldehyde; hydroxyproline content was quantified by absorbance at 550 nm with a BioTek PowerWave HT Microplate Spectrophotometer after samples were heated to 60°C in a water bath for 30 minutes.
SDS-page zymography
Lung tissue was analyzed for proteins with matrix-degrading activity with SDS-page zymography following established techniques (5). With this method, after electrophoretic migration, proteins with gelatinolytic activity can be detected due to their capacity to digest gelatin substrate in SDS-page gels. Tissues were mortar-and-pestle homogenized and placed in a lysis solution of 1% by volume Triton X-100, 0.1% SDS, 0.5% sodium deoxycholate, and .02% sodium azide in PBS stored at 4°C. Protein concentrations were assayed using the NanoDrop spectrophotometer such that equal amounts of protein (30 µg) were loaded in each lane. Electrophoresis was performed in the presence of SDS in gels containing 10% gelatin (Invitrogen, Caslsbad, CA). After electrophoresis, proteins were renatured by exchanging SDS with Triton X-100 (2 15 min incubations with 2.5% Triton X-100; Sigma). The gels were subsequently incubated overnight at 37°C in 50mM Tris HCl, pH 7.4, containing 10mM CaCl2 and 0.05% Brij 35. At the end of the incubation, gels were stained with Coomassie Brilliant Blue G (Sigma) for 1 hour. Proteins having gelatinolytic activity were then visualized as areas of lytic activity (white) on an otherwise intact (blue) gel. Migration of proteins was compared with that of prestained low-molecular-weight range markers (Fisher). The Quantity One program was used to quantify the gelatinolytic activity data.
Immunohistochemistry
Whole lungs and right main pulmonary arteries (PAs) were used for immunohistochemical analysis of collagen protein content. PAs were submerged in fresh PBS, cleared of excess connective tissue and excised between the first and second pulmonary bifurcations. Lungs were perfused through the trachea with freezing compound OCT at constant pressure of approximately 10 cm H2O. Tissues of either type were then washed in fresh PBS and snap-frozen in an OCT-filled cryomold submerged in 2-methyl butane cooled by liquid nitrogen. PAs were frozen at nearly zero transmural pressure. Two 7 µm-thick sections from the proximal and distal ends of each PA and four 7 µm-thick transverse sections (each section about 500 µm apart starting from the midlung) were cut at −20 °C on a cryostat.
Sections were stained with type I collagen primary antibody (rabbit polyclonal, 100 µg/ml, US Biological, Swampscott, MA) diluted 1:100 in PBS. Sections were then incubated with secondary antibody conjugated to horseradish peroxidase (goat anti-rabbit, Jackson ImmunoResearch Laboratories, West Grove, PA). DAB chromogen (Dako Cytomations, Carpinteria, CA) was used as a substrate, yielding a brown labeling product. The sections were counterstained with hematoxylin to identify cell nuclei (stained blue). The primary antibody was replaced with non-immune serum for negative control slides. Sections were imaged on an inverted microscope (TE-2000, Nikon, Melville, NY). Spot camera and Metavue software (Optical Analysis Systems, Nashua NH) were used for image capture and semi-quantitative image analysis, respectively.
Intimal-to-adventitial wall thickness measurements of the right main PAs of mice exposed to normobaric hypoxia (0 days) or long-term hypobaric hypoxia (10 and 15 days) were made by a single observer blinded to experimental condition. Two representative fields of view (FOV) were chosen (one each from the proximal and distal ends) and viewed at 20× magnification. Wall thickness was measured as described previously (13). To quantify the type I collagen content in right main PAs, methods previously established for measuring overall collagen content (by picrosirius red staining) were used (13). In particular, the area positive for type I collagen was identified by color thresholding for brown staining in the FOV. The total tissue area was identified in the same FOV. Then, the area positive for type I collagen was divided by the total tissue area to generate percent type I collagen in the FOV. The equivalent type I collagen thickness was computed as the percent collagen multiplied by the mean wall thickness for each vessel.
Quantification of type I collagen content in the arteries, large airways and alveoli in the lungs of mice exposed to normobaric normoxia (0 days) or hypobaric hypoxia (3, 6, 10, and 15 days) was also performed by a single observer blinded to experimental condition with a novel approach. In the lung, the arteries were identified by the presence of circumferentially aligned smooth muscle cells, whereas the airways were identified by the presence of circumferentially aligned epithelial cells. First, sections from multiple lungs at each condition were analyzed qualitatively. Then, semi-quantitative analysis was performed to corroborate the qualitative results but only on one lung at each condition due to inconsistencies in airway inflation. For these well-inflated lungs, five to ten identically-sized, large FOV in each of the four transverse sections (viewed at 10× magnification) were analyzed. The area positive for type I collagen as well as the total tissue area were measured after color thresholding in each FOV. The area positive for type I collagen was divided by the total tissue area to generate percent type I collagen in the FOV. In addition, to preliminarily investigate whether the changes in type I collagen were attributable to changes in the small to medium-sized intralobar arteries or the small airways, regions containing muscular arteries and regions containing no muscular arteries were analyzed separately. Muscular-artery FOV contained muscular vessels adjacent to conducting bronchioles; at least two were chosen in each large FOV selected as described above. Non-muscular-artery FOV contained prealveolar, resistance vessels and alveoli; at least two were chosen in each large FOV. The inner diameters of the vessels in the muscular-artery regions were also measured. Several groups have used similar approaches to shift from conventional, qualitative visual scoring systems to software-assisted quantitative techniques successfully (1, 15).
Statistical analysis
Comparisons between the control and experimental groups were performed using ANOVA. Dunnett's multiple testing procedure was used. Sample sizes of 5 were used for all gene expression assays and semi-quantitative analysis of immunohistochemistry on extrapulmonary conduit arteries. Sample sizes of 3 at each duration of hypoxia were used for hydroxyproline and zymography assays. All statistical analyses were performed with SAS software (version 8.2, SAS Institute Inc., Cary, NC). Values are expressed as mean + SD, with a value of p < 0.05 versus normalized control considered significant. All p values were two-sided.
Results
Evidence of HPH
In mice exposed to 10 days of hypoxia, right ventricular free wall weight normalized to body weight was significantly elevated (1.3 ± 0.2 vs. 0.9 ± 0.1 g/g BW; p<0.005), which provides evidence of right ventricular hypertrophy in response to HPH. Normalized left ventricular free wall weight was not changed (3.7 ± 0.3 vs. 3.5 ± 0.2 g/g BW; p=0.33).
Gene expression of collagen and collagen content
Chronic exposure to hypoxia results in pulmonary vascular remodeling including cellular hypertrophy and hyperplasia as well as increased ECM deposition (16). To determine the individual contributions of fibrillar and basement membrane collagen to pulmonary vascular remodeling with HPH, we investigated temporal changes in gene expression of these collagen subtypes. Densitometric analysis for fibrillar procollagen (Figure 1) revealed that mRNA levels increased progressively with exposure to hypoxia. Specifically, mRNA levels of procollagen α1(I), α2(I) and α1(III) were all increased at 15 days. mRNA levels of procollagen α1(I) increased earliest (at 6 days) and to a greater degree than α2(I) or α1(III). Basement membrane procollagen α2(IV) expression (Figure 2) was increased with long-term hypoxia (10 and 15 days) only. Neither short- nor long-term hypoxia had significant effects on mRNA levels of procollagen α1(IV).
Figure 1.
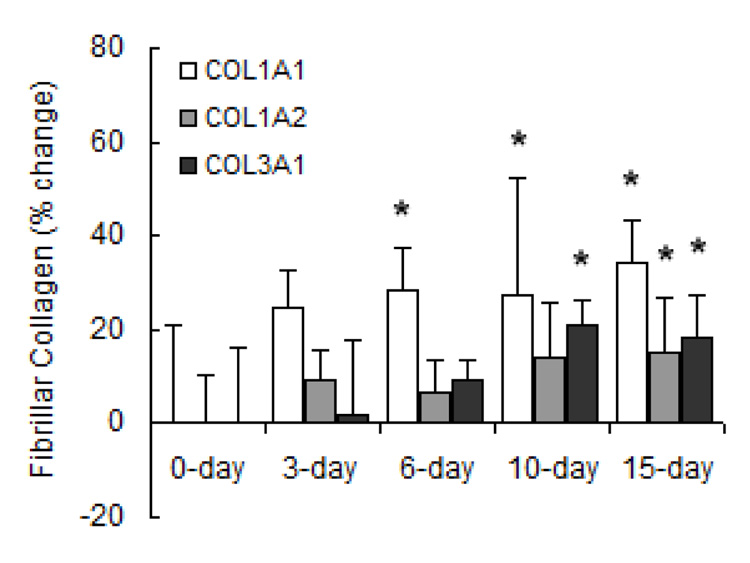
Densitometric analyses of mRNA levels of fibrillar procollagen normalized to β-actin mRNA levels expressed as percent change relative to control. Values are shown as mean + SD (n = 5 in each group except for 0-day, which has n = 10); * indicates p < 0.05 versus 0-day.
Figure 2.
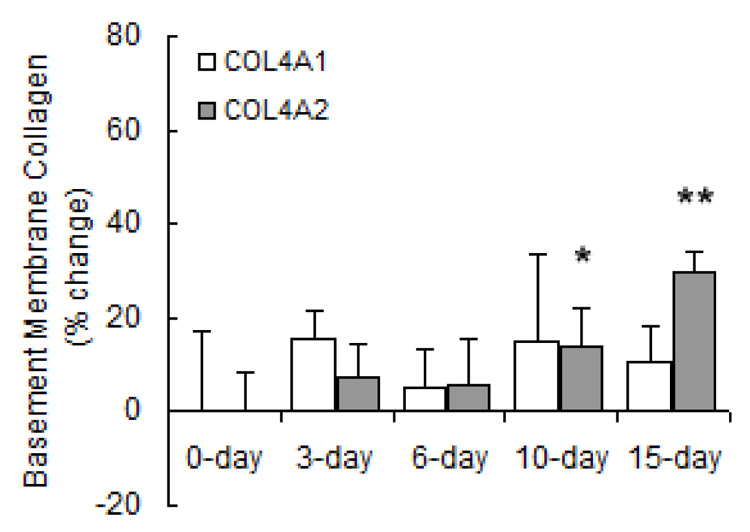
Densitometric analyses of mRNA levels of basement membrane procollagen normalized to β-actin mRNA levels expressed as percent change relative to control. Values are shown as mean + SD (n = 5 in each group except for 0-day, which has n = 10); * indicates p < 0.05 and ** indicates p < 0.001 versus 0-day.
To assess temporal changes in collagen protein expression, whole lung collagen protein content was measured by the hydroxyproline assay. We found that collagen protein expression was increased as early as 6 days and increased monotonically with longer durations of hypoxia (Figure 3).
Figure 3.
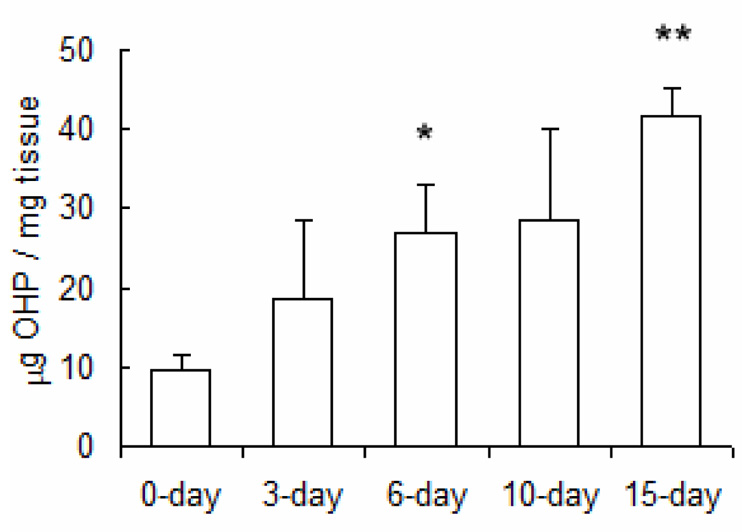
Hydroxyproline content in lung tissue of mice exposed to hypobaric hypoxia normalized by tissue wet weight. Values are shown as mean + SD (n = 3 in each group); * indicates p < 0.05 and ** indicates p < 0.001 versus 0-day.
Because type I collagen was most increased in terms of gene expression, we assessed the local distribution of type I collagen in the lung. Qualitatively, whole lung immunohistochemistry revealed that at all time points, type I collagen was localized within the intralobar pulmonary vasculature and in the subepithelium of the airways. Upon inspection it was evident that type I collagen content increased with long-term hypoxia in the subepithelium of conducting airways (data not shown). Type I collagen accumulation in small and medium-sized intralobar arteries and airways was not evident by qualitative analysis of multiple lungs, a null finding which was corroborated by semi-quantitative analysis of multiple sections from one lung at each condition. Figure 4(a) shows a representative “whole lung” large FOV from a mouse exposed to 10 days of hypoxia. Representative “muscular-artery” (outlined in red) and “non-muscular-artery” (outlined in green) small FOV are also indicated. The amounts of type I collagen, as a percentage of tissue content, in the whole lung, muscular-artery regions, and non-muscular-artery regions are shown in Figure 4(b). No changes with exposure to hypoxia were significant. The muscular-artery regions contained mainly small (25–75 µm) and medium-sized (75–150 µm) muscular arteries. The percentage of type I collagen in these size ranges of vessels are shown in Figure 4(c). Again, no changes with exposure to hypoxia were significant, in agreement with the qualitative results.
Figure 4.
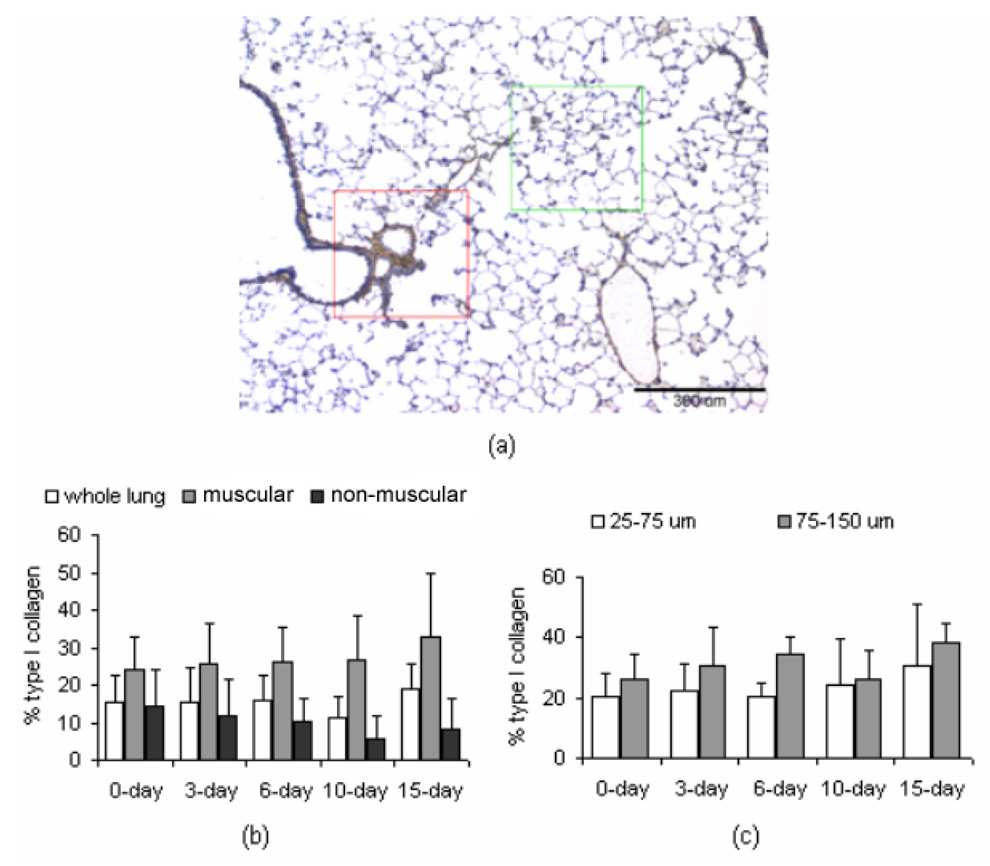
Immunohistochemistry results. (a) Representative micrograph for type I collagen in a “whole lung” FOV of a mouse exposed to 10 days of hypobaric hypoxia. Type I collagen is identified by DAB chromogen (brown); tissue is counterstained with hematoxylin (blue). Within this large FOV, the region outlined in red indicates a “muscular-artery,” small FOV, while the region outlined in green indicates a “non-muscular-artery,” small FOV. Scale bar is 300 µm (b) Percentage of collagen in the whole lung, as well as in the muscular-artery and non-muscular-artery FOVs, of mice exposed to normobaric normoxia (0 days) or hypobaric hypoxia (3, 6, 10 and 15 days). (c) Percentage of collagen in small (25 – 75 µm) and medium (75 – 150 µm) muscular arteries in muscular-artery FOVs. For (b) and (c), values are shown as mean + SD. Data were collected from one mouse per time point, with 4 transverse sections per lung, 5–10 large FOV per section, and 4–6 small FOV per large FOV. Qualitative analysis of similar sections was performed on lungs of five mice per time point.
Prior work has demonstrated collagen accumulation in mouse extralobar PAs with hypoxia via picro-sirius red staining (13). To assess the individual contribution of type I collagen, we used a type I collagen specific antibody to investigate temporal changes in protein content in the right main PA (Figure 5). In each panel, the intima is at the top of the image. The structure of these vessels was consistent with that of large elastic arteries, with three to four elastic lamellae in the media and few smooth muscle cells interspersed. Wall thickness of right main PAs increased significantly with long-term hypoxia. At 0 days, the mean wall thickness was 27 ± 7 µm and increased to 36 ± 7 µm and 39 ± 7 µm, respectively by 10 and 15 days (p < 0.05).
Figure 5.
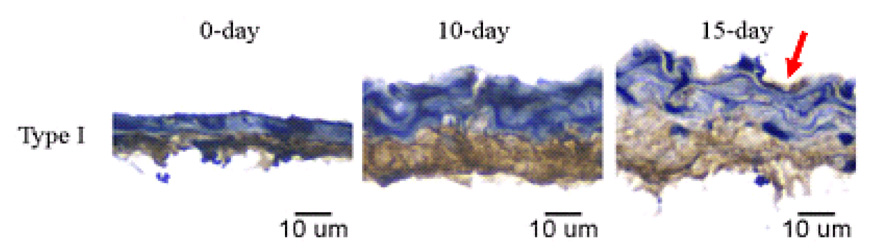
Immunolocalized type I collagen in right main pulmonary arteries of mice exposed to normobaric normoxia (0 days) or long-term hypobaric hypoxia (10 and 15 days). The intima is located at the top of each panel. Red arrow on top row highlights type I collagen deposition in the intima. Type I collagen is identified by DAB chromogen (brown); tissue is counterstained with hematoxylin (blue). Scale bar is 10 µm for all images. Magnification ×40. Representative of arteries from five mice per time point.
Type I collagen was evident in the adventitia of right main PAs at all time points. Interestingly, at 15 days of exposure to hypoxia, type I collagen could be seen in the media and the intima as well. The percentage of type I collagen in the right main PA wall did not change significantly with hypoxia. At 0 days, the mean percentage of type I collagen in the artery wall was 57 ± 7 %, while at 10 and 15 days, it was 56 ± 12 % and 60 ± 2 %, respectively. Type I collagen thickness (percent type I collagen multiplied by wall thickness) in the arterial wall increased slightly but not significantly with hypoxia.
Gene and protein expression of regulators of collagen
MMP gene expression changed significantly with both short- and long-term hypoxia although the degree of change and direction of change (increase vs. decrease) were highly exposure-dependent and MMP-type-dependent. Regarding gene expression of collagenases (Figure 6), hypoxia increased MMP-8 mRNA levels at 3, 6 and 15 days of hypoxia. Hypoxia had no significant effect on MMP-13 gene expression until 15 days, at which time it was decreased below control levels. Regarding gene expression of gelatinases (Figure 7), MMP-2 gene expression increased with long-term hypoxia (10 and 15 days) only. No changes in MMP-9 gene expression were significant. Exposure to hypoxia also had no significant effects on gene expression of TIMP-1 (Figure 8). TIMP-2 mRNA levels were increased over control levels at 6 days and 15 days (Figure 8).
Figure 6.
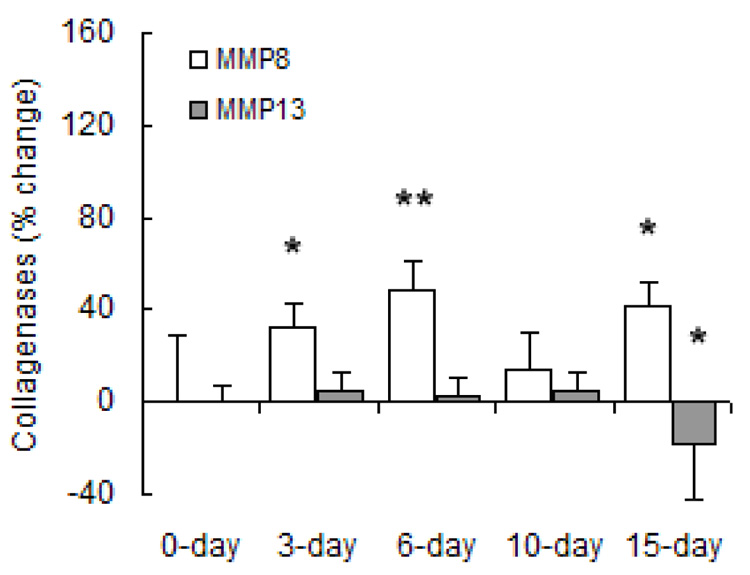
Densitometric analyses of mRNA levels of collagenases normalized to β-actin mRNA levels expressed as percent change relative to control. Values are shown as mean + SD (n = 5 in each group except for 0-day, which has n = 10); * indicates p < 0.05 versus 0-day.
Figure 7.
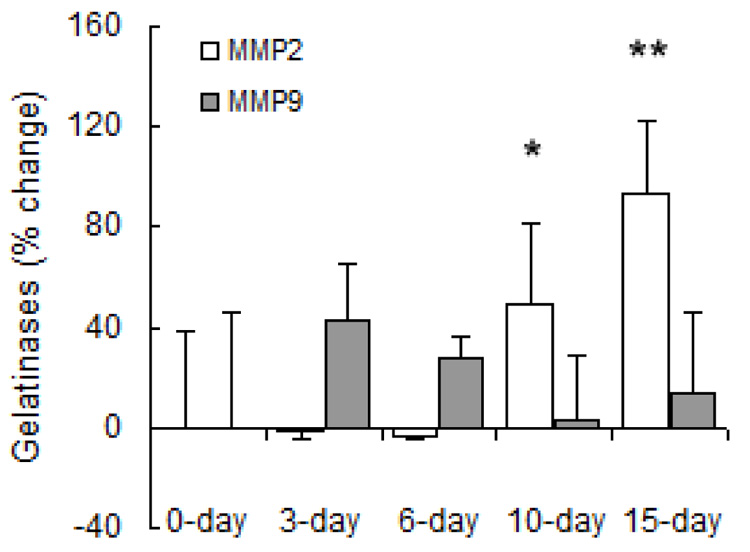
Densitometric analyses of mRNA levels of gelatinases normalized to β-actin mRNA levels expressed as percent change relative to control. Values are shown as mean + SD (n = 5 in each group except for 0-day, which has n = 10); * indicates p < 0.05 and ** indicates p < 0.001 versus 0-day.
Figure 8.
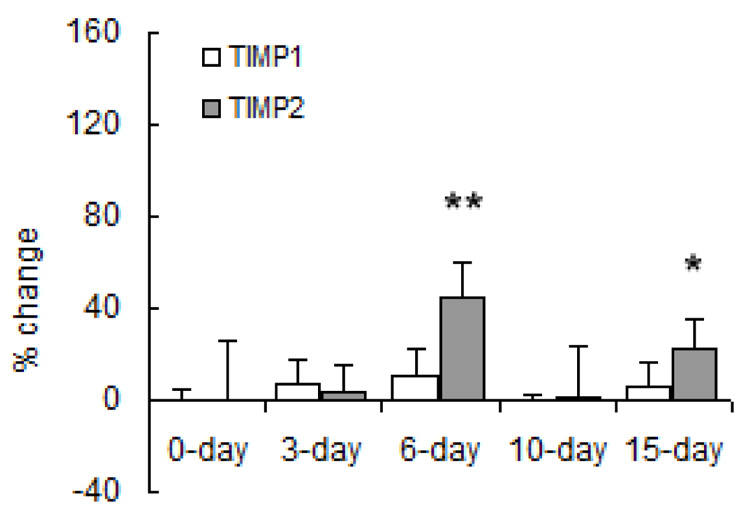
Densitometric analyses of mRNA levels of TIMPs normalized to β-actin mRNA levels from lung tissue of mice exposed to hypobaric hypoxia. Results are expressed as percent change relative to control. Values are shown as mean + SD (n = 5 in each group except for 0-day, which has n = 10); * indicates p < 0.05; ** indicates p < 0.001 versus 0-day.
While increases in gene expression of MMP-2 were not detected until 10 days of hypoxia, MMP-2 protein activity, as measured by SDS-PAGE zymography, tended to be increased over control conditions as soon as 3 days of HPH (Figure 9). Nearly all the MMP-2 detected for all exposure durations was in the active form. Total MMP-2 activity remained elevated over control until 15 days of hypoxia. In contrast, the protein expression of MMP-9 was variable, tending to increase with short-term hypoxia and decrease with long-term hypoxia, although these changes did not reach statistical significance.
Figure 9.
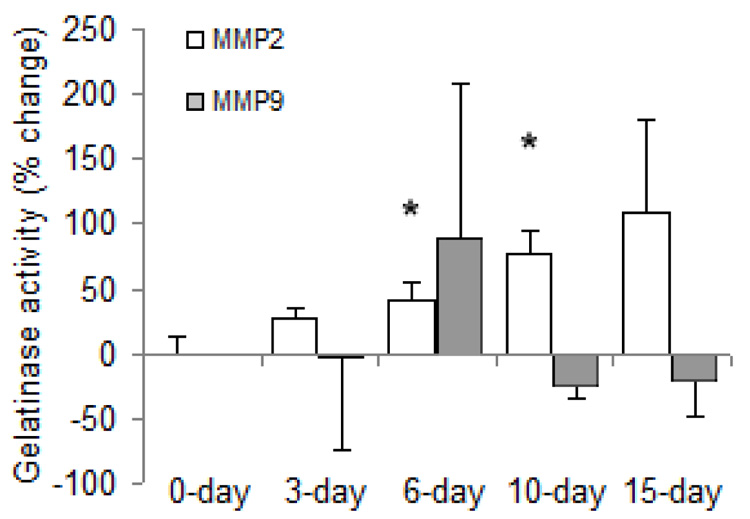
Gelatinase activity in lung tissue of mice exposed to hypobaric hypoxia as a percent change relative to control. Values are shown as mean + SD (n = 3 in each group); * indicates p < 0.05 versus 0-day.
Discussion
Collagen accumulation in the lung can promote the progression of pulmonary hypertension by increasing vascular impedance; it can also alter lung function by decreasing airway compliance. In whole lung homogenates, we observed a significant increase in collagen content with exposure to hypoxia. To identify the changes in gene expression that led to increased lung collagen content, we measured the time-dependent expression of genes involved in pulmonary collagen synthesis and degradation. Our major findings are that gene expression of fibrillar type I collagen is quickly and dramatically increased over control levels with exposure to hypoxia but that protein expression of fibrillar type I collagen does not increase accordingly, except in conducting airways. We also found increases in basement membrane collagen gene expression with long term hypoxia and complex, time-dependent fluctuations in collagenase, gelatinase and TIMP gene expression and gelatinase activity. These gene-level and protein-level changes have important implications for the pulmonary vascular and airway function changes that occur early in HPH.
Collagen-related gene expression
The most substantial change in gene expression we measured was in procollagen α1(I), which increased significantly after just 6 days of hypoxia. Gene expression levels of other subtypes (procollagen α2(I), α1(III), and α2(IV)) were elevated at later time points only, and less dramatically. The increase in procollagen α1(I) gene expression with short-term exposure to hypoxia is in agreement with results from previous studies in rats (3, 20). Both Berg et al. and Poiani et al. exposed rats to normobaric hypoxia and measured mRNA levels of procollagen α1(I) in the lung parenchyma (3) and the right and left main extralobar PAs (20) with methods similar to ours. However, with long-term hypoxia, we found increased gene expression of procollagen α1(I) whereas in these other studies, the levels returned toward control values (3, 20). While differences in species and mode of hypoxia exposure (normobaric vs. hypobaric) cannot be ignored, we speculate that the increase we found is due to increased fibrillar collagen gene expression in medium-sized intralobar arteries and medium-sized and large airways, which were not measured by Berg et al. or Poiani et al. An advantage of the whole lung assay is incorporation of all sizes of arteries and airways in the analysis; a disadvantage is that the size- and compartment- (vascular vs. airway) related differences in expression cannot be determined.
Increased gene expression for collagen is not the only determinant of collagen protein accumulation. Collagen accumulation, redistribution and degradation are also affected by changes in MMP and TIMP gene expression, protein expression and enzymatic activity. That is, the progressive increase in gene expression of fibrillar collagen is unlikely to lead to protein accumulation unless MMP and TIMP gene expression and activity levels remain constant or favor accumulation over degradation. In terms of fibrillar collagen, the upregulation of MMP-8 gene expression at 3, 6 and 15 days of hypoxia should promote degradation but could also be offset by upregulation of TIMP-2 at 6 and 15 days. Analogously, the increase in gene expression of basement membrane procollagen precursors at 10 and 15 days could be counterbalanced by the dramatic increase in MMP-2 gene expression at these time points. Indeed, given that MMP-2 activity also increased with hypoxia duration, as found previously by Frisdal et al. (8), significant accumulation of basement membrane collagen with hypoxia is unlikely.
Enzyme expression and activity are critical to the balance between protein accumulation and degradation. Because the relationship between gene expression and protein expression is unlikely to be linear for any one gene or identical for different genes, we also measured protein content in whole lungs and large vessels for the one collagen type for which gene expression was most increased in whole lung homogenates: fibrillar type I collagen.
Fibrillar type I collagen protein content and distribution
Although gene expression of procollagen α1(I) and α2(I) increased progressively over time in whole lung homogenates, type I collagen protein content was not significantly increased with hypoxia in intralobar vessels or in small airways and alveoli. In large conduit, extralobar PAs, more type I collagen was evident in the media and intima with long-term hypoxia but the percentage increase was not significant. We and others have found that total collagen protein content in the PAs increases with HPH, as measured by the hydroxyproline assay (20, 25) and picrosirius red staining (13). Thus, accumulation of type III collagen may be an important contributor to HPH-induced vascular remodeling.
Implications
Vascular remodeling can either be eutrophic, which involves rearrangement and redistribution of material around a smaller lumen, or hypertrophic, which involves accumulation of material and wall thickening (11, 18). Both types of remodeling may contribute to the narrowing of small, distal pulmonary arteries that increases pulmonary vascular resistance in HPH (9, 16, 22) and the non-specific collagen accumulation in large, conduit arteries (13). An important consequence of collagen accumulation in large arteries is increased stiffness (11, 18), which can increase the pulmonary vascular impedance and, consequently, the right ventricular afterload (26).
The increase in type I collagen in large conducting airways we observed with long-term hypoxia may be partly responsible for airflow limitation (10) and altered lung function (23) that has been found with HPH. Changes in large airways are unlikely to account for increased in airway resistance associated with chronic hypoxia (23); thus we speculate that fibrillar type III collagen accumulation in the small airways also contributes to impaired pulmonary function in HPH.
Genetic manipulation of the laboratory mouse is a powerful tool for investigating mechanisms of human disease. For example, mutations in the gene encoding for bone morphogenic protein receptor type II (BMPR2) have been reported in 50 % of cases of familial pulmonary hypertension (14). As a consequence, mouse models with BMPR2 mutations have been generated to investigate the role of BMPR2 in the etiology of pulmonary hypertension (2, 6). However, the characterizations of the pulmonary phenotype in most genetically engineered strains of mice have been limited to muscularization of the PAs. Alterations in collagen metabolism with pulmonary hypertension – and the consequences for pulmonary vascular and airway biomechanics and hemodynamics – have not been investigated. C57BL/6J mice are typically the genetic background for genetically engineered strains. Thus, with the caveat that many aspects of human disease are not mimicked by mouse models – particularly the extent to which SMC proliferation and ECM accumulation lead to vaso-occlusive plexiform lesions – our results provide important baseline information for understanding the role of BMPR2 and other mutations in the time-dependent changes in collagen remodeling in response to HPH.
Experimental considerations
Here we found changes in gene expression of collagen, MMPs and TIMPs in response to short- and long-term hypoxia. We also found changes in collagen content and enzyme activity although these were only significant at some time points; more of these changes may have become significant with larger sample sizes. In addition, while the changes in collagen, MMP and TIMP gene expression were statistically significant in whole lung sections, our techniques did not differentiate between gene expression changes in the airways and vasculature. Laser capture microdissection can achieve this goal in the pulmonary vasculature (7). Another less precise method of differentiating arterial changes in gene expression from airway changes is parenchymal tissue excision (3, 4). In this approach, thin slivers of lung are sectioned from the most distal part of the lobe and the gene expression in these samples are assumed to reflect changes in airways and capillaries but not arteries, veins, arterioles or venules. Finally, evaluating changes in gene expression specifically in large PAs is technically possible since these can be dissected using microsurgery techniques. However, the amount of tissue available from mouse lungs is small and, in our hands, precluded consistent measurement of gene expression.
In summary, our results show progressive increases in whole lung fibrillar collagen gene expression and overall collagen protein content during exposure to hypoxia and consequent HPH. We also found time-dependent changes in gene expression levels of basement membrane collagen, MMPs and TIMPs, which were suggestive of accumulation of fibrillar collagen protein and redistribution of basement membrane collagen protein. Changes in lung collagen content, as regulated by changes in gene expression, protein expression and enzyme activity of collagens, MMPs and TIMPs, alter vascular and airway structure and function. By detailing these changes, we gain insight into the earliest pathophysiological changes that determine vascular and airway remodeling and ultimately vascular and airway mechanics.
Acknowledgements
This material is based on work supported by the Whitaker Foundation (RG-02-0618), the National Science Foundation (CAREER Grant BES-0234007) and the National Institutes of Health (R01HL086939). The authors would also like to thank Chenara Johnson, Nidal Muvarak and Marilou Wijdicks for technical assistance. Finally, the authors would also like to thank Ingegerd Keith, Ph.D. for helpful comments.
References
- 1.Atkin G, Barber PR, Vojnovic B, Daley FM, Glynne-Jones R, Wilson GD. Correlation of spectral imaging and visual grading for the quantification of thymidylate synthase protein expression in rectal cancer. Hum Pathol. 2005;36:1302–1308. doi: 10.1016/j.humpath.2005.08.016. [DOI] [PubMed] [Google Scholar]
- 2.Beppu H, Kawabata M, Hamamoto T, Chytil A, Minowa O, Noda T, Miyazono K. BMP type II receptor is required for gastrulation and early development of mouse embryos. Dev Biol. 2000;221:249–258. doi: 10.1006/dbio.2000.9670. [DOI] [PubMed] [Google Scholar]
- 3.Berg JT, Breen EC, Fu Z, Mathieu-Costello O, West JB. Alveolar hypoxia increases gene expression of extracellular matrix proteins and platelet-derived growth factor-B in lung parenchyma. Am J Respir Crit Care Med. 1998;158:1920–1928. doi: 10.1164/ajrccm.158.6.9804076. [DOI] [PubMed] [Google Scholar]
- 4.Berg JT, Fu Z, Breen EC, Tran HC, Mathieu-Costello O, West JB. High lung inflation increases mRNA levels of ECM components and growth factors in lung parenchyma. Journal of Applied Physiology. 1997;83:120–128. doi: 10.1152/jappl.1997.83.1.120. [DOI] [PubMed] [Google Scholar]
- 5.Chesler NC, Ku DN, Galis ZS. Transmural pressure induces matrix-degrading activity in porcine arteries ex vivo. Am J Physiol. 1999;277:H2002–H2009. doi: 10.1152/ajpheart.1999.277.5.H2002. [DOI] [PubMed] [Google Scholar]
- 6.Delot EC, Bahamonde ME, Zhao M, Lyons KM. BMP signaling is required for septation of the outflow tract of the mammalian heart. Development. 2003;130:209–220. doi: 10.1242/dev.00181. [DOI] [PubMed] [Google Scholar]
- 7.Fink L, Kohlhoff S, Stein MM, Hanze J, Weissmann N, Rose F, Akkayagil E, Manz D, Grimminger F, Seeger W, Bohle RM. cDNA array hybridization after laser-assisted microdissection from nonneoplastic tissue. Am J Pathol. 2002;160:81–90. doi: 10.1016/S0002-9440(10)64352-0. [DOI] [PMC free article] [PubMed] [Google Scholar]
- 8.Frisdal E, Gest V, Vieillard-Baron A, Levame M, Lepetit H, Eddahibi S, Lafuma C, Harf A, Adnot S, Dortho MP. Gelatinase expression in pulmonary arteries during experimental pulmonary hypertension. Eur Respir J. 2001;18:838–845. doi: 10.1183/09031936.01.00084601. [DOI] [PubMed] [Google Scholar]
- 9.Hislop A, Reid L. New findings in pulmonary arteries of rats with hypoxia-induced pulmonary hypertension. Br J Exp Pathol. 1976;57:542–554. [PMC free article] [PubMed] [Google Scholar]
- 10.Inscore SC, Stenmark KR, Orton C, Irvin CG. Neonatal calves develop airflow limitation due to chronic hypobaric hypoxia. J Appl Physiol. 1991;70:384–390. doi: 10.1152/jappl.1991.70.1.384. [DOI] [PubMed] [Google Scholar]
- 11.Intengan HD, Schiffrin EL. Vascular remodeling in hypertension: roles of apoptosis, inflammation, and fibrosis. Hypertension. 2001;38:581–587. doi: 10.1161/hy09t1.096249. [DOI] [PubMed] [Google Scholar]
- 12.Jeffery TK, Wanstall JC. Pulmonary vascular remodeling: a target for therapeutic intervention in pulmonary hypertension. Pharmacol Ther. 2001;92:1–20. doi: 10.1016/s0163-7258(01)00157-7. [DOI] [PubMed] [Google Scholar]
- 13.Kobs RW, Muvarak NE, Eickhoff JC, Chesler NC. Linked mechanical and biological aspects of remodeling in mouse pulmonary arteries with hypoxia-induced hypertension. Am J Physiol Heart Circ Physiol. 2005;288:H1209–H1217. doi: 10.1152/ajpheart.01129.2003. [DOI] [PubMed] [Google Scholar]
- 14.Lane KB, Machado RD, Pauciulo MW, Thomson JR, Phillips JA, 3rd, Loyd JE, Nichols WC, Trembath RC The International PPH Consortium. Heterozygous germline mutations in BMPR2, encoding a TGF-beta receptor, cause familial primary pulmonary hypertension. Nat Genet. 2000;26:81–84. doi: 10.1038/79226. [DOI] [PubMed] [Google Scholar]
- 15.Matsuo T, Mori H, Nishimura Y, Maeda T, Nakagawa JI, Obashi A. Quantification of immunohistochemistry using an image analyser: correlation with hormone concentrations in pituitary adenomas. Histochem J. 1995;27:989–996. [PubMed] [Google Scholar]
- 16.Meyrick B, Reid L. Pulmonary hypertension. Anatomic and physiologic correlates. Clin Chest Med. 1983;4:199–217. [PubMed] [Google Scholar]
- 17.Morris-Wiman J, Du Y, Brinkley L. Occurrence and temporal variation in matrix metalloproteinases and their inhibitors during murine secondary palatal morphogenesis. J Craniofac Genet Dev Biol. 1999;19:201–212. [PubMed] [Google Scholar]
- 18.Mulvany MJ. Small artery remodeling in hypertension. Curr Hypertens Rep. 2002;4:49–55. doi: 10.1007/s11906-002-0053-y. [DOI] [PubMed] [Google Scholar]
- 19.Pierson DJ. Pathophysiology and clinical effects of chronic hypoxia. Respir Care. 2000;45:39–51. discussion 51–33. [PubMed] [Google Scholar]
- 20.Poiani GJ, Tozzi CA, Yohn SE, Pierce RA, Belsky SA, Berg RA, Yu SY, Deak SB, Riley DJ. Collagen and elastin metabolism in hypertensive pulmonary arteries of rats. Circ Res. 1990;66:968–978. doi: 10.1161/01.res.66.4.968. [DOI] [PubMed] [Google Scholar]
- 21.Preston IR. Clinical perspective of hypoxia-mediated pulmonary hypertension. Antioxid Redox Signal. 2007;9:711–721. doi: 10.1089/ars.2007.1587. [DOI] [PubMed] [Google Scholar]
- 22.Rabinovitch M, Gamble W, Nadas AS, Miettinen OS, Reid L. Rat pulmonary circulation after chronic hypoxia: hemodynamic and structural features. Am J Physiol. 1979;236:H818–H827. doi: 10.1152/ajpheart.1979.236.6.H818. [DOI] [PubMed] [Google Scholar]
- 23.Sekhon HS, Wright JL, Thurlbeck WM. Pulmonary function alterations after 3 wk of exposure to hypobaria and/or hypoxia in growing rats. J Appl Physiol. 1995;78:1787–1792. doi: 10.1152/jappl.1995.78.5.1787. [DOI] [PubMed] [Google Scholar]
- 24.Stenmark KR, Fagan KA, Frid MG. Hypoxia-induced pulmonary vascular remodeling: cellular and molecular mechanisms. Circ Res. 2006;99:675–691. doi: 10.1161/01.RES.0000243584.45145.3f. [DOI] [PubMed] [Google Scholar]
- 25.Tozzi CA, Christiansen DL, Poiani GJ, Riley DJ. Excess collagen in hypertensive pulmonary arteries decreases vascular distensibility. Am J Respir Crit Care Med. 1994;149:1317–1326. doi: 10.1164/ajrccm.149.5.8173773. [DOI] [PubMed] [Google Scholar]
- 26.Tuchscherer HA, Vanderpool RR, Chesler NC. Pulmonary vascular remodeling in isolated mouse lungs: Effects on pulsatile pressure-flow relationships. J Biomech. 2007;40:993–1001. doi: 10.1016/j.jbiomech.2006.03.023. [DOI] [PubMed] [Google Scholar]
- 27.Vyas-Somani AC, Aziz SM, Arcot SA, Gillespie MN, Olson JW, Lipke DW. Temporal alterations in basement membrane components in the pulmonary vasculature of the chronically hypoxic rat: impact of hypoxia and recovery. Am J Med Sci. 1996;312:54–67. doi: 10.1097/00000441-199608000-00002. [DOI] [PubMed] [Google Scholar]
- 28.Weitzenblum E, Chaouat A. Sleep and chronic obstructive pulmonary disease. Sleep Med Rev. 2004;8:281–294. doi: 10.1016/j.smrv.2004.03.006. [DOI] [PubMed] [Google Scholar]
- 29.Woessner JF., Jr The determination of hydroxyproline in tissue and protein samples containing small proportions of this imino acid. Arch Biochem Biophys. 1961;93:440–447. doi: 10.1016/0003-9861(61)90291-0. [DOI] [PubMed] [Google Scholar]
- 30.Zhong H, Simons JW. Direct comparison of GAPDH, beta-actin, cyclophilin, and 28S rRNA as internal standards for quantifying RNA levels under hypoxia. Biochem Biophys Res Commun. 1999;259:523–526. doi: 10.1006/bbrc.1999.0815. [DOI] [PubMed] [Google Scholar]