

Abstract
The intricate geometry of cytoskeletal networks and internal membranes causes the space available for diffusion in cytoplasm to be convoluted, thereby affecting macromolecule diffusivity. We present a first systematic computational study of this effect by approximating intracellular structures as mixtures of random overlapping obstacles of various shapes. Effective diffusion coefficients are computed using a fast homogenization technique. It is found that a simple two-parameter power law provides a remarkably accurate description of effective diffusion over the entire range of volume fractions and for any given composition of structures. This universality allows for fast computation of diffusion coefficients, once the obstacle shapes and volume fractions are specified. We demonstrate that the excluded volume effect alone can account for a four-to-sixfold reduction in diffusive transport in cells, relative to diffusion in vitro. The study lays the foundation for an accurate coarse-grain formulation that would account for cytoplasm heterogeneity on a micron scale and binding of tracers to intracellular structures.
Introduction
Realistic models of macromolecular diffusion in cells have been recently of renewed interest (1,2) in the light of in vivo experiments that involve naturally fluorescent proteins (3–5). Tracer molecules in the cell diffuse in a crowded environment filled with other solutes and large intracellular structures, such as cytoskeletal meshwork and internal membranes (6). Even in the absence of intracellular structures, diffusion of a tracer in the cytosol is affected by macromolecular and hydrodynamic interactions and therefore constitutes a complicated many-body problem (7). Remarkably, its solution for repulsive interactions is formulated in terms of the self-diffusion of individual particles with a diffusion coefficient corrected for macromolecular crowding and hydrodynamic effects (2,8,9); we denote this coefficient, which describes diffusion in cytosol free of intracellular structures, by D0. Note that D0 is different from the diffusion coefficient in a dilute aqueous solution, Din vitro.
Diffusion of a tracer is further hindered by cellular structures that are largely immobile, i.e., cytoskeleton, endoplasmic reticulum (ER), and other internal membranes (10). This is due to increased path lengths and potential binding interactions (diffusion may also slow down due to an increase in viscosity in the proximity of a structure). The increase in path length, sometimes termed the effect of excluded volume, is the focus of this article. Both in vitro studies (11) and experiments where inert particles were microinjected into living cells (12–15) indicate that the excluded volume effect can be significant. A possible role of intracellular structures as diffusion barriers in forming cAMP microdomains is discussed in Rich et al. (16).
Macromolecular diffusion in a convoluted space is notoriously difficult to describe; in fact, it is legitimate to ask whether Fick's law and the notion of an effective diffusion coefficient is applicable to diffusive fluxes in a disordered medium (17). The issue can be addressed by analyzing time dependence of the mean-squared displacement, 〈x2(t)〉, for a particle undergoing random walks in an occluded space (the angular brackets denote ensemble averaging). One such numerical experiment with randomly distributed spherical obstacles is described in Fig. 1 (see Methods for computation details). In agreement with earlier Monte Carlo studies of diffusion on lattices (18) and experiments with diffusion in gels (11), 〈x2(t)〉 is linear on a sufficiently large spatial scale: 〈x2〉 ∝ t (inset in Fig. 1 b). This is a signature of normal diffusion with an effective diffusion coefficient Deff = limt→∞〈x2〉/(6t).
Figure 1.
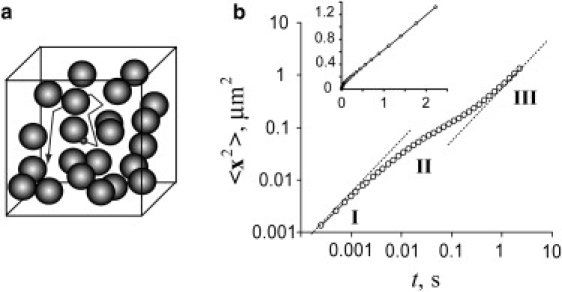
Monte Carlo simulations of particle tracking. (a) Schematic of diffusion of a tracer amid random spherical obstacles; (b) Three diffusive regimes demonstrated by a log-log plot of 〈x2(t)〉 of a tracer for high obstacle number density: I, unobstructed diffusion; II, intermediate (anomalous) behavior; and III, normal effective diffusion. Simulation parameters are described in Methods. (Inset) Same dependence in linear scales.
For inaccessible volume fractions in a biologically relevant range, ϕ = 0.1–0.5 (10), effective diffusion takes place on the length scale λ determined approximately by the average distance between obstacles and the tracer size: λ ≈ 0.1–0.5 μm (19–21) (see also Fig. 2, a and c, and below for detailed discussion of spatial scales). In the proximity of the percolation limit ϕc (a minimum inaccessible volume fraction at which the tracer is trapped by obstacles), λ diverges as (ϕc − ϕ)−0.88 (22), and for ϕ ≥ ϕc, 〈x2〉 is no longer ∝ t (anomalous diffusion) (17). For large tracers, the inaccessible volume can be greater than the volume occupied by obstacles (Fig. 3): for example, for the tracer diffusing amid filaments, the inaccessible volume is approximately four times the volume of the filaments, if the diameters of the tracer and the filaments are equal. The increase in inaccessible volume can bring the system to a percolation limit. Indeed, anomalous diffusion of 0.3-μm granules has been observed in actin meshwork with a volume density of ∼1%, virtually impermeable for particles of this size (23,24).
Figure 2.

Actin filaments and ER, simulated and in vivo. (a) Electron micrograph of actin filaments in a keratocyte (adapted from (21)). (b) Representation of cytoskeletal filaments by long thin cylinders (aspect ratio χ = 100, excluded volume fraction ϕ = 0.0636). (c) Optical section of ER of the unfertilized sea urchin eggs, courtesy of Mark Terasaki (confocal depth is 2–3 μm; see (20) for experimental details). (d) Modeling of ER sheets by random three-dimensional disks (aspect ratio χ = 0.125, excluded volume fraction ϕ = 0.2926). As in confocal sectioning, the image was obtained by combining z sections from a 2.5 μm-thick slice. Note that the bright lines in the image are not short filaments, but rather cumulative projections of disks nearly orthogonal to the confocal plane.
Figure 3.

Diffusion of a tracer of finite size among obstacles of volume v modeled as diffusion of a point particle among effective obstacles of volume v′. The increase in obstacle size equals the tracer radius. Even if the real obstacles do not overlap, the effective ones may partially intersect.
In this article, we analyze how microgeometry of intracellular structures affects Deff. Determining an effective property of a composite medium is a classical problem that dates back to Poisson, Faraday, Clausius and Mossotti, and Lorentz and Lorenz, who studied effective magnetic, dielectric, and optical properties of heterogeneous materials (25). The problem of computing Deff for a medium with obstacles is mathematically equivalent to determining the effective conductivity, σeff, of a conductor with dielectric inclusions, where σeff is the analog of the transformed effective diffusion coefficient (25,26). In 1873, Maxwell solved for the conductivity of a dilute suspension of spheres and found σeff = σ0(1 − 1.5ϕ). This result was generalized to other shapes of inclusions (27): σeff = σ0(1 − αϕ), where α differs from 1.5, depending on the shape and spatial positioning of inclusions (for example, α = 5/3 in the case of randomly oriented long cylinders). Numerical approaches to computing α for irregular shapes have been discussed in Douglas and Garboczi (28). The dilute solution approximation does not apply to ϕ in the range typical for intracellular structures (26). Extension to larger ϕ for spheres, derived with an effective-medium approximation (29), yields σeff = σ0(1 − ϕ)3/2. A general form of this power law, σeff = σ0(1 − ϕ)m, known as Archie's law (30), has been shown empirically to be a useful approximation for some natural composites. Still, this law breaks down when the shape of obstacles differ significantly from spherical. Overall, no general solution has been found for this classical problem (25,31).
This study presents the first systematic numerical approach to the problem in the context of effective diffusion in cells. The Monte Carlo method used to obtain the results of Figs. 1 and 4 is conceptually simple, but is prohibitively expensive for a comprehensive study. We have developed a fast algorithm based on the concept of homogenization (32). Details of the algorithm, along with representation of intracellular geometry, are described in the Model, below. We have found that for random overlapping obstacles, a simple two-parameter power law provides a remarkably accurate description of the excluded volume effect over the entire range of volume fractions and obstacle shapes (see Results). This universality allows for fast computation of effective diffusion coefficients, once the shapes of obstacles and their excluded volume fractions are specified. Estimates obtained for obstacles characteristic of intracellular structures demonstrate that the excluded volume effect is a major factor that accounts for most reduction in diffusivity in cells, relative to diffusion in vitro. In the Discussion, the results are compared with experimental data.
Figure 4.

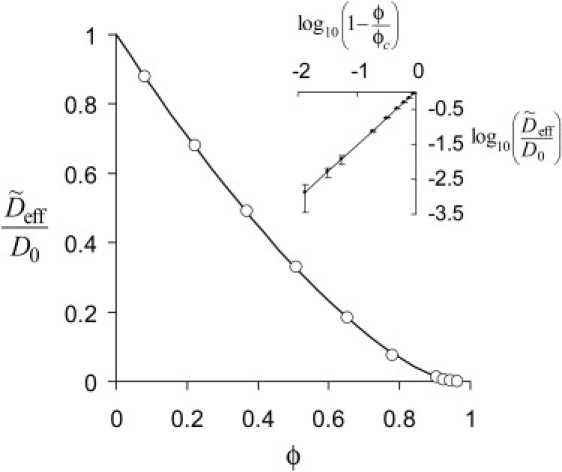
Deff(ϕ)/D0 for random spheres, from Monte Carlo simulations (solid dots with error bars) and by the homogenization method with different number of obstacles per unit cell. (Inset) Deff(ϕ)/D0 in the vicinity of ϕc = 0.955.
Model
Irregular geometry of intracellular structures is approximated by sets of randomly positioned, overlapping obstacles, the approach known as a Swiss-cheese model (33). Cytoskeletal filaments are mimicked by long thin cylinders (Fig. 2 b), whereas thin flat disks approximate sheetlike regions of internal membranes (Fig. 2 d). Disks and cylinders are the shapes with limiting values of the aspect ratio χ = h /2r, equal to 0 and ∞, respectively (r is radius of the cylinder and h is its height). In studying the effect of obstacle shape on Deff, we also consider cylinders with intermediate aspect ratios, as well as spheres. By allowing the obstacles to intersect, deformable and branching structures are conveniently modeled by means of rigid objects of simple shapes (Fig. 2, b and d). In addition, when the finite size of a tracer is taken into account through a corresponding increase in the obstacle size, the resulting effective obstacles may intersect, at least partially (Fig. 3). Structural disorder, typical of the intracellular environment, is achieved by placing and orienting obstacles randomly in space.
In the Swiss-cheese model, with no restrictions on overlapping of obstacles, the fraction of inaccessible volume is ϕ = 1 − exp(−V), where V is the sum of volumes of individual obstacles per unit volume. The relation is derived in Supporting Material, along with an interpolation formula for the case where only partial intersection is allowed. For identical obstacles, V = nv0, where v0 is the volume of one obstacle and n is the obstacle number density. Inversely, V can be expressed in terms of ϕ: nv0 = ln[(1 − ϕ)−1]. For a cytoskeletal network, an estimate of an average distance between the obstacles is (see derivation in Supporting Material) and yields ∼0.05 μm for r = 5 nm (10) and ϕ = 0.01 (34). For the disks, a similar estimate yields the distance ∼h/(nv0) ≈ 0.2 μm for h = 0.1 μm and ϕ = 0.4 (10).
These estimates agree with experimental findings (Fig. 2, a and c) and give an idea about a length scale for which the concept of the effective diffusion coefficient is applicable. Indeed, the log-log plot of 〈x2(t)〉 for spherical obstacles (Fig. 1 b) exhibits three distinct diffusive regimes observed at different length- and timescales. The first is unobstructed diffusion in the space between neighboring obstacles. It is observed on a scale of less than the average distance between the obstacles, i.e., at submicron lengths. Once the tracer hits the obstacle, it enters an intermediate (anomalous) diffusive regime where 〈x2(t)〉 is no longer ∝ t. Yet on a larger length scale, the mean-squared displacement becomes again linear in time, signifying re-emergence of normal diffusion characterized by Deff. Simulations for other shapes and on lattices (18) yield similar results, which also agree with the experimental data (11). An important observation that follows from the Monte Carlo studies is that when ϕ is not too close to the percolation threshold, normal diffusion resumes on lengths that are comparable to several average distances between the obstacles: at these lengths, the current and initial positions of the tracer are no longer correlated. From estimates of characteristic mesh sizes of intracellular structures, we conclude that the concept of an effective diffusion coefficient holds on a micron scale.
Existence of two distinctly different spatial scales allows one to compute Deff based on the principle of homogenization (32,25). The method is an alternative to microscopic particle tracking mimicked by Monte Carlo simulations and is equivalent to determining effective diffusion coefficients from Fick's law: the steady-state diffusive flux is measured as a function of the concentration difference maintained between the opposite sides of a large rectangular box. Mathematically, homogenization is an asymptotic analysis that utilizes a small parameter, the ratio of micro- and macro-length scales, to obtain accurate effective characteristics of the medium (35). We used this approach to develop a numerical algorithm for computing Deff more efficiently than from stochastic simulations. The algorithm, described in Methods, made it possible to perform extensive numerical studies of various factors that affect Deff.
The homogenization technique was originally formulated for composites with periodic microstructures (36). Consider a periodic arrangement of identical obstacles in a large rectangular box Ω with the free space Ω1 in it and φ = 1 − |Ω1|/|Ω|. The spatial periods a1, a2, and a3 in respective Cartesian directions are such that the ratio
is small: ɛ ≪ 1. The diffusion coefficient,
oscillates with the same periods.
Steady-state diffusive fluxes in Ω are determined by the tracer distribution uɛ(x), found by solving the equation
| (1) |
with the Dirichlet boundary conditions maintaining mismatch of the tracer concentrations at the opposite sides of Ω.
The idea behind homogenization is that when ɛ → 0, uɛ(x) converges to a homogenized distribution u0(x) that satisfies a macroscopic diffusion equation similar to Eq. 1. Note that u0(x) is defined only in free space (as is uɛ(x)), so that the macroscopic density is u′(x) = (1−ϕ) u0(x) (26); also, the effective diffusion coefficient is generally a tensor because periodic structures of asymmetric obstacles are anisotropic. Therefore, the macroscopic diffusion equation is
| (2) |
The tensor , (i,j = 1, 2, 3), is obtained by means of multiscale analysis (25) that takes advantage of the smallness of ɛ in Eq. 1 (see Supporting Material for details). The result is that are expressed in terms of auxiliary functions wi(x) (i = 1, 2, 3) defined in the unit cell ω = (0, a1)x(1, a2)x(1, a3) and determined by solving
| (3) |
in ω with periodic boundary conditions; ei, i = 1, 2, 3, are the orts co-linear with the edges of ω (and Ω). Then,
| (4) |
where ω1 is the free space in ω (see Supporting Material for derivation). Then, for isotropic periodic structures, the actual effective diffusion coefficient Deff (ϕ) is
| (5) |
The concept of homogenization can be extended to random structures where stochastic homogeneity is the analog of periodicity (25). This is done by approximating a disordered medium with a periodic one, where the unit cell ω includes N randomly placed obstacles; N should be sufficient to yield, for a given number density of obstacles n, a statistically stationary Deff. In practical terms, the question is how many obstacles per unit cell, N = n |ω|, would yield a sufficiently accurate approximation of Deff/D0 (say, with an absolute error of 0.01). The value N might not be necessarily large for biologically relevant n, since the tracer achieves normal diffusion after bypassing only few obstacles. In the proximity of the percolation limit, however, N must be large, as the free space breaks into weakly connected large linear clusters.
To estimate an appropriate N, the homogenization method was applied to randomly placed spheres. The values of Deff, N (ϕ), computed for N = 50, 100, 200, and 400 (Fig. 4), compare well with Deff (ϕ) obtained from the Monte Carlo simulations (see Methods for simulation details). Even with N as small as 50, the homogenization method yields sufficiently accurate results. In this study, we used N ∼ 2500 to obtain Deff with the absolute error <0.02.
Methods
Monte Carlo simulations
Stochastic trajectories of N tracers, xi(t), i = 1,…, N, are generated in a sufficiently large box with randomly placed obstacles. The position of a tracer is advanced with a fixed time step Δt,
where ξi are random vectors uniformly distributed in [−1,1]3 and D is the diffusion coefficient in free space. If the tracer collides with an obstacle, new trials are performed to find a position in the accessible space. Monte Carlo integration is used to evaluate ϕ. The mean-squared displacement is computed as
Results were obtained for D = 1 μm2/s with Δt = 10−6–10−7 s and N > 104. Accuracy of results is limited by computational cost: error bars in Fig. 4 reflect both the statistical error due to finite N and the truncation error due to finite t.
Homogenization algorithm
The algorithm, based on Eqs. 3–5, involves solving Eq. 3 and a subsequent evaluation of diagonal values of (Eq. 4). A Poisson solver for solving Eq. 3 with periodic boundary conditions has been implemented in VCell (37,38). A three-dimensional geometry, generated automatically from a set of obstacles by a custom-written code, was entered in VCell as a z stack of two-dimensional images. Because the structure of randomly arranged obstacles is expected to be isotropic, was computed as with evaluated according to Eq. 4. For details of the algorithm as well as its validation and error analysis, see Supporting Material.
Fitting of Eq. 6 to computed values of was done by seeking, through variations of ϕc, an optimal linear fit of as a function of log(1−φ/φc); the line slope then yields parameter μ. The least-squares fitting to a linear function was performed with the Excel optimization solver (Microsoft, Richmond, WA).
Computation time
All computations were done on an Altix 3700 (SGI, Fremont, CA) with a 1.6 GHz Itanium II CPU. The Monte Carlo method required an average of 100 hours per point in Fig. 4, whereas the homogenization method takes only half an hour for a datapoint of comparable accuracy.
Results
In this section, we show that the excluded volume effect of a mixture of random obstacles of varying shapes can be understood in terms of effective diffusion occluded by a system of overlapping spheres. This universality allows one to estimate the effective diffusion coefficient for a mixture of structures with shapes and composition characteristic of the intracellular environment.
The dependence (φ) is described accurately by a two-parameter power law
The dependence Deff (ϕ) in Fig. 4 is complicated. Linear at small volume fractions, it decreases more rapidly for ϕ > 0.5 before inflecting near the percolation threshold (inset in Fig. 4). However, when presented in terms of , the function assumes a simpler form (Fig. 5) resembling a power function, . This function is predicted by percolation theory, but only near the percolation limit. Remarkably, our data for are fitted well by the two-parameter power law,
| (6) |
over the entire range of volume fractions and for all shapes! (Interestingly, the same function approximates well the effective conductance of a variety of binary metal-insulator mixtures over a wide range of ϕ (39).)
Figure 5.
for random spheres obtained with N = 2560 (symbols) and fitted by Eq. 6 (solid curve). (Inset) plotted as a function of log(1 − ϕ/ϕc); best linear fit is obtained with ϕc = 0.955.
For spheres, the best fit is with ϕc = 0.955 ± 0.025, μ = 1.47 ± 0.03 and the fitting error of ≈0.003 (the fitting error is the average difference between the power law of Eq. 6—shown by solid line in Fig. 5—and the datapoints). The results for ϕc and μ agree with the previously published data: ϕc = 0.9699 ± 0.0003 (40) (similar values were also reported in (41)) and μ = 1.6 ± 0.2 (42). For overlapping circles, another example with known parameter values, ϕc = 0.6763 (43) and μ = 1.3 ± 0.1 (33,44) (see also (45,46)), from our numerical experiments is best approximated by Eq. 6 with ϕc = 0.672 ± 0.025 and μ = 1.35 ± 0.05; an average error of fit is 0.01 (Fig. S3). The insets in Fig. 5 and Fig. S3 demonstrate linearity of as a function of log10(1 − ϕ/ϕc); this illustrates applicability of Eq. 6 over the entire range of ϕ.
Equation 6 describes equally well for shapes other than spherical (Fig. 6 and Fig. 7 a). Overall, our numerical results indicate that Eq. 6 accurately describes for the Swiss-cheese model, over a wide range of ϕ and for all obstacle shapes. When recalculated in terms of the actual effective diffusion coefficient Deff, the equation takes the form
| (7) |
From a technical viewpoint, describing and Deff (ϕ) by two-parameter functions greatly simplifies computations for arbitrary shapes. It follows from a dilute limit expansion that μ = α × ϕc, and the problem reduces to determining α and ϕc. The value of α can be accurately estimated by computing the transformed effective diffusion coefficient for some small volume fraction ϕ1. For this, diagonal values of are computed based on Eqs. 3 and 4 for one obstacle placed at the center of a unit cube; then . A few other values of for different volume fractions ϕ are required to determine ϕc from fitting to Eq. 6 (see Methods for details).
Figure 6.
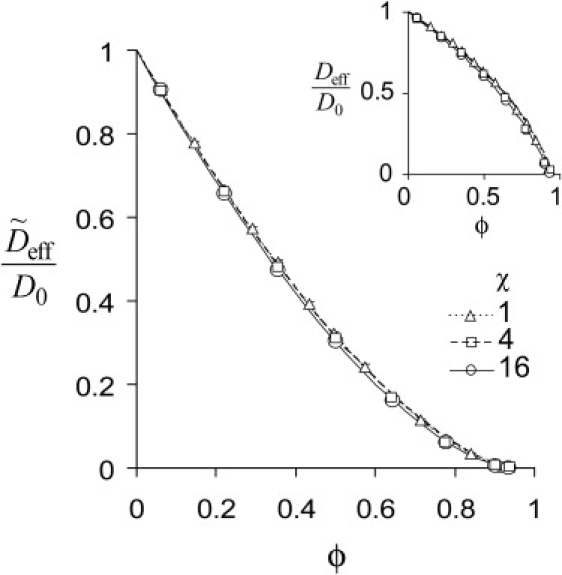
for random cylinders (N = 2560) fitted by Eq. 6. (Inset) Corresponding Deff(ϕ)/D0 fitted by Eq. 7.
Figure 7.
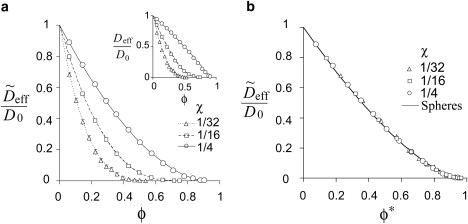
Randomly distributed disks. (a) for χ = 1/4, 1/16 (N = 2560) and χ = 1/32 (N = 320), fitted by Eq. 6. (Inset) Corresponding Deff(ϕ)/D0 fitted by Eq. 7; (b) collapse of onto with ϕ∗ defined by Eq. 8 and for k(χ) from Table S1.
Effect of structure shape on Deff
A spectrum of shapes, from prolate to oblate, has been studied with the use of cylinders of varying aspect ratios χ (see Model for definition). For all of them, the effective diffusion coefficients are accurately described by Eqs. 6 and 7; corresponding values of ϕc and μ are summarized in Table 1. The results for elongated cylinders, shown in Fig. 6, are essentially independent of the aspect ratio: the curves obtained for χ = 1, 4, and 16 are barely distinguishable. Moreover, ϕc and μ for long cylinders are close to those obtained for spheres. Therefore, diffusion of a tracer through a network of cytoskeletal filaments is fully determined by the fraction of inaccessible volume.
Table 1.
Parameters μ and ϕc for various shapes (aspect ratios χ)
| Aspect ratio, χ | μ | ϕc |
|---|---|---|
| 16 | 1.58 | 0.942 |
| 4 | 1.56 | 0.953 |
| 1 | 1.54 | 0.946 |
| 0.25 | 1.79 | 0.925 |
| 0.0625 | 2.66 | 0.74 |
| 0.03125 | 3.44 | 0.59 |
| Sphere | 1.47 | 0.955 |
The situation is qualitatively different for oblate obstacles, represented in our numerical experiments by disks with small aspect ratios. Here, the dependencies Deff (ϕ) differ significantly for different values of χ (Fig. 7 a): thinner disks are more efficient, relative to the occupied volume, in impeding the tracer. In fact, for sufficiently small χ, the excluded volume fraction is no longer a meaningful parameter for describing effective diffusion, because both the volume fraction and the percolation threshold change synchronously with the aspect ratio. It is intuitively clear that the actual space shielded by the disk is essentially equidimensional, with a linear size of approximately the disk radius, r. Indeed, we have found that under the scaling transformation r∗ = k(χ)r, the dependencies for disks collapse onto the dependence for spheres with the equivalent volume fraction ϕ∗ calculated as
| (8) |
(see Supporting Material for derivation). The quality of collapse is illustrated in Fig. 7 b for χ = 1/4, 1/16, and, 1/32. The corresponding values of k(χ), along with k(1/250), are given in Table S1. This remarkable universality suggests a method for estimating Deff (ϕ) for a mixture of shapes, with spheres effectively replacing objects of varying shapes. The method is used in subsequent sections.
Finally, we estimate Deff of a subnanometer molecule diffusing 1), through a network of cytoskeletal filaments and 2), in the presence of the sheetlike ER. In this case, the inaccessible volume equals the volume of the structure (for larger particles, see Effect of Tracer Size). For cytoskeletal filaments, Eq. 7 with the long-cylinder parameters, μ = 1.58 and ϕc = 0.942, and ϕ ≈ 0.1 yields Deff ≈ 0.93 D0, indicating only a minor effect. One can also ask how dense the cytoskeletal network should be to slow a small molecule by 90%. To find the corresponding ϕ, we solve Eq. 7 with Deff/D0 = 0.1 and the μ and ϕc, as above. The result, ϕ ≈ 0.89, corresponds to extremely tight packing, with the cytosol occupying only 11% of volume.
The sheets of ER can be modeled as oblate objects. Disks with an aspect ratio of χ = 1/32 and a thickness of h = 100 nm have a diameter 2r =3.2 μm, not an unreasonable number (Fig. 2 c). The parameters of the power law for this aspect ratio are μ = 3.44 and ϕc = 0.59 (Table 1), and for ϕ = 0.1, as in the previous example, Eq. 7 yields Deff ≈ 0.59 D0. We conclude that the internal membranes have a major impact on the effective tracer diffusion.
Mixture of shapes
Membrane organelles and cytoskeleton can both be present in the same micron-scale volume unit. Therefore, it is necessary to be able to describe effective diffusion for a mixture of shapes. The question then arises whether Eq. 6 can describe for a mixed structure and if so, how to express the mixture parameters μ and ϕc in terms of the parameters for individual forms.
Our numerical experiments show that Eq. 6 does hold for structures composed of different shapes. Fig. 8 a shows results of one such experiment, where is computed for a mixture of cylinders (χ = 4) and disks (χ = 1/16) with equal individual volumes and number densities. In general, a mixture of obstacles of two different shapes and sizes is defined by the individual volumes, v1 and v2, and the number densities, n1 and n2 of the components. Numerical experiments, in which all of these parameters were varied independently, have shown that if the sizes are of the same order of magnitude, the effective diffusion coefficient of a tracer depends on the ratio V1/V2 ≡ n1v1/n2v2, rather than on individual parameters. In this case, diffusion in the mixture is fully characterized by phase fractions, f1 = V1/(V1 + V2) and f2 = V2/(V1 + V2), f1 + f2 = 1, and by parameters μ1, ϕc,1 and μ2, ϕc,2 for pure forms. We measured percolation thresholds for two-shape mixtures of varying composition and found that the dependence on individual fractions is essentially linear, φc ≈ φc,1f1 +φc,2f2. Fig. 8 b presents results for the mixtures of cylinders (shape 1) and disks (shape 2) with the aspect ratios of 4 and 1/16, respectively.
Figure 8.

Mixture of shapes. (a) for the mixture of cylinders (χ = 4) and disks (χ = 1/16) with phase fractions f1 = f2 = 0.5, fitted by Eq. 6 (solid line). (Inset) Corresponding Deff(ϕ)/D0 fitted by Eq. 7. (b) Percolation threshold ϕc for the cylinder-disk mixture as a function of disk fraction, f2. Error bars reflect the difference between values obtained by fitting to Eq. 6 and determined directly from sampling an appropriate interval of ϕ with steps Δϕ ≈ 0.01–0.02.
To determine the exponent μ(f2) for the mixture of a given composition (f1, f2), note that μ(f2) = α(f2) × ϕc(f2), where α is the slope of in the dilute limit, and in which overlapping of obstacles is negligible. This then results in a linear superposition,
and back-substitution yields
We can now estimate Deff of a tracer for a mixture of structures with shapes and composition characteristic of the intracellular environment. From the data available for hepatocytes (10), ϕ ≈ 0.44. For small tracers, the effect of cytoskeleton can be ignored (see discussion of the effect of the cytoskeleton on large tracers below). Organelle shapes can be classified as oblate and spheroidlike, with the corresponding volumes being in proportion 3:5, respectively (10). We therefore model the excluded space as a mixture of overlapping disks (shape 1) and spheres (shape 2) with ϕ = 0.44 and V1/ V2 = 0.6 (f1 = 0.375 and f2 = 0.625). Assuming χ = 1/32 for the disks, the corresponding percolation threshold of the mixture is ϕc = 0.818 and the exponent is μ = 2.58. Then, from Eq. 7, Deff ≈ 0.24 D0. Thus, effective diffusion of a small tracer in the cytoplasm is predicted to be four times slower than that in the extracts free of intracellular organelles.
An alternative way of estimating Deff in this case is to use the disk-to-sphere mapping, as described above. Accordingly, disks can be replaced with spheres, so that
with
(see Supporting Material for derivation). For f1 = 0.375, f2 = 0.625, and ϕ = 0.44 as above, and k(1/32) = 0.578, ϕ∗ ≈ 0.716. Then, using the sphere parameters, μ2 = 0.955 and ϕc,2 =1.47, and . Thus, both methods yield similar estimates of the effective diffusion coefficient in the cytoplasm.
Effect of tracer size
The tracer size has little or no effect on diffusion in the presence of oblate objects with small aspect ratios (membrane sheets). Although thicker membranes occupy larger volume, Deff in this case is essentially insensitive even to significant changes of the aspect ratio. Indeed, because ϕ ≪ 1, , and can be estimated through mapping onto effective spheres,
where ϕ∗ is defined by Eq. 8,
(again exploiting the smallness of ϕ). The overlap of disks is also small, so that φ ≈ nπr3χ (n is the number density), hence, φ∗ ∼ k3(χ). Because k(χ) is a slow function of χ, the excluded volume fraction of effective spheres ϕ∗ and therefore Deff are not particularly sensitive to changes in χ. Thus, even for tracer sizes comparable to, or greater than, ER thickness (∼100 nm), the ratio Deff/D0 is virtually the same as for small molecules. This may explain why the size effect had not been detected in some experiments (15).
In contrast, diffusion through a network of filaments is sensitive to tracer sizes if they are comparable to, or greater than, the diameter of the filaments. The latter range between 2.5 and 10 nm. Let V be the total volume of individual filaments in a unit volume and R the tracer radius. Then the fraction of volume inaccessible to the tracer is Veff ≈ V(1 + R/r)2 (r is the radius of the filament). With overlapping,
| (9) |
where ϕ is the volume fraction of overlapping filaments. Once ϕeff is computed, a simple and accurate way to estimate the effect of the tracer size on diffusion is to use a multiplication rule (47),
where and are, respectively, the effective diffusion coefficients for the structure that does not include the cytoskeleton and the one that includes filaments only. Approximating by Eq. 7 with the parameters for long cylinders yields
| (10) |
where ϕc,cyl = 0.942, μcyl = 1.58, and ϕeff is determined by Eq. 9.
Equation 10 can be compared directly to the experimental findings reported in Luby-Phelps et al. (12). In the experiments, fluorescently labeled inert particles of controlled sizes were injected into live cells. The effective diffusion coefficients were measured by fluorescence recovery after photobleaching and normalized to those in water. Satisfactory agreement between the experimental data and predictions from Eq. 10, shown in Fig. 9, was achieved with ϕ = 0.024, a reasonable estimate of the volume fraction of actin (34).
Figure 9.

Normalized Deff as a function of tracer radius R. Experimental data (12) (dots with error bars) are compared with predictions from Eq. 10 with ϕ = 0.024 (solid line). The experimental values of Deff are from Table 1 of Luby-Phelps et al. (12) after averaging over all particles in a sample.
We conclude with estimating Deff for a tracer of a nanometer size, R = r =2.5 nm, in the cytoplasm. Because the particle is relatively large, the size effect needs to be included. Therefore, in addition to the intracellular structures, as above, we take now into account cytoskeletal filaments with ϕ = 0.04. From Eq. 9, ϕeff = 0.15 and Eq. 10 yields , where (see previous section). Overall, Deff ≈ 0.19D0; this indicates that the effective diffusion of a relatively large tracer can be five times slower than it would be in the extract free of intracellular structures.
Discussion
Diffusion of molecules in cytoplasm is a complicated phenomenon involving many factors. In the course of diffusive transport, macromolecules can bind to and unbind from other molecules; they experience and exert hydrodynamic forces and move in a heterogeneous environment where space is occluded by internal membranes, cytoskeletal meshwork, and by other solutes. To be able to analyze such a complicated system, it is necessary to make simplifying assumptions that allow considering these factors independently. This article presents a systematic numerical study of the excluded volume effect due to intracellular structures, such as internal membranes and cytoskeleton. It shows that this effect is a major factor that accounts for most of the reduction in diffusive transport of the inert tracer, compared to in vitro diffusion.
A key step is to develop an adequate approximation of the intricate geometry of intracellular structures. In this study, the geometry is mimicked by random overlapping obstacles of appropriate shapes, an approximation known as a Swiss-cheese model. This approach permits modeling deformable and branching structures by means of rigid objects of simple shapes. In particular, cytoskeletal filaments are modeled as long thin cylinders whereas ER cysternae are represented by thin disks. For biologically relevant volume fractions ϕ, Monte Carlo simulations indicate onset of normal diffusion on a micron scale. The Monte Carlo method is impractical, however, for extensive studies of diffusion in a variety of conditions because of its prohibitive computational cost. Instead, we have implemented a more efficient method of computing Deff based on the idea of homogenization (32,25), which enabled exhaustive studies of diffusion in space crowded by obstacles of different shapes and number densities.
Numerical experiments have uncovered unexpected similarities. First, Deff (ϕ) is accurately described by a unique two-parameter function (Eqs. 6 and 7) that applies to the entire range of volume fractions and to all shapes and their mixtures. This universality simplifies computations: all that is needed for determining Deff for all ϕ is to estimate two parameters for a given shape. Second, a scaling transformation has been identified under which dependencies for oblate objects collapse onto that for spheres. This simplifies estimation of Deff for mixtures of obstacle shapes.
Shapes, characteristic of intracellular environment, have been shown to bring about a four-to-fivefold reduction in diffusive transport, compared to diffusion in cytosol free of intracellular structures. In the extract with a total macromolecular content of ∼100 mg/mL, the diffusion coefficient of a solute is D0 ≈ 0.8 Din vitro (2,7,9). Then the overall reduction is Deff = 0.19–0.24 D0 = 0.16–0.2 Din vitro. These estimates agree with experimentally measured ranges for inert particles and globular proteins (6,15,48). For a 20–30 kDa protein of radius R = 1.5 nm, Din vitro, estimated by the Stokes-Einstein equation, is Din vitro = kBT/6πηwaterR, where kB is the Boltzmann constant, T is the absolute temperature, and ηwater is the viscosity of water. With T = 300 K and ηwater = 0.01 g/(cm·s), Din vitro ≈ 150 μm2/s. Then a typical value of the in vivo diffusion coefficient for this protein would be ≈ 30 μm2/s, an estimate comparable to the experimental data for globular proteins with no significant binding interactions in cytoplasm (48).
The analysis also shows that cytoskeletal filaments are unlikely to constitute diffusion barriers sufficient for formation of a microdomain of small molecules: to reduce diffusivity of a small molecule 10-fold, the filaments would need to fill ∼90% of space, a very tight packing! In contrast, ER sheets appear to be much more efficient in slowing down diffusion. This may explain why diffusion of vesicle-sized beads remain slow even after all major cytoskeletal filaments are disassembled (6).
Perhaps most importantly, this study lays the foundation for an accurate coarse-grain formulation that would account for the mesoscale heterogeneity of cytoplasm and the binding of tracers to intracellular structures.
Supporting Material
Supplemental text, three figures and two tables are available at http://www.biophysj.org/biophysj/supplemental/S0006-3495(09)01045-5.
Supporting Material
Acknowledgments
We thank Leslie Loew for his continuing support. Discussions with Greg Huber, Lev Truskinovsky, Mark Terasaki, Ann Cowan, Harel Weinstein, Vladimir Rodionov, and Robert Phair helped us better appreciate various aspects of the problem. Diana Resasco and Fei Gao implemented a Poisson solver in VCell. Fei Gao also developed a code for automatically generating and setting up geometry. Frank Morgan created VCell utilities for computing and integrating spatial gradients. Felix Bronner read the manuscript and provided valuable comments.
The work has been supported by National Institutes of Health grants No. 1U54-RR022232 and No. P41-RR13186.
Contributor Information
Igor L. Novak, Email: novak@uchc.edu.
Boris M. Slepchenko, Email: boris@neuron.uchc.edu, boris@photon.uchc.edu.
References
- 1.Dix J.A., Verkman A.S. Crowding effects on diffusion in solutions and cells. Annu. Rev. Biophys. 2008;37:247–263. doi: 10.1146/annurev.biophys.37.032807.125824. [DOI] [PubMed] [Google Scholar]
- 2.Sun J., Weinstein H. Toward realistic modeling of dynamic processes in cell signaling: quantification of macromolecular crowding effects. J. Chem. Phys. 2007;127:155105. doi: 10.1063/1.2789434. [DOI] [PubMed] [Google Scholar]
- 3.Lippincott-Schwartz J., Snapp E., Kenworthy A. Studying protein dynamics in living cells. Nat. Rev. Mol. Cell Biol. 2001;2:444–456. doi: 10.1038/35073068. [DOI] [PubMed] [Google Scholar]
- 4.Lippincott-Schwartz J., Patterson G.H. Development and use of fluorescent protein markers in living cells. Science. 2003;300:87–91. doi: 10.1126/science.1082520. [DOI] [PubMed] [Google Scholar]
- 5.Giepmans B.N.G., Adams S.R., Ellisman M.H., Tsien R.Y. The fluorescent toolbox for assessing protein location and function. Science. 2006;312:217–224. doi: 10.1126/science.1124618. [DOI] [PubMed] [Google Scholar]
- 6.Luby-Phelps K. Cytoarchitecture and physical properties of cytoplasm: volume, viscosity, diffusion, intracellular surface area. Int. Rev. Cytol. 2000;192:189–221. doi: 10.1016/s0074-7696(08)60527-6. [DOI] [PubMed] [Google Scholar]
- 7.Hanna S., Hess W., Klein R. Self-diffusion of spherical Brownian particles with hard-core interactions. Physica A. 1982;111:181–199. [Google Scholar]
- 8.Tokuyama M., Oppenheim I. Dynamics of hard-sphere suspensions. Phys. Rev. E Stat. Phys. Plasmas Fluids Relat. Interdiscip. Topics. 1994;50:R16–R19. doi: 10.1103/physreve.50.r16. [DOI] [PubMed] [Google Scholar]
- 9.Tokuyama M., Oppenheim I. On the theory of concentrated hard-sphere suspensions. Physica A. 1995;216:85–119. [Google Scholar]
- 10.Alberts B., Johnson A., Lewis J., Raff M., Roberts K. 4th Ed. Garland Science, Taylor & Francis; New York: 2002. Molecular Biology of the Cell. [Google Scholar]
- 11.van der Gucht J., Besseling N.A., Knoben W., Bouteiller L., Cohen Stuart M.A. Brownian particles in supramolecular polymer solutions. Phys. Rev. E. 2003;67 doi: 10.1103/PhysRevE.67.051106. 051106-1–9. [DOI] [PubMed] [Google Scholar]
- 12.Luby-Phelps K., Castle P.E., Taylor D.L., Lanni F. Hindered diffusion of inert tracer particles in the cytoplasm of mouse 3T3 cells. Proc. Natl. Acad. Sci. USA. 1987;84:4910–4913. doi: 10.1073/pnas.84.14.4910. [DOI] [PMC free article] [PubMed] [Google Scholar]
- 13.Hou L., Lanni F., Luby-Phelps K. Tracer diffusion in F-actin and Ficoll mixtures. Toward a model for cytoplasm. Biophys. J. 1990;58:31–43. doi: 10.1016/S0006-3495(90)82351-1. [DOI] [PMC free article] [PubMed] [Google Scholar]
- 14.Popov S., Poo M.M. Diffusional transport of macromolecules in developing nerve processes. J. Neurosci. 1992;12:77–85. doi: 10.1523/JNEUROSCI.12-01-00077.1992. [DOI] [PMC free article] [PubMed] [Google Scholar]
- 15.Seksek O., Biwersi J., Verkman A.S. Translational diffusion of macromolecule-sized solutes in cytoplasm and nucleus. J. Cell Biol. 1997;138:131–142. doi: 10.1083/jcb.138.1.131. [DOI] [PMC free article] [PubMed] [Google Scholar]
- 16.Rich T.C., Fagan K.A., Tse T.E., Schaack J., Cooper D.M.F. A uniform extracellular stimulus triggers distinct cAMP signals in different compartments of a simple cell. Proc. Natl. Acad. Sci. USA. 2001;98:13049–13054. doi: 10.1073/pnas.221381398. [DOI] [PMC free article] [PubMed] [Google Scholar]
- 17.Bouchaud J.-P., Georges A. Anomalous diffusion in disordered media: statistical mechanisms, models and physical applications. Phys. Rep. 1990;195:127–293. [Google Scholar]
- 18.Saxton M. Anomalous diffusion due to obstacles: a Monte Carlo study. Biophys. J. 1994;66:394–401. doi: 10.1016/s0006-3495(94)80789-1. [DOI] [PMC free article] [PubMed] [Google Scholar]
- 19.Marsh B.J., Mastronarde D.N., Buttle K.F., Howell K.E., McIntosh J.R. Organellar relationships in the Golgi region of the pancreatic β-cell line, HIT-T15, visualized by high resolution electron tomography. Proc. Natl. Acad. Sci. USA. 2001;98:2399–2406. doi: 10.1073/pnas.051631998. [DOI] [PMC free article] [PubMed] [Google Scholar]
- 20.Terasaki M., Jaffe L. Organization of the sea urchin egg endoplasmic reticulum and its reorganization at fertilization. J. Cell Biol. 1991;114:929–940. doi: 10.1083/jcb.114.5.929. [DOI] [PMC free article] [PubMed] [Google Scholar]
- 21.Svitkina T.M., Verkhovsky A.B., McQuade K.M., Borisy G.G. Analysis of the actin-myosin II system in fish epidermal keratocytes: mechanism of cell body translocation. J. Cell Biol. 1997;139:397–415. doi: 10.1083/jcb.139.2.397. [DOI] [PMC free article] [PubMed] [Google Scholar]
- 22.Stauffer D., Aharony A. Taylor & Francis; London: 1992. Introduction to Percolation Theory. [Google Scholar]
- 23.Wong I.Y., Gardel M.L., Reichman D.R., Weeks E.R., Valentine M.T. Anomalous diffusion probes microstructure dynamics of entangled F-actin networks. Phys. Rev. Lett. 2004;92:178101. doi: 10.1103/PhysRevLett.92.178101. [DOI] [PubMed] [Google Scholar]
- 24.Tolic-Nørrelykke I.M., Munteanu E.-L., Thon G., Oddershede L., Berg-Sörensen K. Anomalous diffusion in living yeast cells. Phys. Rev. Lett. 2004;93:078102. doi: 10.1103/PhysRevLett.93.078102. [DOI] [PubMed] [Google Scholar]
- 25.Milton G.W. Cambridge University Press; Cambridge, UK: 2001. The Theory of Composites. Cambridge Monographs on Applied and Computational Mathematics. [Google Scholar]
- 26.Lauffer M.A. Theory of diffusion in gels. Biophys. J. 1961;1:205–213. doi: 10.1016/s0006-3495(61)86884-7. [DOI] [PMC free article] [PubMed] [Google Scholar]
- 27.Fricke H. A mathematical treatment of the electric conductivity and capacity of disperse systems. Phys. Rev. 1924;24:575–587. [Google Scholar]
- 28.Douglas J.F., Garboczi E.J. Intrinsic viscosity and the polarizability of particles having a wide range of shapes. Adv. Chem. Phys. 1995;91:85–153. [Google Scholar]
- 29.Bruggeman D.A.G. Berechnung verschiedener physikalischer Konstanten von heterogen Substanzen. I. Dielectrizitatskonstanten und Leitfahigkeiten der Mischkorper aus isotropen Substanzen. (German) Annalen der Physik. 1935;24:636–664. [Calculation of various physical constants in heterogeneous substances. I. Dielectric constants and conductivity of composites from isotropic substances] [Google Scholar]
- 30.Archie G.E. The electric resistivity log as an aid in determining some reservoir characteristics. Trans. AIME. 1942;146:54–62. [Google Scholar]
- 31.Isichenko M.B. Percolation. statistical topography, and transport in random media. Rev. Mod. Phys. 1992;64:961–1043. [Google Scholar]
- 32.Hashin Z. Analysis of composite materials—a survey. J. Appl. Mech. 1983;50:481–505. [Google Scholar]
- 33.Halperin B.I., Feng S., Sen P.N. Differences between lattice and continuum percolation transport exponents. Phys. Rev. Lett. 1985;54:2391–2394. doi: 10.1103/PhysRevLett.54.2391. [DOI] [PubMed] [Google Scholar]
- 34.Abraham V.C., Krishnamurthi V., Taylor D.L., Lanni F. The actin-based nanomachine at the leading edge of migrating cells. Biophys. J. 1999;77:1721–1732. doi: 10.1016/S0006-3495(99)77018-9. [DOI] [PMC free article] [PubMed] [Google Scholar]
- 35.Allaire G. Homogenization and two-scale convergence. SIAM J. Math. Anal. 1992;23:1482–1518. [Google Scholar]
- 36.Bensoussan A., Lions J.-L., Papanicolaou G. North-Holland Publishing; Amsterdam, The Netherlands: 1978. Asymptotic Analysis for Periodic Structures. [Google Scholar]
- 37.Schaff J.C., Slepchenko B.M., Choi Y., Wagner J.M., Resasco D. Analysis of nonlinear dynamics on arbitrary geometries with the Virtual Cell. Chaos. 2001;11:115–131. doi: 10.1063/1.1350404. [DOI] [PubMed] [Google Scholar]
- 38.Novak I.L., Gao F., Choi Y.-S., Resasco D., Schaff J.C. Diffusion on a curved surface coupled to diffusion in the volume: application to cell biology. J. Comput. Phys. 2007;226:1271–1290. doi: 10.1016/j.jcp.2007.05.025. [DOI] [PMC free article] [PubMed] [Google Scholar]
- 39.McLachlan D.S. An equation for the conductivity of binary mixtures with anisotropic grain structures. J. Phys. C: Solid State Phys. 1987;20:865–877. [Google Scholar]
- 40.Rintoul M.D. Precise determination of the void percolation threshold for two distributions of overlapping spheres. Phys. Rev. E Stat. Phys. Plasmas Fluids Relat. Interdiscip. Topics. 2000;62:68–72. doi: 10.1103/physreve.62.68. [DOI] [PubMed] [Google Scholar]
- 41.Yi Y.B. Void percolation and conduction of overlapping ellipsoids. Phys. Rev. E. 2006;74 doi: 10.1103/PhysRevE.74.031112. 031112-1–6. [DOI] [PubMed] [Google Scholar]
- 42.Elam W.T., Kerstein A.R., Rehr J.J. Critical properties of the void percolation problem for spheres. Phys. Rev. Lett. 1984;52:1516–1519. [Google Scholar]
- 43.Quintanilla J., Torquato S., Ziff R.M. Efficient measurement of the percolation threshold for fully penetrable disks. J. Phys. Math. Gen. 2000;33:L399–L407. [Google Scholar]
- 44.Feng S., Sen P.N. Percolation on elastic networks. Phys. Rev. Lett. 1984;52:216–219. [Google Scholar]
- 45.Benguigui L. Experimental study of the elastic properties of a percolating system. Phys. Rev. Lett. 1984;53:2028–2030. [Google Scholar]
- 46.Han K.H., Lee J.O., Lee S.-I. Confirmation of the universal conductivity critical exponent in a two-dimensional anisotropic system. Phys. Rev. B. 1991;44:6791–6793. doi: 10.1103/physrevb.44.6791. [DOI] [PubMed] [Google Scholar]
- 47.Brinkman H. The viscosity of concentrated suspensions and solutions. J. Chem. Phys. 1952;20:571–581. [Google Scholar]
- 48.Arrio-Dupont M., Foucault G., Vacher M., Devaux P.F., Cribier S. Translational diffusion of globular proteins in the cytoplasm of cultured muscle cells. Biophys. J. 2000;78:901–907. doi: 10.1016/S0006-3495(00)76647-1. [DOI] [PMC free article] [PubMed] [Google Scholar]
Associated Data
This section collects any data citations, data availability statements, or supplementary materials included in this article.