

Abstract
The ability of myosin to generate motile forces is based on elastic distortion of a structural element of the actomyosin complex (cross-bridge) that allows strain to develop before filament sliding. Addressing the question, which part of the actomyosin complex experiences main elastic distortion, we suggested previously that the converter domain might be the most compliant region of the myosin head domain. Here we test this proposal by studying functional effects of naturally occurring missense mutations in the β-myosin heavy chain, 723Arg → Gly (R723G) and 736Ile → Thr (I736T), in comparison to 719Arg → Trp (R719W). All three mutations are associated with hypertrophic cardiomyopathy and are located in the converter region of the myosin head domain. We determined several mechanical parameters of single skinned slow fibers isolated from Musculus soleus biopsies of hypertrophic cardiomyopathy patients and healthy controls. Major findings of this study for mutation R723G were i), a >40% increase in fiber stiffness in rigor with a 2.9-fold increase in stiffness per myosin head (S∗rigor R723G = 0.84 pN/nm S∗rigor WT = 0.29 pN/nm); and ii), a significant increase in force per head (F∗10°C, 1.99 pN vs. 1.49 pN = 1.3-fold increase; F∗20°C, 2.56 pN vs. 1.92 pN = 1.3-fold increase) as well as stiffness per head during isometric steady-state contraction (S∗active10°C, 0.52 pN/nm vs. 0.28 pN/nm = 1.9-fold increase). Similar changes were found for mutation R719W (2.6-fold increase in S∗rigor; 1.8-fold increase in F∗10°C, 1.6-fold in F∗20°C; twofold increase in S∗active10°C). Changes in active cross-bridge cycling kinetics could not account for the increase in force and active stiffness. For the above estimates the previously determined fraction of mutated myosin in the biopsies was taken into account. Data for wild-type myosin of slow soleus muscle fibers support previous findings that for the slow myosin isoform S∗ and F∗ are significantly lower than for fast myosin e.g., of rabbit psoas muscle. The data indicate that two mutations, R723G and R719W, are associated with an increase in resistance to elastic distortion of the individual mutated myosin heads whereas mutation I736T has essentially no effect. The data strongly support the notion that major elastic distortion occurs within the converter itself. Apparently, the compliance depends on specific residues, e.g., R719 and R723, presumably located at strategic positions near the long α-helix of the light chain binding domain. Because amino acids 719 and 723 are nonconserved residues, cross-bridge stiffness may well be specifically tuned for different myosins.
Introduction
Force generation and shortening of skeletal muscle depends on structural changes of the myosin head domain that are coupled to ATP-hydrolysis. The ability of myosin to drive sliding of the actin filaments during isotonic shortening as well as its ability to generate isometric force is thought to depend on elastic distortion of a structural element of the actomyosin complex (cross-bridge). Such elastic distortion that was proposed in very early models of muscle contraction, allows strain to develop within the motor before the cargo is actually moved (1,2). Relief of this strain then drives filament sliding. It is, however, still unclear which part of the actomyosin complex represents the element that experiences the main elastic distortion whereas other parts may act more like rigid bodies. One possibility is that the light chain binding domain of the myosin head, i.e., the long α-helix with the two associated light chains undergoes bending (3–5). Alternatively, the acto-myosin interface (6), subfragment 2 (7) or the junction between catalytic domain and light chain binding domain (4) have been considered as regions of main elastic distortion during force generation. Fiber diffraction studies do not have the resolution to answer this question. Cryo-electron microscopy and protein crystallography can also not resolve this question because this requires study of elastically distorted cross-bridges in the process of generating isometric force in muscle.
Studying functional effects of missense mutations in the head domain of the cardiac myosin isoform (β-MHC) that occur naturally in hypertrophic cardiomyopathy (HCM) enabled us to address this question. Familial HCM is a genetically determined cardiac disorder that in 50–60% of families is associated with and most likely caused by mutations in genes encoding sarcomeric proteins (8,9). We found previously that a mutation that is located in the converter region of the myosin head domain (R719W) was associated with a significant increase in resistance to elastic distortion (stiffness) of muscle fibers from an HCM-patient carrying this mutation (10). We could show that the increase in fiber stiffness was due to higher stiffness of the mutated myosin heads suggesting that the converter region became stiffer. This indicates that the converter region is one of the main elastically distorted elements of the myosin head because only stiffening of a compliant region will cause an increase in resistance to elastic distortion of the whole cross-bridge.
We now extended our functional studies toward other mutations also located in the converter domain, mutation R723G and I736T, to test our hypothesis that the converter is a key element of elastic distortion within the myosin head domain. Furthermore, characterization of different mutations in the converter region will also provide insight into structural elements and interactions of amino acids within the converter that are essential for the compliance of this region of the myosin head. Finally, studies on HCM mutations in muscle fibers from HCM patients allow us to not only address the question of cross-bridge compliance but also to identify primary functional changes that may trigger the development of the cardiac disease in these patients.
Single fibers from soleus muscle of HCM patients and control individuals containing the slow myosin isoform (β/slow-MHC) were used for these studies. The use of slow skeletal muscle fibers (type I fibers) for studies of HCM-mutations is possible because in humans β-MHC in slow-twitch muscle is the product of the same gene on chromosome 14 that is expressed in the ventricle (11). This was confirmed by studies of several different point mutations in β-MHC that revealed the presence of the mutated β-MHC in the sarcomeres of the patient's slow-twitch skeletal muscle (12–14). Incorporation of myosin carrying an HCM mutation in the head domain was shown previously not to cause alterations in the structure and assembly of the thick filaments in the contractile apparatus (10,15).
To examine whether the R723G and I736T mutations also affect the resistance of the myosin head against elastic distortion, i.e., the stiffness of the myosin head domain, as we had found previously for the R719W mutation, we first determined the stiffness of skinned fibers with the R723G and I736T mutations in the absence of nucleotide (rigor). Because in rigor all cross-bridges are thought to be attached to actin because of their very high actin affinity (16–18), possible changes in fiber stiffness (S) could not be caused by different fractions of cross-bridges attached to actin, i.e., fiber stiffness in rigor should quite directly reflect changes in stiffness of the individual cross-bridge (S∗).
If fiber stiffness in rigor is changed by a mutation we expect a corresponding change in fiber stiffness measured during isometric steady-state contraction, unless cross-bridge cycling kinetics are also modified by the mutation. This is because in a model in which cross-bridges essentially fall into two groups of states, weak binding, nonforce generating states and strong binding, force generating states, stiffness of the myosin heads attached to actin in the half-sarcomere (S) under isometric conditions depends on (19)
| (1) |
Here n is the total number of turning-over myosin heads that can bind to actin within a half-sarcomere (depending e.g., on sarcomere length, i.e., filament overlap) and that presumably equals the number of myosin heads that can attach under rigor conditions. S∗ is the stiffness of an individual myosin head or cross-bridge. fapp and gapp are parameters of cross-bridge cycling kinetics: fapp is the apparent rate constant for the transition of cross-bridges from the nonforce-generating weak binding into the force generating strong binding states of the ATPase cycle, the transition that is associated with Pi-release. gapp is the apparent rate constant of the return to the nonforce generating states on ADP release and binding of a new ATP-molecule. Return to weak binding states via binding of inorganic phosphate to force generating cross-bridges is not considered here as no inorganic phosphate is added to the solutions. For effects of myofilament compliance on observed fiber stiffness see Discussion. Changes in fiber stiffness under isometric conditions, however, could also result from changes in quick tension recovery (2) or in actin binding kinetics of force-generating cross-bridges (20). Thus, we measured fiber stiffness by imposing stretches/releases of different speeds on the fibers.
If stiffness of an individual cross-bridge is changed by a mutation, we also expect a corresponding change in active force generation (F), unless i), the extent of elastic distortion of a cross-bridge during force generation; and/or ii), again cross-bridge turnover kinetics are also changed by the mutations. This is because isometric force (F) is determined by (19)
| (2a) |
where
| (2b) |
In these equations, n, fapp, and gapp are defined as in Eq. 1. F∗ is the mean force generated by each individual myosin head in the force generating states and y0∗ is the mean elastic distortion of an individual myosin head during isometric force generation. To probe for possible changes in y0∗ associated with a mutation, we measured the y0-value of control fibers and fibers with mutant myosin by imposing very fast ramp shaped releases onto isometrically contracting muscle fibers (T-plots (20,21)). In these measurements y0 is the minimum distance of filament sliding, i.e., the minimum release required to drop isometric force to zero (22,23). y0 measures the extent of structural change within the cross-bridge, e.g., redocking of the motor domain on actin and/or rotation of the lever arm, which not only results in elastic distortion of the force generating cross-bridge, y0∗, but also in elastic extension of the myofilaments. Therefore, when quantifying effects of mutations on cross-bridge stiffness (S∗) and on y0∗, we need to consider contributions of myofilament compliance to observed fiber stiffness S and observed y0 of the fibers (see Discussion).
To examine whether cross-bridge cycling kinetics are affected by the mutations we measured the rate constant of force redevelopment after a short period of unloaded isotonic shortening (kredev), the isometric fiber ATPase activity, and the maximum shortening velocity (vmax). Isometric fiber ATPase activity and kredev allow us to characterize effects of the mutations on cross-bridge turnover kinetics under isometric conditions. The rate constant of force redevelopment back to the isometric steady state in response to a period of unloaded shortening (kredev (19)) is determined by
| (3) |
Again return of force generating cross-bridges to weak binding states via binding of inorganic phosphate is not considered. The ATP-turnover of a muscle fiber depends on
| (4) |
where n, fapp, and gapp are defined as in Eq. 1, and b is the number of half-sarcomeres within a given fiber. vmax is determined by cross-bridge cycling kinetics during unloaded shortening of the sarcomeres. vmax is particularly sensitive to changes in g2app, the rate constant for return of cross-bridges to weak binding states, i.e., detachment, under unloaded isotonic shortening conditions (1). g2app during sarcomere shortening at negligible loads is coupled to fast ADP-release (24), followed by ATP-induced dissociation of the myosin head from actin (25,26).
Altogether, measurements of fiber stiffness in rigor and during isometric contraction, as well as measurements of isometric force and cross-bridge cycling kinetics along with y0 during isometric contraction allow us to detect changes in S∗ and F∗ and to distinguish effects of mutations on cycling kinetics. To quantify effects of a mutation on F∗ and S∗ from these measurements, the abundance of the mutated myosin in the muscle tissue from the patients has to be taken into account that was found to be different for different point mutations in the myosin head domain (13,14). A central element to perform all these different measurements was to provide a sufficiently large number of fibers in a standardized state of preservation over a long period of time. This was achieved by the specific freezing and storage procedure that we had developed previously (27) and that was applied to the biopsies immediately after excision of the tissue from the patients or the control individuals.
We found that mutation R723G, which is located very close to residue R719W in the core of the converter (28,29), was associated with a >40% increase in fiber stiffness in rigor, as well as a significant increase in force and stiffness during isometric steady-state contraction. These are qualitatively the same changes as found with mutation R719W. In contrast, mutation I736T, which according to different crystal structures of the myosin head domain (28,29) is further away from the long α-helix and near the surface of the converter domain did not significantly affect any of the measured parameters, just a small but not significant increase in rigor stiffness could be observed. Altogether the data support our earlier proposal that elastic distortion occurs within or near the converter domain itself, presumably close to the start of the long α-helix of the light chain binding domain. Sequence comparison shows that residues equivalent to R719 and R723 are not conserved among different class II myosins. Thus, our findings that mutations R719 and R723 can quite significantly change cross-bridge stiffness imply that stiffness of the myosin head domain may well be quite specifically adjusted for different functions. An account of this work was published previously (30).
Methods
Patients and biopsies
Muscle tissue of the Musculus soleus was obtained from five HCM patients with three different β-MHC point mutations. All patients presented with typical signs of HCM, including myocardial hypertrophy and abnormalities in the electrocardiogram. The affected families showed an autosomal dominant inheritance of the disease. Biopsies with mutation R719W were obtained from the patient AI III-2 of the British family AI, published by Anan et al. (31), including clinical data. Soleus biopsies were also taken from two members, II-2 and II-5, of the HCM family 26 from Barcelona who carry the β-MHC mutation R723G (called H27 and H28 thereafter) published with clinical data by Enjuto et al. (32). Further, biopsies with the I736T β-MHC mutation were obtained from the two HCM patients II-4 and II-7 of the Caucasian family A from Kyrgyzstan (numbered H19 and H20) published by Perrot et al. (33).
Biopsies of the M. soleus of 10 different healthy individuals served as controls. The control individuals were patients undergoing plastic surgery and volunteers without any known impairment of cardiac or skeletal muscle function. Controls also included two Kyrgyz individuals (caucasian origin). Informed consent was obtained according to approved Ethics Committee protocols of all involved centers. The investigation conforms with the principles outlined in the Declaration of Helsinki. Excision of the biopsies, preparation of small fiber bundles, permeabilization and long term storage of fiber bundles was described in detail previously (10,27,34,35). Briefly, M. soleus biopsies of ∼10 mm × 10 mm × 15 mm were excised under local anesthesia and immediately carefully dissected into small muscle fiber bundles. After permeabilization in skinning solution with 0.5% Triton X-100 (Roche Diagnostics, Mannheim, Germany), the fiber bundles were equilibrated with skinning solutions containing increasing sucrose concentrations (up to 2.0 M), rapidly frozen in liquid propane and stored in liquid nitrogen, as described previously (27). Special care was taken to keep the muscle tissue, the dissected bundles before and after freezing, and the isolated fibers during all procedures at low temperature (2–5°C). Skinning solution contained six different protease inhibitors, 2 mM dithiothreitol, 10 mM glutathione, and 5 mM 2,3-butanedione monoxime (details described in Köhler et al. (10) and Kraft et al. (34)). Biopsies from patients and from control individuals were treated in the same way during each step of the procedures. For the experiments, small bundles of soleus muscle fibers were thawed in skinning solution containing 2.0 M sucrose and equilibrated with skinning solution of decreasing sucrose concentrations (27). Individual muscle fibers were finally dissected from the bundles in skinning solution without sucrose and used within the following 4 days. Data were obtained by alternating frequently between experiments on mutated fibers and control fibers.
Solutions
All chemicals, except where noted, were obtained from Sigma-Aldrich (Munich, Germany). Solutions were adjusted to pH 7.0 at the respective experimental temperature. Experimental temperature is denoted where data are shown. Skinning solutions with and without sucrose were prepared as described earlier (34). Fiber stiffness during isometric steady-state contraction of fibers with mutation R719W and control fibers was determined earlier in a separate set of experiments (see Table 2; (10)) with preactivating and activating solutions containing 10 mM imidazole, 2 mM MgCl2, 2 mM MgATP, 2 mM dithiothreitol, 10 mM caffeine, 10 mM sodium creatine phosphate, 200 U/mL creatine phosphokinase (units defined according to Sigma-Aldrich), and 3 mM EGTA or 3 mM Ca-EGTA, respectively. To determine isometric fiber ATPase activity, isometric force and kredev, as well as unloaded shortening velocity (vmax; Table 1) of all mutations and of a corresponding group of control fibers, the following preactivating and activating solutions were used: 10 mM imidazole, 2 mMa MgCl2, 3 mM EGTA or 3 mM CaEGTA, respectively, 5 mM MgATP, 10 mM caffeine, 0.25 mM Ap5A, 5 mM NaN3, 50 U/mL lactate dehydrogenase, 250 U/mL pyruvate kinase, 2 mM phosphoenolpyruvate, and ∼0.2 mM NADH. Phosphoenolpyruvate and pyruvate kinase served not only as ATP-backup system but also to determine fiber ATPase activity. Rephosphorylation of ADP was coupled to the reduction of pyruvate to lactate by oxidation of NADH to NAD+. The resulting change in absorbance was measured at 360 nm in a flow-through cuvette that was part of a temperature controlled system in which solutions were circulated between a small trough for the muscle fiber and the 5 μL flow-through cuvette. Total circulating volume was 160 μL. These solutions were also used to measure fiber stiffness during isometric steady-state contraction of control fibers and fibers with mutations R723G and I736T, respectively (Table 1). Activating solutions with different calcium-concentrations (from pCa 4.5 to pCa 6.6) for measurements of isometric force and fiber stiffness in T-plots at different force levels to determine y0 and filament compliance per half-sarcomere of control fibers (cf. Fig. 5) were obtained by mixing relaxing solution (containing 3 mM EGTA) and activating solution (containing 3 mM CaEGTA) in different proportions. Ionic strength of all preactivating and activating solutions was adjusted to 170 mM using potassium propionate.
Table 2.
Fiber stiffness in rigor and during isometric contraction as well as y0-values of fibers with mutation R719W and controls
| Mut R719W norm. | Controls for R719W |
Units for abs. values | ||
|---|---|---|---|---|
| norm. | abs. values | |||
| Fiber stiffness in rigor† at 5°C | 1.45∗ ± 0.13 (6) | 1.00 ± 0.19 (7) | 12.9 ± 2.6 (7) | or kPa × HS/nm |
| Active fiber stiffness† at 10°C | 1.48∗ ± 0.15 (9) | 1.00± 0.11 (14) | 10.4 ± 1.1 (14) | or kPa × HS/nm |
| abs. values | ||||
| y0 (nm/HS)‡ at 10°C | 7.66 ± 0.99 (9) | 7.09 ± 0.57 (14) | ||
abs., absolute; HS, half-sarcomere; norm., normalized.
Values in parentheses indicate number of fibers studied, data are mean values ± SE. All values are normalized to control fibers that were measured in the same time period.
Significant changes compared to controls.
Data for mutation R719W and parallel controls were obtained in previous experiments with differently composed solutions (see also (10)), yielding values for the controls somewhat different than shown in Table 1. For the control fibers shown here Fmax = 72.6 ± 4.05 kPa (n = 19) at 10°C and 130.49 ± 6.72 kPa (n = 19) at 20°C, isometric force of fibers with mutation R719W was at 10°C 1.59 ± 0.07 times (n = 18) and at 20°C 1.49± 0.05 times (n = 18) the force of control fibers.
y0, active stiffness and rigor stiffness of fibers with mutation R719W and the respective control fibers were determined at a speed of length release of ∼2–3 × 10³ (nm/half-sarcomere)s−1.
Table 1.
Maximum isometric force generation (Fmax) and parameters sensitive to cross-bridge cycling kinetics as well as stiffness and y0-values of soleus muscle fibers with myosin mutations and control fibers measured in rigor and during isometric contraction
| Mut R719W norm. | Mut R723G norm. |
Mut I736T norm. |
Controls norm. | Controls abs. values |
Units for abs. values | |||||
|---|---|---|---|---|---|---|---|---|---|---|
| H27 | H28 | H19 | H20 | 20°C | 10°C | |||||
| Fmax | 1.43∗ ± 0.02 (14) | 1.19∗ ± 0.01 (7) | 1.22∗ ± 0.01 (14) | 0.97 ± 0.02 (7) | 1.01 ± 0.01 (20) | 1.00 ± 0.01 (45) | 140.86 ± 1.25 (45) | 108.94 ± 5.31 (36) | kN/m2 or kPa | |
| kredev | 1.00 ± 0.05 (14) | 1.11 ± 0.04 (7) | 1.09 ± 0.06 (14) | 0.91 ± 0.04 (7) | 0.97 ± 0.03 (20) | 1.00 ± 0.04 (45) | 2.69 ± 0.06 (45) | 0.27 ± 0.02 (36) | s−1 | |
| Fiber-ATPase | 1.21∗ ± 0.02 (14) | 0.97 ± 0.04 (6) | 0.98 ± 0.02 (12) | 0.97 ± 0.05 (6) | 1.03 ± 0.03 (11) | 1.00 ± 0.03 (21) | 0.95§ ± 0.02 (21) | n.d. | ||
| vmax | 1.10 ± 0.11 (6) | 1.07 ± 0.04 (8) | 1.17∗ ± 0.04 (9) | 0.95 ± 0.04 (11) | 1.00 ± 0.03 (10) | 1.00 ± 0.03 (7) | 3246.00 ± 86.79 (7) | 329.90 ± 8.61 (10) | (nm/HS)s−1 | |
| Fiber stiffness in rigor at 5°C† | see Table 2 | 1.43∗ ± 0.21 (5) | 1.59∗ ± 0.15 (6) | 1.09 ± 0.09 (7) | 1.15 ± 0.14 (10) | 1.00 ± 0.15 (6) | n.d. | 17.7 ± 2.7 (6) | or kPa × HS/nm | |
| Active fiber stiffness† | see Table 2 | 1.32∗ ± 0.10 (10) | 1.43∗ ± 0.19 (6) | 0.90 ± 0.04 (7) | 0.97 ± 0.08 (11) | 1.00 ± 0.13 (9) | n.d. | 13.2 ± 1.7 (9) | or kPa × HS/nm | |
| abs. values | abs. values | |||||||||
| y0 (nm/HS)‡ at 10°C | see Table 2 | 7.70 ± 0.74 (9) | n.d. | n.d. | 7.76 ± 0.44 (7) | n.d. | 8.53 ± 0.42 (6) | |||
abs., absolute; HS, half-sarcomere; n.d., not determined; norm., normalized.
Isometric force at 10°C of fibers with mutation R723G (H27) and I736T (H20) was 1.23 ± 0.05 (n = 9) times and 0.91 ± 0.08 (n = 11) times the force of control fibers, respectively. Values in parentheses indicate number of fibers studied, data are mean values ± SE. All values are normalized to control fibers that were measured in the same time period. All normalized values of Fmax, kredev, fiber-ATPase, and vmax shown here were measured at 20°C, rigor stiffness was measured at 5°C, active stiffness and y0 were determined at 10°C.
Significant changes compared to controls.
Fiber stiffness in rigor and isometric contraction measured at fastest speed of length change (∼3–5 × 10³ (nm/half-sarcomere)s−1 for rigor and 2–5 × 10³ (nm/half-sarcomere)s−1 for active stiffness).
y0 and active stiffness of the control fibers were measured on a different set of fibers with Fmax = 112.95 ± 0.11 kPa.
ATPase activity was calculated based on ADP generated, fiber volume and an S1-content of 154 pmol S1/μL fiber volume (50).
Figure 5.
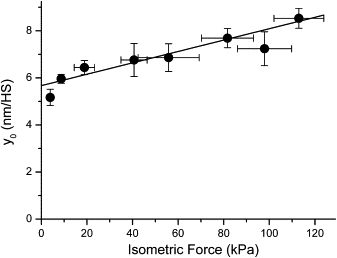
Relation of the extent of filament sliding necessary to drop isometric force to zero (y0) vs. Fmax at different levels of calcium-activation. The y0-value was derived from isometric force and active fiber stiffness that was measured in ramp-shaped releases imposed on slow fibers of M. soleus of control individuals during isometric steady-state contraction (T-plots; (20,21)), see also Fig. 4) at pCa values from pCa 4.5 to pCa 6.6 (10°C). Speed of length release was 4–5 × 10³ (nm/half-sarcomere)s−1 on average. Fmax = 112.95 ± 0.11 kPa, y0 at maximum activation was 8.53 ± 0.42 nm/HS (n = 3–6 fibers). Continuous line obtained by linear regression. Y axis intercept of fitted line at 5.67 nm/HS. This indicates filament compliance per half-sarcomere of 1/(112.95 kPa/(8.53 nm − 5.67 nm)) = 0.025 nm/kPa.
To quickly remove MgATP when transferring the fibers from relaxing conditions into rigor, fibers were put in “quick rinse” solution containing 10 mM imidazole, 2.5 mM EGTA, 7.5 mM EDTA, and 135 mM potassium propionate for ∼10 min. Subsequently, for measurements of fiber stiffness in rigor, fibers were transferred into rigor-solution containing 10 mM imidazole, 2.5 mM EGTA, 2.5 mM EDTA, and 150 mM potassium propionate.
Mechanical experiments
Single fibers were isolated and mounted into the experimental setup as described previously (34,36). Sarcomere length, which was monitored by laser light diffraction, was adjusted to 2.4 μm for all fibers. Structural integrity of the fibers was monitored with an inverted microscope at all stages of the experiments. For precise values of force and stiffness per cross-sectional area of mutant and control fibers, the diameter of the fibers was not only determined with an inverted microscope from the bottom, but also through another microscope from the side. Accordingly, pairs of corresponding diameters were determined for each fiber at three spots along the length of the fiber. From these values the average cross-sectional areas of the fibers were calculated assuming an elliptical cross section. Control experiments with a subset of fibers showed that cross-sectional areas obtained with this method are not significantly different from cross-sectional areas of the same fibers under the same conditions determined from optical z-sections recorded with a confocal microscope integrated into our mechanical set-up (data not shown). For recording z-sections by confocal microscopy, fibers were labeled with rhodamine-phalloidin in relaxing solution.
Measurements of isometric force (Fmax), kredev, and isometric fiber ATPase were carried out according to methods described in detail previously (cf. Figs. 6 A and 7 A; (34,37,38)). Unloaded shortening velocity (vmax) was determined using the slack test protocol (cf. Fig. 8A; (39,40)). Details of vmax measurements have been reported earlier (38). Fmax, kredev, and vmax were measured at 10°C and 20°C. The effects of the mutations on isometric force were essentially the same at 10°C and at 20°C, normalized data shown here (Table 1) were recorded at 20°C. Resistance to elastic distortion, i.e., fiber stiffness, was measured with ramp-shaped stretches or releases of different speeds applied to one end of the fibers (41). The length change was recorded as change in sarcomere length. Sarcomere length was recorded using laser light diffraction with the previously described averaging over different incident angles of the laser beam (ω-averaging; see Brenner (41)). Velocity of length change could be varied from 2 (nm/half-sarcomere)s−1 to 5 × 10³ (nm/half-sarcomere)s−1 to obtain stiffness-speed relations. Fiber stiffness in rigor was determined by applying ramp-shaped stretches to the fibers in rigor solution. Previous experiments showed that rigor stiffness is essentially the same at low (5°C) and high temperature (20°C; T. Kraft, unpublished observation). Thus, we measured fiber stiffness in rigor at 5°C. Active fiber stiffness was measured by imposing ramp-shaped releases on fibers during isometric steady-state contraction at 10°C (see also Fig. 4, T-plots; (21)). In both cases, chord stiffness was used as a measure of apparent fiber stiffness. Chord stiffness was defined as ΔF/2 nm where ΔF is the change in force when change in sarcomere length has reached 2 nm/half-sarcomere.
Figure 6.
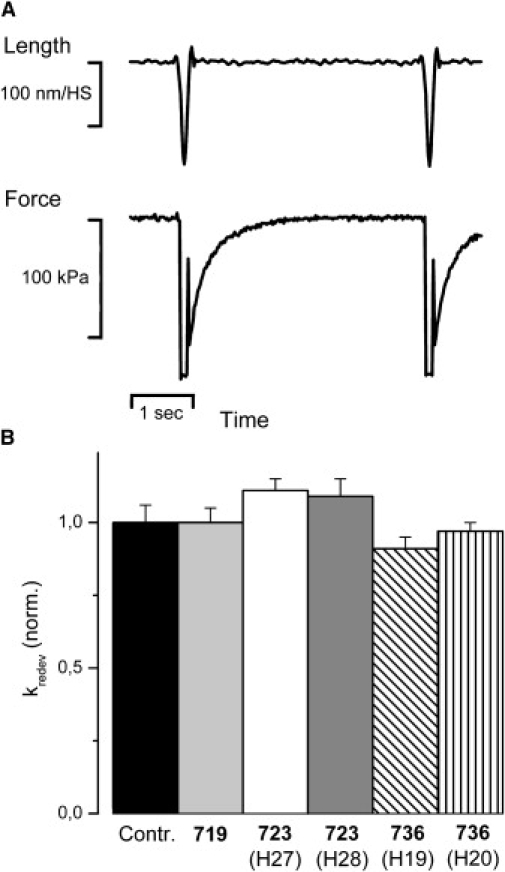
Rate constant of force redevelopment (kredev). (A) Sample data trace of isometric force and force redevelopment of a control fiber (20°C) recorded with a “release/restretch” protocol established previously (37,60). The isometrically contracting fiber is subjected to a short period (100 ms) of unloaded shortening followed by rapid restretch to isometric fiber length. kredev is determined from the time course of force redevelopment to the isometric steady state, assuming a single exponential function. Isometric force obtained as difference between force in isometric steady state and force level reached during the period of unloaded shortening. CSA of this fiber, 12,000 μm2, kredev = 2.94 s−1. (B) Effects of mutations R719W, R723G, and I736T on kredev. n = 7–45 fibers. Note that no significant effect of the different mutations on kredev both at 10°C and 20°C was found (data for 10°C not shown). Mean values (±SE) normalized to values of control fibers. For absolute values see Table 1.
Figure 7.
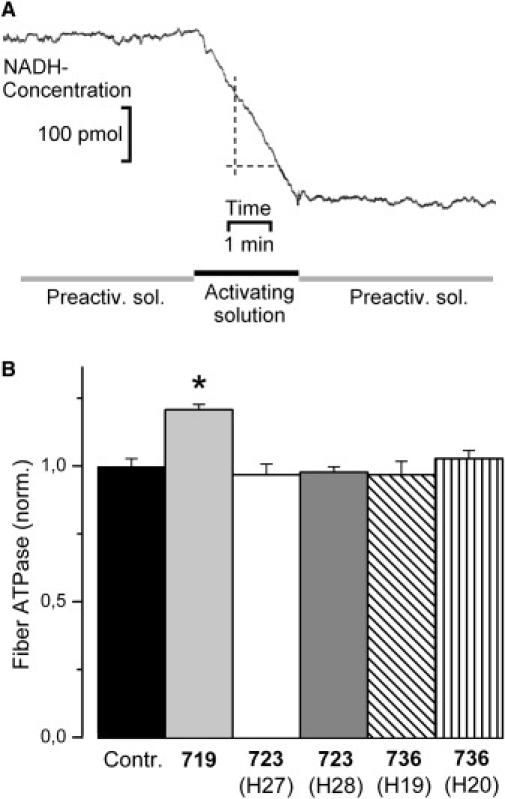
Fiber ATPase activity of controls and fibers with mutation. (A) Pen recorder trace representing fiber ATPase activity of a control fiber during maximum calcium activation (20°C). Trace shows concentration of NADH, obtained from absorbance at 360 nm and calibration with NADH test solutions. For composition of preactivating and activating solution see Methods. Decrease of NADH-absorbance is due to rephosphorylation of ADP, that was coupled to reduction of pyruvate to lactate by oxidation of NADH to NAD+. With calibration of the system the change in absorbance could be converted to pmoles of NADH and thus MgADP produced by the fiber per second. ATPase activity was calculated based on ADP generation, fiber volume, and an S1-content of 154 pmol S1/μL fiber volume (50). CSA, 8700 μm2; fiber length, 2 mm; ATP-turnover per myosin head in this fiber was 0.85 ATP/s, Fmax was 144 kPa. (B) Effects of mutations R719W, R723G, and I736T, on ATPase activity of fibers during isometric contraction (n = 6–21 fibers). T = 20°C to enhance signal/noise for ATPase measurements. Mean values (±SE) normalized to values of control fibers. For absolute values see Table 1. Asterisk indicates statistically significant difference to controls. Fiber ATPase activity is significantly affected only by mutation R719W (p < 0.001).
Figure 8.
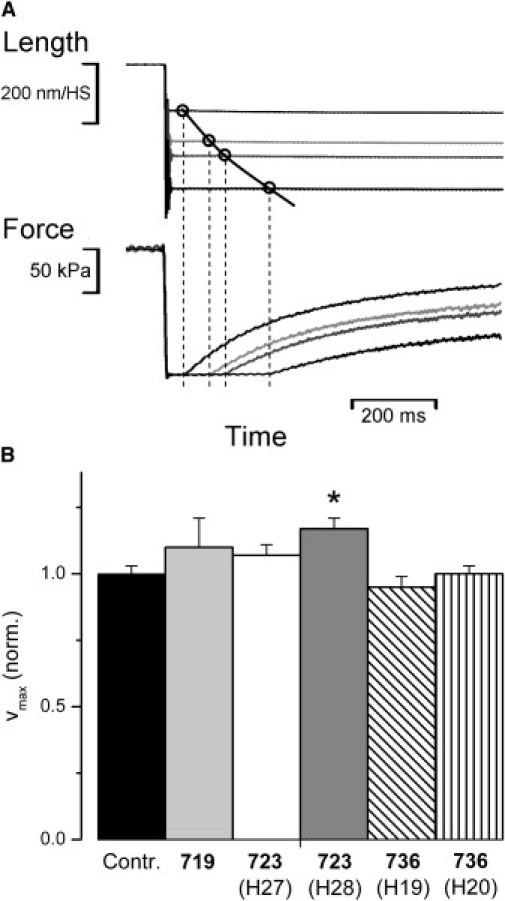
Maximum unloaded shortening velocity (vmax) of control fibers and fibers with mutation. (A) Sample data traces of slack test experiments (39,40)) to determine vmax of a control fiber at 20°C. The time required by the fiber to shorten until the imposed slack is taken up, i.e., until force starts to redevelop, is plotted versus the amplitude of the length change, as indicated by the four data points. Usually at least 10 slacks of different amplitudes were applied to a fiber to obtain the shortening curve. Every slack was followed by a release/restretch maneuver (cf. Fig. 6) to avoid restretching the fibers to isometric length after partial redevelopment of force. vmax, i.e., the initial slope of the shortening curve, is determined by curve fitting. Length of fiber shown here, 3000 μm; sarcomere length 2.4 μm; CSA, 8500 μm2; amplitude of slacks from top to bottom 14%, 22%, 26%, and 36% of fiber length, respectively. Time of slack until start of force increase from left to right 45 ms, 104 ms, 136 ms, and 247 ms, respectively. vmax of this fiber was 3450 (nm/HS)s−1. (B) Effects of mutations R719W, R723G, and I736T on vmax; n = 6–11 fibers. T = 20°. Note effects of mutations on vmax essentially identical for both, 10°C and 20°C (data for 10°C not shown). Mean values (±SE) normalized to values of control fibers. For absolute values see Table 1. Asterisk indicates statistically significant difference to controls. A statistically significant change in vmax compared to controls (p ≤ 0.05) was only found for fibers of patient H28 (mutation R723G).
Figure 4.
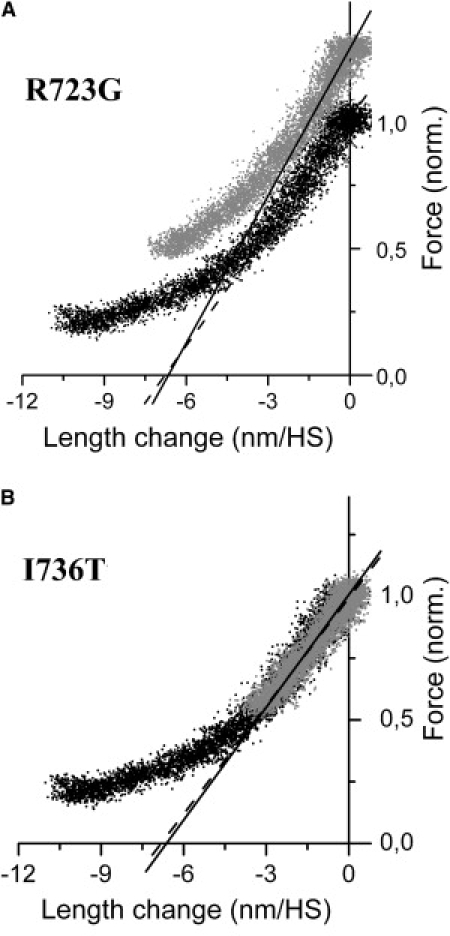
Original records of stiffness measurements during isometric contraction of soleus muscle fibers. Force is plotted versus change in sarcomere length recorded during the imposed releases (T-plots); speed of length change ∼3 × 10³ (nm/HS)s−1 for fibers with mutation (gray dots) and control fibers (black dots), respectively. T = 10°C. Solid and broken lines: fits to the initial linear parts (initial 1.5–2 nm/HS) of the T-plots and extended toward abscissa. Broken lines, control fibers; solid lines, fibers with mutation. Intercept of fitted curves with abscissa indicates y0-value of fibers, i.e., the minimum length change necessary to drop active force to zero if no quick tension recovery were present. (A) Fiber with mutation R723G (patient H27) and control fiber. On average, y0-value for fibers with mutation R723G was ∼10% smaller than for control fibers. This difference, however, was statistically not significant. Fmax of control fiber was 93 kPa. (B) Fiber with mutation I736T and control fiber. The plots essentially superimpose. On average, no difference in stiffness or y0 was detectable between fibers with mutation I736T and control fibers.
To ensure that only fibers with the slow β-MHC-isoform were included in the analysis of functional properties, the fiber type had to be ascertained. This was done in two ways. First by measuring kredev at maximum calcium activation (pCa 4.5) and 10°C at the beginning of each experiment. Second, at the end of the experiments fibers were transferred into SDS-buffer and frozen for later electrophoretic analysis (42). Combined measurements of kredev and subsequent fiber type analysis by SDS-PAGE (10,35) showed that all fibers identified as slow fibers (Type I) based on kredev contained solely β-MHC, whereas fibers identified as fast soleus muscle fibers contained a fast myosin isoform.
Data analysis
Values given in the text are mean ± SE, unless stated otherwise. Statistically significant difference between means was established based on Student's t-test. A probability of <0.05 was considered statistically significant (p ≤ 0.05). Statistical analysis, curve fitting to determine vmax from slack test data, as well as curve fitting of fiber stiffness data (see Fig. 2) were done with the software Origin (Microcal Software, Northampton, MA).
Figure 2.
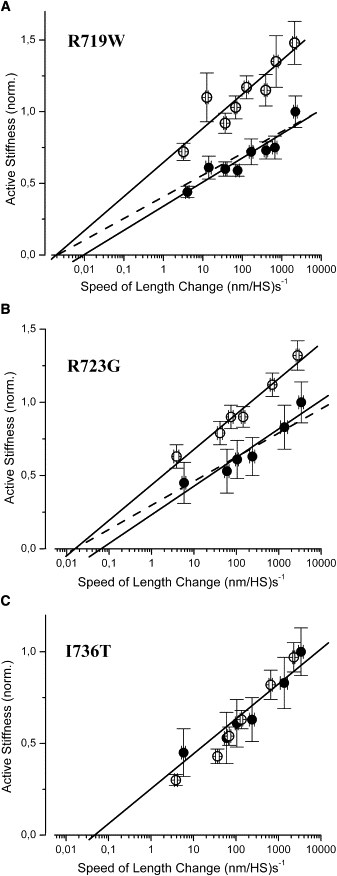
Stiffness of soleus muscle fibers recorded during isometric contraction at different speeds of length change. Stiffness of muscle fibers with myosin mutations R719W, R723G, and I736T, respectively, is shown normalized to stiffness of control fibers at highest available speed of length change. Filled symbols, controls; open symbols, fibers with mutation. (A) Fibers with mutation R719W (n = 9) and control fibers (n = 14). Difference in stiffness at all speeds of length change significant (p < 0.05 or p < 0.01). (B) Fibers with mutation R723G (n = 10) and control fibers (n = 9). Difference in stiffness at all speeds of length change significant (p < 0.05 or p < 0.01), except for the slowest speed. (C) Fibers with mutation I736T (n = 11) and control fibers (n = 9); no statistically significant difference between stiffness of mutated and control fibers (p > 0.05). Solid lines represent linear fits to the respective data points; in C to controls. Broken lines in A and B are derived from the fits to the data points of the fibers with mutation, but vertically scaled down to match the control data. Note that broken lines still fall inside SE-range of controls, i.e., plots for fibers with mutation and for control fibers could be fitted without difference in intercept with abscissa. In some cases error bars are smaller than symbol. T = 10°C, all data mean ± SE.
Results
Effects of the mutations on fiber stiffness in rigor
Under rigor conditions essentially all cross-bridges are attached to actin (16–18). Thus, recording of fiber stiffness in rigor is the most straightforward test to find out whether the mutations R723G and I736T affect cross-bridge stiffness (S∗), as found previously for mutation R719W. Fig. 1 A shows stiffness recorded under rigor conditions, i.e., under nucleotide free conditions, of fibers isolated from M. soleus of two patients with mutation R723G and two patients with mutation I736T. For comparison, stiffness in rigor of fibers with mutation R719W obtained earlier in a different set of experiments is also shown. Because in rigor dissociation of attached myosin heads is very slow, fiber stiffness in rigor is independent of the speed of stretch over a wide range of speeds (43). Therefore, rigor stiffness was not recorded over the whole available range of speeds of stretch. Instead, in Fig. 1 A and also in Table 1 and Table 2 rigor stiffness recorded at a speed of stretch of ∼3–5 × 10³ (nm/half-sarcomere)s−1 is shown. For mutation R719W a significant increase in rigor stiffness of 45 ± 13% (mean ± SE; p < 0.05) was found (rigor stiffness of corresponding control fibers 12.9 ± 2.6 kPa/nm (n = 7); Table 2; see Köhler et al. (10)). Mutation R723G also was associated with a significantly greater fiber stiffness in rigor compared to control fibers. The increase was 43 ± 21% (p < 0.05) for fibers from patient H27 and 59 ± 15% (p < 0.001) for fibers from patient H28 (rigor stiffness of control fibers 17.7 ± 2.7 kPa/nm (n = 6); Table 1). Soleus muscle fibers from the two patients with mutation I736T showed only a much smaller, statistically not significant increase in rigor stiffness by 9 ± 9% for patient H19 and by 15 ± 14% for patient H20 (same controls as for R723G; Table 1). Almost identical effects of the different mutations on fiber stiffness in rigor were also observed at a lower speed of stretch of ∼40 (nm/half-sarcomere)s−1 (data not shown).
Figure 1.
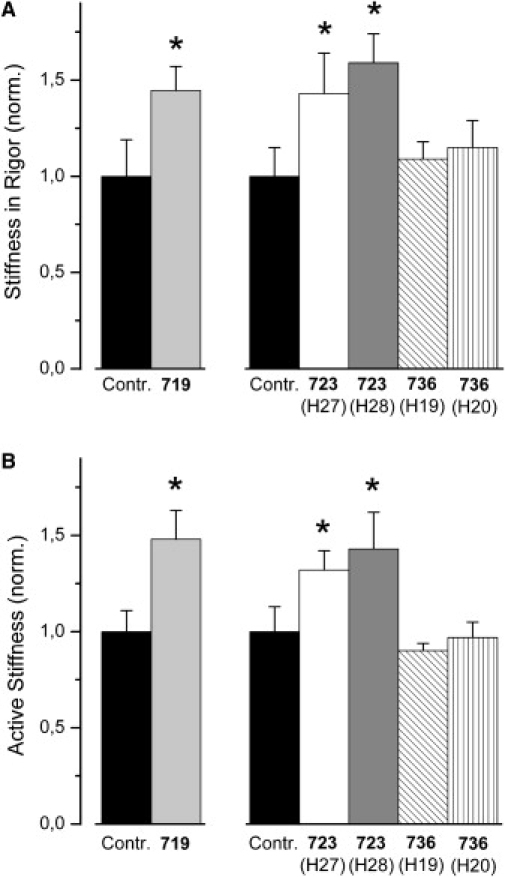
Effects of myosin head domain mutations R719W, R723G, and I736T on fiber stiffness. (A) Stiffness of soleus muscle fibers in the absence of nucleotide (rigor) recorded at highest available speed of stretch (∼3–5 × 10³ (nm/HS)s−1). HS, half-sarcomere. T = 5°C; n = 5–10 fibers. (B) Fiber stiffness recorded during isometric contraction at highest available speed of length change (∼2–4 × 10³ (nm/HS)s−1); T = 10°C to ensure structural integrity of fibers and stability of striation pattern throughout experiments; n = 6–14 fibers. Mean values ± SE, normalized to rigor (A) or active stiffness (B) of control fibers, respectively. ∗Statistically significant difference compared to controls. Fiber stiffness for mutation R719W was determined previously in a separate set of experiments, therefore the corresponding control data are shown here in addition. For absolute values see Table 1 and Table 2.
Because in rigor at any one moment essentially all myosin heads are attached to actin with very high affinity (16–18), an increase in fiber stiffness most likely is not due to differences in the fraction of attached cross-bridges, e.g., caused by faster attachment to actin (k+). Because, in addition, fiber stiffness in rigor is essentially independent of the speed of the applied stretch, e.g., at 3–5 × 10³ (nm/half-sarcomere)s−1 vs. 40 (nm/half-sarcomere)s−1, the observed differences in rigor stiffness can also not be due to differences in the rate constant for dissociation of rigor cross-bridges from actin (k−; (44)). The increase in rigor stiffness of soleus fibers with mutations R719W and R723G, respectively, rather indicates that these mutations are associated with higher cross-bridge stiffness, i.e., a higher resistance to elastic distortion of the individual myosin heads (S∗). Note that rigor stiffness is not affected by presence/absence of Mg2+-ions (rigor solution with 2 mM free Mg2+-ions, no EDTA versus rigor solution with 2.5 mM EDTA, no free Mg2+-ions; T. Kraft, unpublished results). Thus, even if the structure of the light chain binding domain were affected by free Mg2+-ions, it apparently does not affect fiber stiffness in rigor.
Effects of the mutations on fiber stiffness during isometric contraction
A change in stiffness of the individual cross-bridges (S∗) due to a mutation is expected to also cause a change in fiber stiffness during isometric contraction. Fiber stiffness during isometric contraction, however, can further be changed if mutations affect cross-bridge cycling kinetics (Eq. 1) or actin binding kinetics of the force generating cross-bridges. Fig. 1 B, Table 1, and Table 2 show, for all three mutations and all five patients, fiber stiffness measured during isometric contraction by imposing small ramp-shaped releases. The speed of the applied length changes was ∼2–5 × 10³ (nm/half-sarcomere)s−1. Mutation R719W was associated with a significant increase in stiffness of isometrically contracting soleus muscle fibers by 48 ± 15% (p < 0.05). Active stiffness of the respective control fibers was 10.4 ± 1.1 kPa/nm (n = 14; Table 2 and Köhler et al. (10)). Similarly, active stiffness of muscle fibers from patient H27 and patient H28 with mutation R723G increased significantly by 32 ± 10% (p < 0.05) and 43 ± 19% (p < 0.05), compared to active stiffness of control fibers that was 13.2 ± 1.7 kPa/nm (n = 9; Table 1). Active stiffness of soleus fibers with mutation I736T was not significantly different from active stiffness of control fibers. Note that data for fibers with mutation R719W and the corresponding group of control fibers (Table 2) were obtained in earlier experiments with somewhat differently composed solutions.
Unlike rigor, fiber stiffness observed during isometric steady-state contraction depends on the speed of stretch, presumably due to cross-bridges progressing to subsequent states in the ATPase cycle (2) and because of transient detachment and rapid reattachment of force generating cross-bridges (20). To exclude that the changes in fiber stiffness observed during isometric contraction are caused by changes in attachment/detachment kinetics or changes in progression of cross-bridges to later states in their ATPase cycle, we also recorded stiffness-speed relations, i.e., the dependence of fiber stiffness on the speed of the length changes applied to the fibers in isometric steady-state contraction. If only the stiffness per cross-bridge (S∗) is affected by the mutations, then fiber stiffness is expected to increase by a similar fraction at all speeds of length change. Changes in the rate constant for e.g., dissociation from actin (k−) would cause a horizontal shift in the stiffness-speed relation (44).
The stiffness-speed relations in Fig. 2, A–C, show that mutation R719W as well as mutation R723G (shown here for patient H27) are associated with an increase in active fiber stiffness at all speeds of stretch. In contrast, no significant difference, compared to control fibers, was found for active stiffness of soleus fibers with mutation I736T (shown here for patient H20). Muscle fibers from the other two patients, patient H28 with mutation R723G and patient H19 with mutation I736T showed similar curves with and without an increase in active stiffness, respectively (data not shown). Solid lines in Fig. 2, A–C, show linear fits to the different stiffness-speed relations. The small shifts in the intercept with the abscissa for mutations R719W and R723G show that for both mutations only a small, at most three- to fivefold decrease in the rate constant for transient dissociation from actin or quick tension recovery may contribute to the increased active stiffness (44). The dashed lines with unchanged intercept on the abscissa show that for both mutations, stiffness-speed relations of controls and mutants can almost equally well be accounted for without any horizontal shift, i.e., without assuming approximately three- to fivefold slower rate constants for transient detachment or quick tension recovery. Nevertheless, even if this shift would be considered to be real, it could not fully account for the observed increase in stiffness during isometric contraction, but at most for 20–25% of it. These findings imply that at least the major part of the increase in active fiber stiffness seen with mutations R719W and R723G, respectively, is due to changes in S∗, i.e., a higher resistance to elastic distortion of the individual myosin heads, as implied by the increased stiffness seen under rigor conditions.
At this point, however, it is not excluded that mutations in the converter domain may also be associated with some changes in cross-bridges turnover kinetics during active contraction, that may contribute to the changes in fiber stiffness observed during isometric contraction.
Effects of the mutations on isometric force
If mutations increase stiffness of an individual myosin head, it is expected that isometric force is also increased. The increase in force should be proportional to the increase in stiffness of the individual myosin head, unless i), the extent of elastic distortion of a force generating cross-bridge (y0∗) is also changed; or ii), the fraction of cross-bridges in strong-binding, force generating states is also highly affected (Eqs. 2a and 2b).
Thus, as the next step we measured active isometric force in comparison to fiber stiffness in rigor and fiber stiffness seen during isometric contraction. Fig. 3, Table 1, and Table 2 footnote show isometric force of fibers with mutations R723G, I736T, and R719W, respectively, normalized to maximum force generation of fibers from controls. For mutation R719W a substantial increase in force by 59 ± 7% and 49 ± 5% compared to controls at 10°C and 20°C, respectively, was observed. Fmax of the corresponding control fibers was 72.6 ± 4.05 kPa (n = 19) at 10°C and 130.49 ± 6.72 kPa (n = 19) at 20°C (Table 2; Köhler et al. (10)). These values are quite similar to the 43 ± 2% force increase (20°C) observed with mutation R719W in a recent set of experiments when fiber ATPase activity was determined with different solution composition (Fig. 3, Table 1). For mutation R723G, patient H27 a smaller, but also significant increase in isometric force by 23 ± 5% and 19 ± 1% at 10°C and 20°C, respectively, was found (p < 0.001; Fmax of controls was 108.94 ± 5.31 kPa (n = 36) and 140.86 ± 1.25 kPa (n = 45) at 10°C and 20°C, respectively; Table 1). Muscle fibers with the same mutation but from patient H28 showed a similar increase in isometric force (Table 1). Muscle fibers from the two patients with mutation I736T showed no significant change in isometric force generation. The lack of change in isometric force for mutation I736T, and the increase in isometric force for mutations R719W and R723G qualitatively agree with the data for fiber stiffness in rigor and during isometric force generation. The magnitude of the increase in isometric force of fibers with mutation R723G, however, is only about half of the increase in fiber stiffness, whereas the increase in isometric force of the R719W mutation, in contrast, is about as large as the increase in isometric stiffness.
Figure 3.
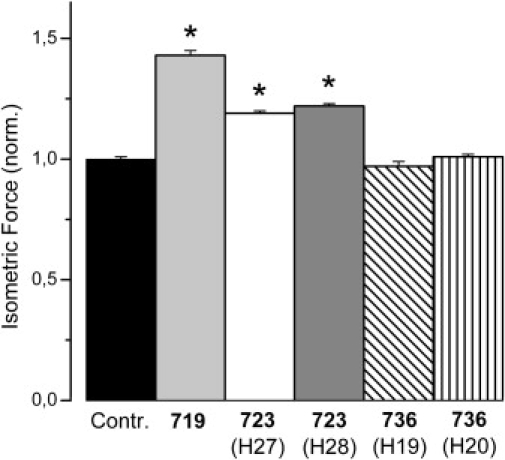
Effects of myosin head domain mutations on isometric force. Mean values (±SE) normalized to isometric force of fibers from healthy controls. T = 20°C. Control fibers n = 45; Mutation R719W n = 14 (Fmax data from Table 1); mutation R723G n = 7 fibers of patient H27 and n = 14 fibers of patient H28; mutation I736T n = 7 fibers of patient H19 and n = 20 fibers of patient H20. For fibers with mutations R719W and R723G, respectively, a significant increase in isometric force generation was found (p < 0.001). Asterisk indicates statistically significant difference compared to controls. For absolute values see Table 1 and Table 2, sample force trace is shown in Fig. 6.
Effects of the mutations on the y0–value
The discrepancies between increase in isometric force and fiber stiffness recorded in rigor or isometric contraction raise the question whether the extent of elastic distortion of the individual cross-bridge during force generation, y0∗, may be differently affected by the two mutations (Eq. 2b). We therefore determined for control fibers and fibers with the different mutations the minimum extent of filament sliding necessary to drop isometric force to zero, y0. Fig. 4 shows original plots of force versus change in sarcomere length during ramp-shaped releases imposed on isometrically contracting muscle fibers (T-plots (20,21)). Lines were fitted to the initial linear parts of the plots (length change, 1.5–2 nm/half-sarcomere). The slopes of these lines represent apparent fiber stiffness. The x axis intercepts of the fitted lines indicate the minimum change in half-sarcomere length, i.e., the minimum distance of filament sliding, necessary to drop isometric force to zero (y0-value (23)).
The y0-value of fibers with mutation I736T on average was not significantly different from control fibers; an example of a T-plot is shown in Fig. 4 B. This is consistent with the observation that mutation I736T neither affects isometric force generation nor fiber stiffness in rigor or under isometric steady-state contraction (Table 1, Figs. 1–3). The y0-values for the fiber with mutation R723G and for the control fiber shown here are also very similar (Fig. 4 A). On average, the x axis intercepts at 10°C were 8.53 ± 0.42 nm/HS (n = 6) and 7.70 ± 0.74 nm/HS (n = 9) for control fibers and fibers with mutation R723G, respectively (Table 1). Although the difference is not significant, the data suggest that for fibers with mutation R723G the length change necessary to drop active force to zero (i.e., the elastic extension of attached mutated cross-bridges plus elastic extension of myofilaments) is reduced by some 10% compared to controls. For mutation R719W, it was shown previously (Table 2; (10)) that the y0-values for fibers with the mutation and for control fibers were also not significantly different. However, a small increase in y0 for fibers with mutation of <10% from 7.09 ± 0.57nm/HS (n = 14) for controls to 7.66 ± 0.99 nm/HS (n = 9) for fibers with mutation R719W was observed (T = 10°C). Thus, both the R719W and R723G mutation only slightly affect the minimum distance of filament sliding needed to drop isometric force to zero. To estimate the changes in mean elastic extension of the mutated heads (y0∗) from the observed y0-values, however, both myofilament compliance and the fraction of mutated heads in these fibers (14) have to be considered (see Discussion).
For an estimate of filament compliance we measured fiber stiffness and force during isometric steady-state contraction of slow fibers of M. soleus muscle fibers from controls at different levels of calcium-activation (from pCa 4.5 to pCa 6.6; Fig. 5). Fiber stiffness was measured in ramp-shaped releases (T-plots; (20,21), see also Fig. 4) and the y0-values were determined. In Fig. 5 isometric force is plotted versus y0. Fmax of this set of control fibers was 112.95 ± 0.11 kPa (10°C), y0 at maximum activation was 8.53 ± 0.42 nm/HS (n = 3–6 fibers). A line was fitted to the data points that had a y axis intercept at 5.67 nm/HS. From this filament compliance per half-sarcomere could be calculated that was 1/(112.95 kPa/(8.53 nm − 5.67 nm)) = 0.025 nm/kPa.
Effects of the mutations on cross-bridge cycling kinetics
The data from measurements of fiber stiffness in rigor and during active contraction hint toward an increase in cross-bridge stiffness, S∗, for the R719W and R723G mutations whereas cross-bridges with the I736T mutation appear nearly unaffected. The data of active isometric force qualitatively agree with this notion, although the increase in force of the R723G mutation appears on the low side. At this stage, however, it is not excluded that the three mutations may (also) be associated with some changes in cross-bridge cycling kinetics during isometric contraction.
To characterize cross-bridge cycling kinetics of soleus fibers with and without mutation, the rate constant of force redevelopment after a short period of unloaded shortening (kredev; Eq. 3), fiber ATPase activity during maximum isometric force generation (Eq. 4), and maximum shortening velocity (vmax) were determined. In Table 1 the results of these experiments for the different mutations and the different patients are listed. The data are normalized to values of soleus muscle fibers from control individuals. Fig. 6 B shows kredev of muscle fibers with the different mutations and of control fibers. kredev for control fibers was 0.27 ± 0.02 s−1 (n = 36) and 2.69 ± 0.06 s−1 (n = 45) at 10°C and 20°C, respectively. None of the mutations affects kredev significantly. Fig. 7 B shows that the ATPase activity of isometrically contracting soleus muscle fibers with the mutations R723G and I736T is not different from control fibers. ATPase activity in control fibers was 0.95 ± 0.02 ATP/(S1∗s) at 20°C (n = 21; Table 1). However, with mutation R719W, fiber ATPase is significantly increased by 21 ± 2% (p < 0.001). This indicates that mutation R719W to some extent affects cross-bridge cycling kinetics because ATPase activity (Eq. 4) is not expected to be sensitive to changes in S∗ or F∗, two parameters that could account for changes in fiber stiffness and changes in active force. The increase in isometric fiber ATPase could result from e.g., an increase in gapp that would tend to decrease active force, or an increase in fapp that would tend to increase active force.
vmax of isotonically shortening soleus muscle fibers with the different mutations in comparison to vmax of control fibers is shown in Table 1 and Fig. 8 B. vmax of control fibers was 329.9 ± 8.61 (nm/HS)s−1 (n = 10) and 3246 ± 86.79 (nm/HS)s−1 (n = 7) at 10°C and 20°C, respectively. For mutation R719W and mutation R723G a slight increase in vmax was found that was significant only for fibers with mutation R723G from patient H28 (p ≤ 0.05). Data from fibers of the second patient with mutation R723G and of the patient with the R719W mutation only show a nonsignificant trend toward higher vmax. For the I736T mutation no effect on vmax was observed. This indicates that mutations R719W and R723G may affect cross-bridge turnover under isotonic conditions to some extent. The slight increase in vmax could reflect an increase in g2app, the rate constant for the transition of the cross-bridges back to the nonforce generating states during unloaded shortening.
Discussion
Mutations R719W and R723G reveal the converter domain as the major element of cross-bridge compliance
The increase in rigor stiffness of muscle fibers with either point mutation R723G or, as shown before, with mutation R719W, can be attributed to a substantial increase in stiffness of the individual mutated myosin heads (S∗). An increased cross-bridge stiffness and thus an increased fiber stiffness, however, can only be caused by an increased stiffness of the most compliant part of the myosin head domain. An increase in stiffness of a more rigid element, in contrast, would have essentially no effect on overall stiffness of a cross-bridge or on fiber stiffness. This is because overall stiffness of the acto-myosin complex is limited by stiffness of the element(s) with the smallest resistance to elastic distortion, i.e., the most compliant element(s) of this complex. Because both mutations, R719W and R723G are located inside the converter domain of the myosin head, the increased stiffness in rigor and isometric contraction indicates that most of the elastic distortion of the cross-bridges occurs in the converter domain or in structural elements closely related to the converter. Consequently the converter, or at least converter-associated structures that are influenced by amino acids R719 and R723, respectively, represent compliant structural elements of the cross-bridge where main elastic distortion occurs. This conclusion is consistent with observations from electron microscopy and single particle analysis on myosin V HMM molecules where flexibility between motor domain and lever arm near the converter subdomain had to be postulated to accommodate the different conformations of the two actin-attached heads (45). The absence of strongly curved lever arms in the reconstructions is consistent with elastic deformation within the converter rather than in the light chain binding domain.
Mutation I736T had neither a significant effect on fiber stiffness nor on force generation. Only a small, statistically not significant increase in rigor stiffness was observed. This implies that this mutation does not affect the elastic distortion of the myosin head domain substantially. The missing effect of mutation I736T on any of the measured parameters could be due to the different location within the converter region. Amino acid I736 is located at some distance from residues R719 and R723 toward the surface of the converter (Fig. 9; cf. structures published by Houdusse et al. (28) and Rayment et al. (29)). Aside from this, the relatively low abundance of mutated myosin (37% on average (46)) in the contractile system of the I736T biopsies may yield smaller effects on functional parameters than R719W or R723G do, with an average abundance of mutated myosin of 54% and 62%, respectively (14,46).
Figure 9.
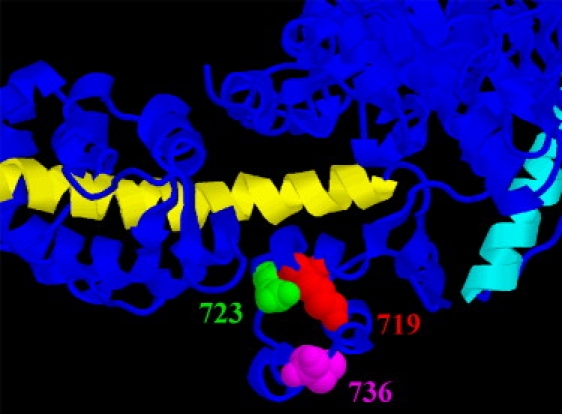
Ribbon diagram of the converter region with adjacent parts of catalytic and light chain binding domains. Catalytic domain points to upper right, light chain binding domain toward left. Chicken skeletal muscle myosin (adapted from Rayment et al. (29)). Long α-helix of light chain binding domain in yellow; relay helix of catalytic domain in cyan. Residues equivalent to amino acids R719 (red), R723 (green), and I736 (magenta) in the human sequence are shown in space-filling representation. Note that residues equivalent to R719 and R723 are located in a helix parallel to and in close contact with the long α-helix of light chain binding domain. Also note that 723 is very close to the essential light chain. The residue equivalent to I736 is located further away at the surface of the converter. Essentially the same arrangement is found in the scallop structure of Houdusse et al. (28) if sequences are properly aligned (+2 residues for chicken, −2 residues for scallop). In the scallop structure, however, position equivalent to 736 is at the start of a gap in the polypeptide chain at the surface. Figure prepared using RasMol.
Amino acids 719 and 723, in contrast, are located in the core of the converter in a helix with close contacts to the first turns of the long α-helix in the atomic models of the myosin head domain of both scallop and chicken (Fig. 9; (28,29)). Both mutations, R719W and R723G, cause a loss of positive charge and an increase in hydrophobicity. The converter forms a socket for the lever arm, and the anchoring of the long alpha helix in the converter seems to be stabilized by hydrophobic patches (28). Thus, both R719W and R723G mutations might well form an even more stable anchoring socket for the long alpha helix of the light chain binding domain, i.e., with mutation R719W and R723G the converter may now act as a less compliant anchoring element. In addition, residue 723 is very close to the essential light chain (Fig. 9). Interactions of parts of the converter with the essential light chain might further stabilize elastic anchoring of the lever arm in the converter. This again would place R723 together with R719 at a critical point for resistance to elastic distortion in the complex formed by the converter with the α-helix of lever arm and the essential light chain (Fig. 9). The high similarity in the location of residues equivalent to human β-cardiac R719 and R723 residues in both scallop and chicken structure suggest that in cardiac muscle a similar structural organization may be found, but the crystal structure of the β-cardiac head domain is required to clarify this point.
Our data on mutations within the converter domain, that occur naturally in HCM, not only suggest strongly that the converter domain is the main structural element of cross-bridge where elastic distortion occurs but also show that an amino acid exchange within the converter can change cross-bridge stiffness quite substantially. Sequence comparison of different class II myosins shows that several residues within the converter are not conserved, including residues equivalent to R719, R723, and I736 of the β-cardiac myosin heavy chain. Because even a single amino acid exchange, at least at some of these positions, quite significantly affects cross-bridge elasticity, our data raise the possibility that the extent of elastic distortion of the myosin head on generation of motile forces may be quite different for different myosins, i.e., may specifically be tuned to different functional requirements.
Changes in cross-bridge cycling kinetics cannot explain larger isometric force with mutations R719W and R723G
In addition to the increase in fiber stiffness under rigor conditions, we also found some effects of mutations R723G and R719W on parameters of cross-bridge cycling kinetics. Mutation R719W was associated with a 21% increase in ATPase activity along with the much larger increase in Fmax by at least 43% and an increase in active fiber stiffness by 48%. An increase in fiber ATPase could be due to changes in cross-bridge cycling kinetics, i.e., fapp and/or gapp, or an increase in n, the total number of turning-over cross-bridges per half-sarcomere (Eq. 4). The second possibility, an increase in n, has previously been ruled out for mutation R719W (10). No differences in packing of myofibrils or myofilaments compared to controls was found. In addition, it was shown for HCM mutations R403Q and R249Q expressed in rat cardiomyocytes that there was no effect of these mutations on assembly of the thick filaments and formation of the sarcomeres (15). This indicates that effects of HCM point mutations in the myosin head domain on assembly of thick filament and therefore on n are quite unlikely.
The increase in ATPase activity of fibers with mutation R719W most likely is due to changes in fapp and/or gapp. In principle, an increase in fiber ATPase can be caused by an increase in fapp, or an increase in gapp, or changes in both rate constants. However, such changes will also affect kredev and Fmax (Eqs. 2a and 3). When we calculated changes in ATPase, kredev, and Fmax for various changes of fapp and/or gapp we found that an increase in fapp by 42% and an increase in gapp by 7% resulted in an increase in ATPase activity by 21%, as measured experimentally, and an increase in kredev that remains close to the limits of the measured SD-values of kredev. This possible increase in fapp and gapp, however, would only cause an increase in Fmax by 13%. Other combinations of changes in fapp and gapp that yielded larger increases in Fmax were inconsistent with the observed ATPase and/or kredev data. Thus, it was not possible to fully account for the at least 43% increase in isometric force by kinetic changes alone. Kinetic changes can at most contribute a 10–15% increase in isometric force and a corresponding increase in active fiber stiffness by a higher occupancy of force generating states. The remaining increase in force and active fiber stiffness for mutation R719W suggests a change in F∗, the contribution of individual force-generating cross-bridges to isometric force.
Measurements of kredev and isometric fiber ATPase for mutation R723G did not show any significant changes in cross-bridge cycling kinetics. Therefore, the increase in Fmax (20°C) with this mutation by 19% and 22%, respectively, implies an increase in F∗. It is unlikely that changes in cross-bridge cycling kinetics, e.g., in kredev, were masked by increased elastic extension of myofilaments resulting from the higher active forces generated by cross-bridges with mutation R723G. In previous work, we had measured kredev when active force at saturating Ca2+ was inhibited by different extent, either by the actin binding fragment of caldesmon (34,47) or by incubation with N-ethylmaleimide-modified myosin subfragment 1 (48). Inhibition of active force by competition with binding of N-ethylmaleimide-modified myosin subfragment 1 to actin had no effect on the observed kredev at saturating Ca2+, inhibition of active force by the actin binding fragment of caldesmon reduced kredev at saturating Ca2+ by at most 10–15%. Thus, changes in elastic extension of filaments by changing active force other than by Ca2+ concentration seems to have little if any effect on kredev.
The increase in maximum unloaded shortening velocity under isotonic conditions (vmax) by 7–17% for mutations R723G and R719W, although not significant except for patient H28 with mutation R723G, indicates that these two mutations may affect cross-bridge turnover kinetics under isotonic conditions to some extent. Shortening velocity is primarily limited by the rate constant of the transition of the cross-bridges back into the nonforce generating states, g2app, at the end of the power stroke (1). Therefore, our results indicate that mutation R719W and R723G might slightly speed up this transition of the cross-bridges under isotonic conditions that is coupled to strain-dependent release of ADP from the active site (25) and binding of a new ATP molecule (26).
In summary, the observed changes in cross-bridge cycling kinetics can only account for a small part of the increase in isometric force and isometric fiber stiffness observed with mutation R719W. The major effect of both mutations, R719W and R723G, however, most likely is an increase in force contribution and in stiffness of the individual myosin head, F∗ and S∗.
Effects of mutations R719W and R723G on stiffness S∗ and force F∗ of individual cross-bridges
Observed fiber stiffness depends on i), stiffness (resistance to elastic distortion) of the individual cross-bridges (S∗); ii), the number of myosin heads attached to actin at the moment of measurement; and iii), myofilament compliance. Mutations in the converter domain of the myosin head most likely do not affect myofilament compliance. Therefore, the increase in fiber stiffness in rigor, where all myosin heads are supposed to be attached to actin with high affinity, indicates that mutations R719W and R723G increase stiffness of the individual mutated myosin heads.
To estimate changes in the stiffness of rigor cross-bridges with mutation R723G from the observed changes in fiber stiffness (Table 1), filament compliance needs to be considered. For this estimate we measured fiber stiffness and force during isometric contraction of soleus muscle fibers from controls at different levels of calcium-activation and determined filament compliance per half-sarcomere that was 0.025 nm/kPa at 10°C (Fig. 5). This is almost identical with the value published previously for human slow muscle fibers (49). From rigor stiffness of control fibers (17.7 kPa/nm; Table 1), half-sarcomere compliance of control fibers in rigor is 1/17.7 = 0.056 nm/kPa. Thus, compliance of the population of attached rigor cross-bridges per half-sarcomere of control fibers is 0.056–0.025 = 0.031 nm/kPa; i.e., their stiffness is 31.75 ± 9.6 kPa/nm (n = 6). Based on ∼111 × 103 myosin heads/μm2 in a half-sarcomere of a skeletal muscle fiber, which can be derived from myosin concentration in muscle fibers (50) and that is very similar to the value derived from filament lattice dimensions in Linari et al. (115 × 103 myosin heads/μm2 in a half-sarcomere) (51), rigor stiffness of individual heads in the slow skeletal muscle fibers of control individuals is 0.29 ± 0.09 pN/nm (Table 3; 31.75 × 10¹⁵ pN/(m2 × nm)/111 × 1015 heads/m2).
Table 3.
Estimates of stiffness per myosin head (S∗), force per myosin head (F∗), and y0 of individual myosin heads (y0∗) calculated from half-sarcomere stiffness (after subtraction of filament compliance) and isometric force generated by the soleus muscle fibers
| Mut R719W∗ | Controls for Mut R719W∗ | Mut R723G†(H27) | Controls for Mut R723G† | |
|---|---|---|---|---|
| Stiffness per head in rigor (pN/nm) | 0.45 | 0.17 | 0.84 | 0.29 |
| Isometric stiffness per head at 10°C (pN/nm) | 0.39 | 0.19 | 0.52 | 0.28 |
| Isometric force per head at 10°C (pN) | 1.77 | 0.99 | 1.99 | 1.49 |
| Isometric force per head at 20°C (pN) | 2.88 | 1.77 | 2.56 | 1.92 |
| y0 per head at 10°C (nm) | 4.54 | 5.14 | 3.83 | 5.32 |
Calculations are based on a filament compliance of 0.025 nm/kPa (Fig. 5). Force and stiffness per head during isometric contraction were calculated based on 111 × 103 myosin heads/μm2 in a half-sarcomere and a fraction of strongly bound myosin heads of 0.66 (52).
For the two controls (that were measured under slightly different conditions) the values for stiffness per head in rigor (0.17 ± 0.05 pN/nm, (n = 7) and 0.29 ± 0.09 pN/nm (n = 6)) and isometric contraction (0.19 ± 0.04 pN/nm, (n = 14) and 0.28 ± 0.07 pN/nm (n = 9)) were not significantly different (all values ± SE).
Calculations based on a fraction of 54% of myosin heads with mutation R719W, 46% wild-type heads (46), and on the values for force and stiffness shown in Table 2 (see also 10). For mutation R719W, changes of cross-bridge turnover kinetics were also taken into account that contribute an increase in Fmax and in active fiber stiffness of ∼15%.
For mutation R723G, patient H27, fiber stiffness in rigor is 1.43 times the stiffness of control fibers (Table 1). Thus, total half-sarcomere compliance of R723G-fibers of this patient in rigor is 1/25.3 = 0.0395 nm/kPa. Assuming unchanged filament compliance, the compliance of rigor cross-bridges in fibers with mutation R723G is 0.0395–0.025 = 0.0145 nm/kPa, i.e., their stiffness is 68.9 kPa/nm. According to our protein quantification data, in muscle with the R723G mutation 38% of the cross-bridges are wild-type cross-bridges (stiffness, 31.75 kPa/nm) and 62% of the cross-bridges have the R723G-mutation (14). To obtain a stiffness of the mixed cross-bridge population in rigor of 68.9 kPa/nm, a pure population of R723G cross-bridges needs to have a stiffness in rigor of 91.8 kPa/nm. Assuming that cross-bridges with the R723G-mutation are also all attached to actin in rigor, as the wild-type cross-bridges, i.e., that the number of attached cross-bridges is unchanged, the above estimate implies that the stiffness of the individual cross-bridge with mutation R723G in rigor (S∗rigor 723) is ∼2.9 times larger than the stiffness of the wild-type cross-bridge (S∗rigor WT), i.e., 0.84 pN/nm (Table 3).
In earlier measurements on mutation R719W and controls with solutions of somewhat different composition (Table 2; (10)) compliance of rigor cross-bridges per half-sarcomere of control fibers was 0.0775–0.025 = 0.0525 nm/kPa; i.e., their stiffness was 19.05 ± 6.1 kPa/nm (n = 7) that corresponds to 0.17 ± 0.05 pN/nm for individual myosin heads (Table 3). These values are not significantly different from stiffness of the group of control fibers for mutation R723G (Tables 1 and 3). The difference in stiffness for the two groups of control fibers can be related to different levels of force where stiffness measurements were done most likely due to differences during the transition of the fibers into rigor at slightly different experimental conditions. Fibers with mutation R719W, on average, had 1.45-fold higher fiber stiffness in rigor compared to controls (Table 2). Based on this and the same estimate as shown above, compliance of rigor cross-bridges in fibers with mutation R719W is 0.053–0.025 = 0.028 nm/kPa, i.e., their stiffness is 35.1 kPa/nm. If we consider that in these fibers 54% of myosin heads carried mutation R719W (46), a pure population of R719W cross-bridges needs to have a stiffness in rigor of 48.8 kPa/nm to obtain a stiffness of 35.1 kPa/nm of the mixed cross-bridge population in fibers of the patient with mutation R719W. This indicates that the stiffness of a cross-bridge with R719W mutation in rigor (S∗rigor 719) is ∼2.6 times larger than the stiffness of the cross-bridges in the respective group of control fibers (S∗rigor WT), i.e., 0.45 pN/nm (Table 3).
Next we asked whether data of fiber stiffness of mutation R723G recorded during isometric contraction (Table 1) yield a similar change in stiffness of force-generating cross-bridges. First we estimated the stiffness of force-generating cross-bridges of control fibers at 10°C along the same lines as we did for stiffness in rigor. Fiber stiffness of control fibers during isometric contraction is ∼13.2 kPa/nm (Table 1), i.e., half-sarcomere compliance is 0.076 nm/kPa. With filament compliance per half-sarcomere of 0.025 nm/kPa (Fig. 5), compliance of the force generating wild-type cross-bridge population is 0.076–0.025 = 0.051 nm/kPa. Hence their stiffness is 19.7 ± 5.1 kPa/nm (n = 9), which corresponds to 0.18 ± 0.05 pN/nm for individual force generating cross-bridges in slow skeletal muscle fibers of controls at 10°C. Yet, if we consider a fraction of strongly attached cross-bridges in isometric contraction of 0.66, as observed previously (52), then stiffness of the individual myosin heads in soleus muscle of control individuals is 0.28 pN/nm at 10°C (Table 3).
Active stiffness of fibers from patient H27 with the R723G mutation at 10°C is 1.32 times the stiffness of control fibers (Table 1), i.e., 17.4 kPa/nm. Hence half-sarcomere compliance is 0.0574 nm/kPa, yielding a compliance of the population of force-generating cross-bridges in fibers with mutation R723G of 0.0574–0.025 = 0.032 nm/kPa or a stiffness of 30.9 kPa/nm compared to the 19.7 kPa/nm for the force generating cross-bridges in the control fibers. To obtain stiffness of the force-generating cross-bridges with mutation R723G we must consider that 38% of the myosin heads are of the wild-type form and 62% with the R723G mutation. Therefore, stiffness of a pure population of force generating cross-bridges with mutation R723G is 37.7 kPa/nm. If we take a fraction of strongly attached cross-bridges in isometric contraction of 0.66 into account, then stiffness of an individual mutated force generating cross-bridge (S∗act 723) is 0.52 pN/nm (Table 3). This is 1.9-fold larger than the stiffness of a force generating cross-bridge in control fibers (S∗act WT).
For a similar estimate of the increase in stiffness of force generating cross-bridges with mutation R719W, the 1.48-fold average increase in active fiber stiffness at 10°C (Table 2; (10)) together with a fraction of 54% of mutated myosin heads as well as changes in cross-bridge cycling kinetics have to be taken into account. Half-sarcomere stiffness of the population of force-generating cross-bridges in fibers with mutation R719W at 10°C is 25.0 kPa/nm compared to 14.1 ± 3.0 kPa/nm (n = 14) for cross-bridges in the respective control fiber group (Table 2). In the control fibers this corresponds to 0.13 ± 0.03 pN/nm for individual force generating cross-bridges. Taking into account a fraction of strongly attached cross-bridges of 0.66, as observed previously for isometric contraction (52), stiffness of an individual myosin head during force generation in this group of control fibers is 0.19 pN/nm. Yet, we assume that for mutation R719W ∼1/3 of the observed increase in fiber stiffness during isometric contraction is due to changes in occupancy of force generating cross-bridges resulting from effects of the R719W mutation on cross-bridge cycling kinetics. Subtracting one-third from the stiffness increase of force generating cross-bridges in fibers with mutation R719W leaves an increase from 14.1 kPa/nm (control) to 21.4 kPa/nm (R719W) unaccounted by changes in cross-bridge turnover kinetics. Assuming that the increase of 7.3 kPa/nm arises from higher stiffness of the cross-bridges with mutation R719W we can estimate the necessary increase in stiffness of the R719W-cross-bridges, considering that 46% of the myosin heads are of the wild-type form, 54% with the R719W mutation. This yields a stiffness of a pure population of force generating cross-bridges with mutation R719W of 27.7 kPa/nm. Thus, stiffness of individual force generating cross-bridges with mutation R719W (S∗act 719) is ∼2-fold larger than the stiffness of a force generating cross-bridge (S∗act WT) in the respective group of control fibers (Table 2). This corresponds to 0.19 pN/nm and 0.39 pN/nm per wild-type myosin head and per myosin head with mutation R719W (Table 3), respectively, if a fraction of strongly attached cross-bridges in isometric contraction of 0.66 is taken into account. If all the increase in fiber stiffness were due to changes in cross-bridge stiffness, i.e., assuming no significant change in the fraction of force-generating cross-bridges by changes in cycling kinetics, a 2.4-fold increase in stiffness of the force generating cross-bridge with mutation R719W would be required to account for the observed change in active fiber stiffness.
Thus, altogether, the data of fiber stiffness during isometric contraction suggest that for both mutations cross-bridge stiffness increases by about the same extent (∼2-fold). In rigor the increase is somewhat larger for cross-bridges with mutation R723G (2.9-fold) compared to cross-bridges with mutation R719W (2.5-fold).
With the twofold increase in half-sarcomere stiffness of force generating cross-bridges we next can test whether this observed change in half-sarcomere cross-bridge stiffness can also account for the actually observed increase in isometric force for mutations R719W and R723G. Observed isometric force is proportional to the product of elastic distortion of force generating cross-bridges, y0∗ (Eqs. 2a and 2b) times the stiffness of the mixed population of force generating cross-bridges, i.e., abundance of wild-type cross-bridges times stiffness of wild-type cross-bridges plus abundance of mutant cross-bridges times stiffness of mutant cross-bridges.
For mutation R723G, patient H27, stiffness of the mixed wild-type and mutant force generating cross-bridge population is 0.38 × 19.7 kPa/nm + 0.62 × 37.7 kPa/nm = 30.9 kPa/nm (10°C). The minimum length change per half-sarcomere required to drop active force to zero was 7.7 nm (Table 1). This equals elastic extension of filaments plus elastic extension of cross-bridges. Elastic extension of filaments is filament compliance times active force, i.e., 0.025 nm/kPa × 1.23 × 108.94 kPa = 3.35 nm (10°C; Table 1), yielding 7.7–3.35 = 4.35 nm of average elastic extension of cross-bridges at 10°C. Thus, expected active force is 4.35 nm × 30.9 kPa/nm = 134.4 kPa compared to the observed 1.23 × 108.94 kPa = 133.9 kPa.
For mutation R719W, where also a change in cross-bridge cycling kinetics was observed, the same calculation with a cross-bridge stiffness of the mixed population (54% myosin heads with mutation, 46% wild-type myosin) of 21.4 kPa/nm and a minimum length change per half-sarcomere required to drop active force to zero of 7.66 nm (10°C; Table 2; (10)) predicts 0.025 nm/kPa × 1.59 × 72.6 kPa = 2.89 nm, yielding 7.66–2.89 = 4.77 nm of average elastic extension of cross-bridges at 10°C. Thus, expected active force at 10°C is 4.77 nm × 21.4 kPa/nm = 102.1 kPa compared to the observed 115.4 kPa of mutated fibers (10°C). We have, however, to consider that we attributed a 15% increase in fiber stiffness with mutation R719W to changes in cross-bridge cycling kinetics. Thus, active force is expected to be also increased ∼1.15 times, yielding a total of 1.15 × 102.4 = 117.8 kPa. This essentially equals the observed isometric force for fibers with the R719W mutation.
Thus, the changes in stiffness of the myosin head, estimated from measurements of fiber stiffness can fully account for the observed changes in active force. That active force neither changes in proportion to active fiber stiffness nor in proportion to stiffness of the population of force generating cross-bridges is the result of filament compliance. With increasing active force, filaments are extended more such that elastic distortion of cross-bridges during isometric force generation decreases. As a result, active force, assumed to be generated by the elastic distortion of strongly bound cross-bridges increases less than cross-bridge stiffness.
Even though for mutation I736T no significant effect on any of the measured parameters was observed, a slight increase in rigor stiffness by an average of 12% might indicate some effect of this mutation on S∗. In the soleus biopsies of the two patients with mutation I736T, abundance of mutated myosin heads was found to be 38% (14). If this fraction of mutated myosin and the increase in rigor stiffness is taken into account, stiffness of the individual myosin heads with mutation I736T may have increased ∼1.6-fold (based on the values in Table 1 and filament compliance per half-sarcomere of 0.025 nm/kPa at 10°C (Fig. 5)). This increase apparently is too small to affect Fmax or other parameters of muscle fibers with this mutation beyond detection limit.
To directly test our findings, we have initiated single molecule approaches to see whether the increase in cross-bridge stiffness expected from our fiber studies can be verified, including the difference for force-generating versus rigor cross-bridges. Such experiments will also allow to test the estimates of cross-bridge stiffness in control fibers (Table 3), both in rigor (ca. 0.29 pN/nm, 5°C) and during isometric contraction (ca. 0.28 pN/nm with 66% strongly bound myosin heads, 10°C). These values seem significantly lower than those found in single molecule measurements e.g., by Lewalle et al. (53) for rabbit myosin (2 pN/nm) or by Linari et al. (51) in rabbit psoas muscle fibers (1.7 pN/nm). This discrepancy, however, might be due largely to the myosin isoform studied. For slow myosin of rat at 22°C, values for cross-bridge stiffness of 0.3 pN/nm have been observed in single molecule experiments (54). This number is very similar to the values found here for slow myosin in human M. soleus.
We also calculated the contribution of the cross-bridges (after subtraction of filament compliance) to total half-sarcomere compliance of control fibers (Table 1) that was 0.55 in rigor (0.031 nm/kPa / 0.056 nm/kPa) and 0.67 in isometric contraction (0.052 nm/kPa / 0.078 nm/kPa). Data in Table 2 yield similar ratios. These values seem high compared to values in the literature for fast fibers from rabbit psoas that indicate a contribution of cross-bridge compliance <0.3 in rigor and <0.5 in isometric contraction (51). This most likely is due to the significantly lower cross-bridge stiffness (i.e., higher cross-bridge compliance) observed for the slow myosin isoform (this study and Capitanio et al. (54)) whereas filament compliance of slow and fast muscle fibers is rather similar (49).
As an additional estimate of the fraction of cross-bridges strongly attached to actin during isometric contraction in slow fibers of soleus muscle from control individuals we calculated the ratio of cross-bridge stiffness per half-sarcomere in isometric contraction versus rigor conditions. This yields a ratio of 0.62 ± 0.16 (n = 9) (stiffness of force generating wild-type cross-bridges divided by 31.75 kPa/nm). For the data in Table 2 that were obtained under slightly different conditions the ratio is 0.74 ± 0.16 (n = 14). Both ratios indicate a high fraction of cross-bridges strongly attached to actin in isometrically contracting slow soleus muscle fibers. These ratios, however, are very similar to previous data from x-ray diffraction studies on rabbit psoas muscle fibers at 5°C. On average a fraction of strongly attached cross-bridges in isometric contraction of 0.66 was found (52).
Based on this fraction of strongly bound cross-bridges during isometric steady-state contraction we can estimate from the observed isometric force per cross-sectional area the active force generated per strongly attached myosin head (F∗). If we again consider in a half-sarcomere of a skeletal muscle fiber ∼111 × 103 myosin heads/μm2, then the time averaged contribution of 66% of all heads would yield a force per strongly bound myosin head in control fibers (Table 1) of 1.49 pN at 10°C ((108.9 × 10¹⁵ pN/m2)/(0.66 × 111 × 1015 heads/m2)) and 1.92 pN/myosin head at 20°C (Table 3). Other groups, however, found much smaller fractions of cross-bridges strongly attached to actin in isometric contraction, like 0.30 (51). For such a small fraction, force per myosin head would be >3.2 pN at 10°C and >4.2 pN at 20°C. For rabbit psoas muscle fibers force per attached myosin head was estimated to be ∼4.2 pN at 9°C and 6.6 pN at 19°C (51). However, our data were obtained with human soleus muscle fibers containing only the slow myosin isoform that is thought to generate a lower force per head compared to the fast myosin isoform e.g., in rabbit psoas muscle (51). Over all, these estimates obviously very much depend not only on the conditions of the experiments (temperature, ionic strength, solution composition, etc.) and the assumptions regarding the fraction cross-bridges strongly attached to actin during isometric contraction as well as the values for myosin heads in a half-sarcomere, but quite importantly also depend on the type of myosin studied (slow versus fast isoform).
More relevant to our study, however, is the question of whether and how much active force generated per mutated myosin is affected by the mutations. Compared to the control fibers isometric force generated per cross-sectional area of fibers with mutation R723G increased, on average, 1.23-fold and 1.21-fold at 10°C and 20°C, respectively (Table 1). Assuming that 66% of all myosin heads are strongly attached to actin during isometric force generation, wild-type myosin heads, on average, generate an active force of 1.49 pN at 10°C and 1.92 pN at 20°C. With 62% mutated myosin heads in fibers with mutation R723G (14), force per myosin head with mutation R723G (F∗R723G) is 1.99 pN and 2.56 pN at 10°C and 20°C (Table 3). This is a 1.37- and 1.34-fold increase compared to wild-type myosin heads at 10°C and 20°C, respectively. The same estimate for myosin heads with mutation R719W (isometric force increase 1.59-fold or 1.49-fold at 10°C and 20°C, respectively; see Table 2 and (10)) and considering that ∼1/3 of the force increase is due to changes in cross-bridge cycling kinetics yields 1.77 pN/myosin head and 2.88 pN/myosin head with mutation R719W at 10°C and 20°C, respectively (Table 3). This is a 1.79-fold and a 1.63-fold increase at 10°C and 20°C, respectively.
Based on Eq. 2b (F∗ = S∗ × y0∗) the y0-value for individual mutated and wild-type heads (10°C) can be calculated from stiffness and force per myosin head. For controls and myosin heads with mutation R723G (Table 1), y0 is 5.32 nm and 3.83 nm, respectively (Table 3). For wild-type myosin heads and heads with mutation R719W (Table 2) y0 is 5.14 nm and 4.54 nm, respectively (Table 3). This indicates that y0, i.e., the elastic distortion of myosin heads during force generation, is reduced for the heads with both mutation R719W and R723G.
Implications for HCM
With regard to development of HCM, it is quite striking that both mutations found to significantly increase force and stiffness of the individual myosin heads, R719W and R723G, are associated with a highly malignant phenotype of HCM (31,32). The patient with mutation R719W had a severe hypertrophy and was resuscitated from sudden death followed by cardioverter-defibrillator implantation (31). In general, this mutation is associated with premature death. Affected individuals bearing this mutation have a marked reduction in life expectancy (31). The two patients with R723G mutation suffered from a severe form of the disease with ventricular tachycardia, subsequent cardioverter-defibrillator implantation, and sudden death in the family (32). Additionally, they developed heart failure with wall thinning and systolic dysfunction leading to heart transplantation. In contrast, the two patients with I736T mutation presented with moderate septal hypertrophy and electrocardiogram abnormalities but no conduction disease although they were diagnosed with HCM for >20 years (33). No sudden death was reported in this family.
Previous work from our laboratory provided some hints toward a mechanism that might account for development of HCM and might be common to different HCM mutations even if force generation is enhanced. Studying the effects of three different mutations in the myosin head domain on calcium-sensitivity of a large number of soleus muscle fibers from HCM patients we observed a significant functional variability from fiber to fiber (35). This variability was such that e.g., at a fixed intermediate calcium-concentration force generation of different fibers from one and the same patient with the R723G mutation varied from as low as 30% of maximum isometric force to up to 80% of Fmax. In myocardium, such functional variability among individual muscle cells will cause severe imbalances in force generation as in myocardium the contractile apparatus is only partially Ca2+-activated. Particularly, myocytes arranged in series would be affected by such imbalances in force generation, presumably leading to sarcomere and/or myocyte disarray and finally cardiac dysfunction. The problem of imbalances of force generation might be particularly severe in the case of the considerably larger forces generated by myosin heads with mutations R719W and R723G.
Because forces per myosin head of the slow myosin isoform even with mutation R719W seem to be significantly lower than those of fast myosin isoforms, stability and tensile strength of actin filaments most likely are not relevant factors in the development of HCM. Myocyte hypertrophy, however, despite enhanced generation of isometric force could be triggered by the unusually large forces exerted on strain sensitive structures e.g., proteins in the Z-line or transmembrane receptors, thus activating specific signaling pathways in cells with larger force generation (55,56). Concerning the development of myocyte disarray, we are currently investigating our hypothesis that functional variability among individual cells of the myocardium lead to imbalances of force generation and thus contribute to development of HCM. Imbalances among different cells might actually present a common mechanism for development of HCM even for mutations in sarcomeric proteins other than myosin.
It is worth emphasizing that our hypothesis concerning manifestation of HCM is based on our studies of HCM-related mutations in muscle fibers from HCM patients, i.e., within the natural β-MHC isoform (ventricular myosin isoform) and within the intact contractile apparatus. The importance to study effects of human HCM-related mutations in the human protein isoform was directly demonstrated recently by Lowey and colleagues (57). They showed that effects of mutation R403Q introduced into the mouse-α-MHC were not only different in magnitude but even contrary to the effects of this mutation in mouse-β-MHC. From this it can be concluded that e.g., the discrepancy between enhanced function observed in the mouse model of HCM mutation R403Q versus depressed function found in myosin from HCM patients most likely is due to the different isoforms of myosin under investigation. Likewise, for myosin mutation R719W, different effects have been observed in studies on muscle fibers from patients than seen when the R719W mutation was introduced into different myosin isoforms (10,58,59). Therefore it is unlikely that studies on proteins or tissue other than of human origin will be sufficient to identify primary effects of a particular mutation on human β-cardiac myosin or to clarify mechanisms of HCM-development.
Conclusions
Characterization of several parameters of muscle function revealed that HCM mutations R719W and R723G both are associated with a much larger stiffness and force generation of the individual mutated myosin heads, resulting in reduced elastic distortion of the mutated myosin heads during isometric force generation. Most interestingly, the increase in stiffness of myosin heads with converter mutation R719W and R723G, respectively, indicates that the converter region is an element of the myosin head that contributes major compliance to the acto-myosin cross-bridge. Therefore, in skeletal muscle myosin it is the converter and/or its interactions with closely associated structures such as the essential light chain that will primarily be elastically distorted when force is generated. In addition, the different amino acids found at equivalent positions in other class II myosins suggest that resistance to elastic distortion may be quite different for different myosins.
Acknowledgments
The authors are most grateful to the patients and control individuals for donation of muscle tissue. The work would not have been possible without the support of the clinicians Nana Bit-Avragim and Karl-Josef Osterziel, Charité-Universitätsmedizin Berlin, Germany, and Mirsaid M. Mirrakhimov and Almaz Aldashev, Bishkek, Kyrgyzstan. We also thank Snigdha Tripathi, Molecular and Cell Physiology, for help with sequence alignment and Birgit Piep, Alexander Lingk and Torsten Beier, Molecular and Cell Physiology, Medical School, Hannover, Germany for their expert technical assistance.
This work was supported by grants from the Deutsche Forschungsgemeinschaft to T.K. (KR 1187/5-3.4).
Footnotes
B. Seebohm and F. Matinmehr contributed equally to the work.
References
- 1.Huxley A.F. Muscle structure and theories of contraction. Prog. Biophys. Biophys. Chem. 1957;7:255–318. [PubMed] [Google Scholar]
- 2.Huxley A.F., Simmons R.M. Proposed mechanism of force generation in striated muscle. Nature. 1971;233:533–538. doi: 10.1038/233533a0. [DOI] [PubMed] [Google Scholar]
- 3.Uyeda T.Q., Abramson P.D., Spudich J.A. The neck region of the myosin motor domain acts as a lever arm to generate movement. Proc. Natl. Acad. Sci. USA. 1996;93:4459–4464. doi: 10.1073/pnas.93.9.4459. [DOI] [PMC free article] [PubMed] [Google Scholar]
- 4.Dobbie I., Linari M., Piazzesi G., Reconditi M., Koubassova N. Elastic bending and active tilting of myosin heads during muscle contraction. Nature. 1998;396:383–387. doi: 10.1038/24647. [DOI] [PubMed] [Google Scholar]
- 5.Irving M., Piazzesi G., Lucii L., Sun Y.B., Harford J.J. Conformation of the myosin motor during force generation in skeletal muscle. Nat. Struct. Biol. 2000;7:482–485. doi: 10.1038/75890. [DOI] [PMC free article] [PubMed] [Google Scholar]
- 6.Huxley A.F. Muscular contraction. J. Physiol. 1974;243:1–43. [PMC free article] [PubMed] [Google Scholar]
- 7.Sugi H., Kobayashi T., Gross T., Noguchi K., Karr T. Contraction characteristics and ATPase activity of skeletal muscle fibers in the presence of antibody to myosin subfragment 2. Proc. Natl. Acad. Sci. USA. 1992;89:6134–6137. doi: 10.1073/pnas.89.13.6134. [DOI] [PMC free article] [PubMed] [Google Scholar]
- 8.Seidman J.G., Seidman C. The genetic basis for cardiomyopathy: from mutation identification to mechanistic paradigms. Cell. 2001;104:557–567. doi: 10.1016/s0092-8674(01)00242-2. [DOI] [PubMed] [Google Scholar]
- 9.Elliott P., McKenna W.J. Hypertrophic cardiomyopathy. Lancet. 2004;363:1881–1891. doi: 10.1016/S0140-6736(04)16358-7. [DOI] [PubMed] [Google Scholar]
- 10.Köhler J., Winkler G., Schulte I., Scholz T., McKenna W. Mutation of the myosin converter domain alters cross-bridge elasticity. Proc. Natl. Acad. Sci. USA. 2002;99:3557–3562. doi: 10.1073/pnas.062415899. [DOI] [PMC free article] [PubMed] [Google Scholar]
- 11.Schiaffino S., Reggiani C. Molecular diversity of myofibrillar proteins: gene regulation and functional significance. Physiol. Rev. 1996;76:371–423. doi: 10.1152/physrev.1996.76.2.371. [DOI] [PubMed] [Google Scholar]
- 12.Cuda G., Fananapazir L., Zhu W.S., Sellers J.R., Epstein N.D. Skeletal muscle expression and abnormal function of beta-myosin in hypertrophic cardiomyopathy. J. Clin. Invest. 1993;91:2861–2865. doi: 10.1172/JCI116530. [DOI] [PMC free article] [PubMed] [Google Scholar]
- 13.Nier V., Schultz I., Brenner B., Forssmann W., Raida M. Variability in the ratio of mutant to wildtype myosin heavy chain present in the soleus muscle of patients with familial hypertrophic cardiomyopathy. A new approach for the quantification of mutant to wildtype protein. FEBS Lett. 1999;461:246–252. doi: 10.1016/s0014-5793(99)01433-7. [DOI] [PubMed] [Google Scholar]
- 14.Becker E., Navarro-Lopez F., Francino A., Brenner B., Kraft T. Quantification of mutant versus wild-type myosin in human muscle biopsies using nano-LC/ESI-MS. Anal. Chem. 2007;79:9531–9538. doi: 10.1021/ac701711h. [DOI] [PubMed] [Google Scholar]
- 15.Becker K.D., Gottshall K.R., Hickey R., Perriard J.C., Chien K.R. Point mutations in human beta cardiac myosin heavy chain have differential effects on sarcomeric structure and assembly: an ATP binding site change disrupts both thick and thin filaments, whereas hypertrophic cardiomyopathy mutations display normal assembly. J. Cell Biol. 1997;137:131–140. doi: 10.1083/jcb.137.1.131. [DOI] [PMC free article] [PubMed] [Google Scholar]
- 16.Cooke R., Franks K. All myosin heads form bonds with actin in rigor rabbit skeletal muscle. Biochemistry. 1980;19:2265–2269. doi: 10.1021/bi00551a042. [DOI] [PubMed] [Google Scholar]
- 17.Thomas D.D., Cooke R. Orientation of spin-labeled myosin heads in glycerinated muscle fibers. Biophys. J. 1980;32:891–906. doi: 10.1016/S0006-3495(80)85024-7. [DOI] [PMC free article] [PubMed] [Google Scholar]
- 18.Lovell S.J., Harrington W.F. Measurement of the fraction of myosin heads bound to actin in rabbit skeletal myofibrils in rigor. J. Mol. Biol. 1981;149:659–674. doi: 10.1016/0022-2836(81)90352-1. [DOI] [PubMed] [Google Scholar]
- 19.Brenner B. Effect of Ca2+ on cross-bridge turnover kinetics in skinned single rabbit psoas fibers: implications for regulation of muscle contraction. Proc. Natl. Acad. Sci. USA. 1988;85:3265–3269. doi: 10.1073/pnas.85.9.3265. [DOI] [PMC free article] [PubMed] [Google Scholar]
- 20.Brenner B. Rapid dissociation and reassociation of actomyosin cross-bridges during force generation: a newly observed facet of cross-bridge action in muscle. Proc. Natl. Acad. Sci. USA. 1991;88:10490–10494. doi: 10.1073/pnas.88.23.10490. [DOI] [PMC free article] [PubMed] [Google Scholar]
- 21.Kuhn H.J., Guth K., Drexler B., Berberich W., Ruegg J.C. Investigation of the temperature dependence of the cross bridge parameters for attachment, force generation and detachment as deduced from mechano-chemical studies in glycerinated single fibers from the dorsal longitudinal muscle of Lethocerus maximus. Biophys. Struct. Mech. 1979;6:1–29. doi: 10.1007/BF00537592. [DOI] [PubMed] [Google Scholar]
- 22.Huxley A.F. The activation of striated muscle and its mechanical response. Proc. R. Soc. Lond. B. Biol. Sci. 1971;178:1–27. doi: 10.1098/rspb.1971.0049. [DOI] [PubMed] [Google Scholar]
- 23.Ford L.E., Huxley A.F., Simmons R.M. Tension responses to sudden length change in stimulated frog muscle fibers near slack length. J. Physiol. 1977;269:441–515. doi: 10.1113/jphysiol.1977.sp011911. [DOI] [PMC free article] [PubMed] [Google Scholar]
- 24.Cooke R., White H., Pate E. A model of the release of myosin heads from actin in rapidly contracting muscle fibers. Biophys. J. 1994;66:778–788. doi: 10.1016/s0006-3495(94)80854-9. [DOI] [PMC free article] [PubMed] [Google Scholar]
- 25.Siemankowski R.F., Wiseman M.O., White H.D. ADP dissociation from actomyosin subfragment 1 is sufficiently slow to limit the unloaded shortening velocity in vertebrate muscle. Proc. Natl. Acad. Sci. USA. 1985;82:658–662. doi: 10.1073/pnas.82.3.658. [DOI] [PMC free article] [PubMed] [Google Scholar]
- 26.Nyitrai M., Rossi R., Adamek N., Pellegrino M.A., Bottinelli R. What limits the velocity of fast-skeletal muscle contraction in mammals? J. Mol. Biol. 2006;355:432–442. doi: 10.1016/j.jmb.2005.10.063. [DOI] [PubMed] [Google Scholar]
- 27.Kraft T., Messerli M., Rothen-Rutishauser B., Perriard J.C., Wallimann T. Equilibration and exchange of fluorescently labeled molecules in skinned skeletal muscle fibers visualized by confocal microscopy. Biophys. J. 1995;69:1246–1258. doi: 10.1016/S0006-3495(95)80018-4. [DOI] [PMC free article] [PubMed] [Google Scholar]
- 28.Houdusse A., Kalabokis V.N., Himmel D., Szent-Gyorgyi A.G., Cohen C. Atomic structure of scallop myosin subfragment S1 complexed with MgADP: a novel conformation of the myosin head. Cell. 1999;97:459–470. doi: 10.1016/s0092-8674(00)80756-4. [DOI] [PubMed] [Google Scholar]
- 29.Rayment I., Rypniewski W.R., Schmidt-Base K., Smith R., Tomchick D.R. Three-dimensional structure of myosin subfragment-1: a molecular motor. Science. 1993;261:50–58. doi: 10.1126/science.8316857. [DOI] [PubMed] [Google Scholar]
- 30.Seebohm B., Matinmehr F., Köhler J., Francino A., Navarro-Lopez F. Main cross-bridge elasticity resides in the converter domain of the myosin head: evidence from point mutations in skeletal muscle myosin. Biophys. J. 2007 1421-Pos/B476. (Abstr.) [Google Scholar]
- 31.Anan R., Greve G., Thierfelder L., Watkins H., McKenna W.J. Prognostic implications of novel beta cardiac myosin heavy chain gene mutations that cause familial hypertrophic cardiomyopathy. J. Clin. Invest. 1994;93:280–285. doi: 10.1172/JCI116957. [DOI] [PMC free article] [PubMed] [Google Scholar]
- 32.Enjuto M., Francino A., Navarro-Lopez F., Viles D., Pare J.C. Malignant hypertrophic cardiomyopathy caused by the Arg723Gly mutation in beta-myosin heavy chain gene. J. Mol. Cell. Cardiol. 2000;32:2307–2313. doi: 10.1006/jmcc.2000.1260. [DOI] [PubMed] [Google Scholar]
- 33.Perrot A., Schmidt-Traub H., Hoffmann B., Prager M., Bit-Avragim N. Prevalence of cardiac beta-myosin heavy chain gene mutations in patients with hypertrophic cardiomyopathy. J. Mol. Med. 2005;83:468–477. doi: 10.1007/s00109-005-0635-7. [DOI] [PubMed] [Google Scholar]
- 34.Kraft T., Chalovich J.M., Yu L.C., Brenner B. Parallel inhibition of active force and relaxed fiber stiffness by caldesmon fragments at physiological ionic strength and temperature conditions: additional evidence that weak cross-bridge binding to actin is an essential intermediate for force generation. Biophys. J. 1995;68:2404–2418. doi: 10.1016/S0006-3495(95)80423-6. [DOI] [PMC free article] [PubMed] [Google Scholar]
- 35.Kirschner S.E., Becker E., Antognozzi M., Kubis H.P., Francino A. Hypertrophic cardiomyopathy-related beta-myosin mutations cause highly variable calcium sensitivity with functional imbalances among individual muscle cells. Am. J. Physiol. Heart Circ. Physiol. 2005;288:H1242–H1251. doi: 10.1152/ajpheart.00686.2004. [DOI] [PubMed] [Google Scholar]
- 36.Yu L.C., Brenner B. Structures of actomyosin crossbridges in relaxed and rigor muscle fibers. Biophys. J. 1989;55:441–453. doi: 10.1016/S0006-3495(89)82838-3. [DOI] [PMC free article] [PubMed] [Google Scholar]
- 37.Brenner B., Eisenberg E. Rate of force generation in muscle: correlation with actomyosin ATPase activity in solution. Proc. Natl. Acad. Sci. USA. 1986;83:3542–3546. doi: 10.1073/pnas.83.10.3542. [DOI] [PMC free article] [PubMed] [Google Scholar]
- 38.Kraft T., Brenner B. Force enhancement without changes in cross-bridge turnover kinetics: the effect of EMD 57033. Biophys. J. 1997;72:272–281. doi: 10.1016/S0006-3495(97)78666-1. [DOI] [PMC free article] [PubMed] [Google Scholar]
- 39.Hill A.V. First and Last Experiments in Muscle Mechanics. In: Sugi H., editor. Cambridge University Press; Cambridge, UK: 1970. pp. 33–70. [Google Scholar]
- 40.Edman K.A. The velocity of unloaded shortening and its relation to sarcomere length and isometric force in vertebrate muscle fibers. J. Physiol. 1979;291:143–159. doi: 10.1113/jphysiol.1979.sp012804. [DOI] [PMC free article] [PubMed] [Google Scholar]
- 41.Brenner B. Muscle Mechanics II: Skinned Muscle Fibers. In: Sugi H., editor. Oxford University Press; Oxford, UK: 1998. pp. 33–69. [Google Scholar]
- 42.Kubis H.P., Gros G. A rapid electrophoretic method for separating rabbit skeletal muscle myosin heavy chains at high resolution. Electrophoresis. 1997;18:64–66. doi: 10.1002/elps.1150180113. [DOI] [PubMed] [Google Scholar]
- 43.Brenner B., Chalovich J.M., Greene L.E., Eisenberg E., Schoenberg M. Stiffness of skinned rabbit psoas fibers in MgATP and MgPPi solution. Biophys. J. 1986;50:685–691. doi: 10.1016/S0006-3495(86)83509-3. [DOI] [PMC free article] [PubMed] [Google Scholar]
- 44.Brenner B. Muscle mechanics and biochemical kinetics. In: Squire J.M., editor. Molecular Mechanism of Muscular Contraction. Macmillan; London: 1990. pp. 77–149. [Google Scholar]
- 45.Burgess S., Walker M., Wang F., Sellers J.R., White H.D. The prepower stroke conformation of myosin V. J. Cell Biol. 2002;159:983–991. doi: 10.1083/jcb.200208172. [DOI] [PMC free article] [PubMed] [Google Scholar]
- 46.Kraft T., Tripathi S., Becker E., Seebohm B., Kirschner S. Point mutations of the myosin head domain in Familial Hypertrophic Cardiomyopathy (fHCM). Functional effects in relation to abundance of mutated protein and mRNA. Acta. Physiologica. 2006;650 OT09–49. [Google Scholar]
- 47.Brenner B., Yu L.C., Chalovich J.M. Parallel inhibition of active force and relaxed fiber stiffness in skeletal muscle by caldesmon: implications for the pathway to force generation. Proc. Natl. Acad. Sci. USA. 1991;88:5739–5743. doi: 10.1073/pnas.88.13.5739. [DOI] [PMC free article] [PubMed] [Google Scholar]
- 48.Kraft T., Schnekenbühl S., Messerli M., Yu L.C., Chalovich J.M. Activation of skinned skeletal muscle fibers by N-ethylmaleimide-modified-S1 versus calcium-activation. Biophys. J. 1993;64:346a. [Google Scholar]
- 49.Linari M., Bottinelli R., Pellegrino M.A., Reconditi M., Reggiani C. The mechanism of the force response to stretch in human skinned muscle fibers with different myosin isoforms. J. Physiol. 2004;554:335–352. doi: 10.1113/jphysiol.2003.051748. [DOI] [PMC free article] [PubMed] [Google Scholar]
- 50.Ferenczi M.A., Homsher E., Trentham D.R. The kinetics of magnesium adenosine triphosphate cleavage in skinned muscle fibers of the rabbit. J. Physiol. 1984;352:575–599. doi: 10.1113/jphysiol.1984.sp015311. [DOI] [PMC free article] [PubMed] [Google Scholar]
- 51.Linari M., Caremani M., Piperio C., Brandt P., Lombardi V. Stiffness and fraction of myosin motors responsible for active force in permeabilized muscle fibers from rabbit psoas. Biophys. J. 2007;92:2476–2490. doi: 10.1529/biophysj.106.099549. [DOI] [PMC free article] [PubMed] [Google Scholar]
- 52.Kraft T., Mattei T., Radocaj A., Piep B., Nocula C. Structural features of cross-bridges in isometrically contracting skeletal muscle. Biophys. J. 2002;82:2536–2547. doi: 10.1016/S0006-3495(02)75597-5. [DOI] [PMC free article] [PubMed] [Google Scholar]
- 53.Lewalle A., Steffen W., Stevenson O., Ouyang Z., Sleep J. Single-molecule measurement of the stiffness of the rigor myosin head. Biophys. J. 2008;94:2160–2169. doi: 10.1529/biophysj.107.119396. [DOI] [PMC free article] [PubMed] [Google Scholar]
- 54.Capitanio M., Canepari M., Cacciafesta P., Lombardi V., Cicchi R. Two independent mechanical events in the interaction cycle of skeletal muscle myosin with actin. Proc. Natl. Acad. Sci. USA. 2006;103:87–92. doi: 10.1073/pnas.0506830102. [DOI] [PMC free article] [PubMed] [Google Scholar]
- 55.Knöll R., Hoshijima M., Hoffman H.M., Person V., Lorenzen-Schmidt I. The cardiac mechanical stretch sensor machinery involves a Z disc complex that is defective in a subset of human dilated cardiomyopathy. Cell. 2002;111:943–955. doi: 10.1016/s0092-8674(02)01226-6. [DOI] [PubMed] [Google Scholar]
- 56.Brancaccio M., Fratta L., Notte A., Hirsch E., Poulet R. Melusin, a muscle-specific integrin beta1-interacting protein, is required to prevent cardiac failure in response to chronic pressure overload. Nat. Med. 2003;9:68–75. doi: 10.1038/nm805. [DOI] [PubMed] [Google Scholar]
- 57.Lowey S., Lesko L.M., Rovner A.S., Hodges A.R., White S.L. Functional effects of the hypertrophic cardiomyopathy R403Q mutation are different in an alpha- or beta-myosin heavy chain backbone. J. Biol. Chem. 2008;283:20579–20589. doi: 10.1074/jbc.M800554200. [DOI] [PMC free article] [PubMed] [Google Scholar]
- 58.Fujita H., Sugiura S., Momomura S., Omata M., Sugi H. Characterization of mutant myosins of Dictyostelium discoideum equivalent to human familial hypertrophic cardiomyopathy mutants. Molecular force level of mutant myosins may have a prognostic implication. J. Clin. Invest. 1997;99:1010–1015. doi: 10.1172/JCI119228. [DOI] [PMC free article] [PubMed] [Google Scholar]
- 59.Yamashita H., Tyska M.J., Warshaw D.M., Lowey S., Trybus K.M. Functional consequences of mutations in the smooth muscle myosin heavy chain at sites implicated in familial hypertrophic cardiomyopathy. J. Biol. Chem. 2000;275:28045–28052. doi: 10.1074/jbc.M005485200. [DOI] [PubMed] [Google Scholar]
- 60.Brenner B. Technique for stabilizing the striation pattern in maximally calcium-activated skinned rabbit psoas fibers. Biophys. J. 1983;41:99–102. doi: 10.1016/S0006-3495(83)84411-7. [DOI] [PMC free article] [PubMed] [Google Scholar]