

Abstract
The impact of sulphur limitation on the remobilization of endogenous S compounds during the rosette stage of oilseed rape, and the interactions with N availability on these processes, were examined using a long-term 34SO42− labelling method combined with a study of leaf senescence progression (using SAG12/Cab as a molecular indicator) and gene expression of the transporters, BnSultr4;1 and BnSultr4;2, involved in vacuolar sulphate efflux. After 51 d on hydroponic culture at 0.3 mM 34SO42− (1 atom% excess), the labelling was stopped and plants were subject for 28 d to High S-High N (HS-HN, control), Low S-High N (LS-HN) or Low S-Low N (LS-LN) conditions. Compared with the control, LS-HN plants showed delayed leaf senescence and, whilst the shoot growth and the foliar soluble protein amounts were not affected, S, 34S, and SO42− amounts in the old leaves declined rapidly and were associated with the up-regulation of BnSultr4;1. In LS-LN plants, shoot growth was reduced, leaf senescence was accelerated, and the rapid S mobilization in old leaves was accompanied by decreased 34S and SO42−, higher protein mobilization, and up-regulation of BnSultr4;2, but without any change of expression of BnSultr4;1. The data suggest that to sustain the S demand for growth under S restriction (i) vacuolar SO42− is specifically remobilized in LS-HN conditions without any acceleration of leaf senescence, (ii) SO42− mobilization is related to an up-regulation of BnSultr4;1 and/or BnSultr4;2 expression, and (iii) the relationship between sulphate mobilization and up-regulation of expression of BnSultr4 genes is specifically dependent on the N availability.
Keywords: Brassica napus, Group 4 sulphate transporters, leaf senescence, S compounds recycling, 34SO42− labelling, sulphur limitation
Introduction
Sulphur (S) is an essential macroelement for crops worldwide, available to plants mainly as sulphate (SO42−) in the soil and as sulphur dioxide in the atmosphere. The decline of industrial emissions and the subsequent deposition of S on agricultural land that has occurred for about 20 years has increased the risk of S-depletion of soils with concomitant reductions of agronomic performances for many crops. As with other plants of the Brassica family, oilseed rape (Brassica napus L.) is particularly demanding for S (McGrath and Zhao, 1996), and is very sensitive to S deprivation, with consequences for seed quality and yield (Janzen and Bettany, 1984; Scherer, 2001). S deficiency also influences the lipid and protein composition of seeds, impacting on nutritional quality. In response to a limitation of sulphur supply, the hypothetical initial plant responses involve an optimization of uptake and utilization of sulphate, accompanied by an increase in remobilization of S reserves from vegetative tissues and their subsequent redistribution towards growing tissues (Hawkesford and De Kok, 2006).
The impacts of S deprivation on seed quality and yield have been shown to depend on N supply (Janzen and Bettany, 1984). In addition, S availability may influence N use efficiency (NUE) of oilseed rape and vice versa (Schnug et al., 1993; Fismes et al., 2000), indicating that mineral S and N availabilities closely interact with S and N management by the plant (Kopriva and Rennenberg, 2004). In Arabidopsis thaliana, the plant model which has a particular relevance for Brassica, recent studies at metabolome and transcriptome levels have confirmed that S deprivation leads to modified S and N metabolism. For example, Nikiforova et al. (2004, 2005) have shown a significant disruption of N metabolism in response to S deficiency leading to nitrate, serine, tryptophan, and O-acetyl serine (OAS) accumulation, whereas cysteine, S-adenosyl methionine (SAM), and glutathione contents decreased. Cysteine, the final product of the reductive assimilation of S, and the result of the incorporation of sulphide with OAS by the cysteine-synthase complex, is the convergent point of N and S metabolism. Numerous genes are regulated in response to S deficiency (Hirai et al., 2003, 2004, 2005; Maruyama-Nakashita et al., 2003; Nikiforova et al., 2003) and among these genes, the steady-state levels of transcripts for sulphate transporters, ATP sulphurylase, 5′-adenylphosphosulphate (APS) sulphotransferase, and nitrilase increased in response to S starvation. In addition, it was shown that S deficiency down-regulated the expression of nitrate reductase and plastid glutamine synthase genes in Nicotiana tabacum (Migge et al., 2000). Moreover, in Brassica, a decrease of sulphate availability resulted in an increase in abundance of several sulphate transporter transcript levels (Buchner et al., 2004; Parmar et al., 2007). An up-regulation of group 1 transporters (high affinity type, see Hawkesford, 2003) in response to S deprivation was observed, particularly in the young leaves, whilst there was no induction in old leaves. By contrast, expression of Sultr4;1 a gene encoding a group 4 sulphate transporter involved in the efflux of sulphate from the vacuole in Arabidopsis thaliana (Kataoka et al., 2004), was up-regulated only in middle-aged leaves of Brassica napus (Parmar et al., 2007). The increase of gene expression as observed in response to S limitation suggests a mechanism of adaptation facilitating the utilization of stored S reserves. Kataoka et al. (2004) suggested that the SULTR4;1 transporter substantially prevented excessive accumulation of sulphate in the vacuoles of root xylem parenchyma cells, while the second isoform, SULTR4;2, was suggested to have a similar but supplementary function. In seedlings of Arabidopsis thaliana, the supplied sulphate was retained in the root tissue of the sultr4;1 sultr4;2 double knockout mutant (Kataoka et al., 2004). These authors suggested that SULTR4-type transporters, particularly SULTR4;1, actively mediate the efflux of sulphate from the vacuole lumen into the cytoplasm. In oilseed rape, Parmar et al. (2007) also reported that in response to S deprivation, expression of SULTR4-group transporters is induced in roots and in leaves, which is concomitant with a decrease in the respective sulphate concentrations. In leaves, a marked increased mRNA abundance of BSultr4;2 was observed initially mainly in the young leaves, and finally in the older leaves, while the BSultr4;1 induction took place in mature and old leaves (Parmar et al. 2007). The mobilization of sulphate from the vacuole to fulfil growth S requirements has been reported to be a slow process in mature leaves of oilseed rape (Blake-Kalff et al., 1998; Hawkesford, 2000) except in the case of S limitation. The dependency of mobilization of the vacuolar sulphate on the up-regulation of Sultr4;1 and Sultr4;2 is still to be verified.
In oilseed rape, leaves represent a major store of nutrients for growing tissues which may be remobilized, potentially mediated by senescence processes. The leaves appearing during the rosette stage play a crucial role in recycling foliar compounds to sustain seed filling during the reproductive stage and therefore contribute to the maintenance of the grain yield of oilseed rape. For instance, Noquet et al. (2004) have reported that the ablation of 50% of the rosette leaves present at the beginning of the reproductive stage (i.e. bolting stage) results in a 30% decrease of the seed yield in oilseed rape. Under field conditions, the rosette stage is a vegetative period of the ontogenic cycle where the availability of mineral S would be determined by soil S availability and winter rainfall patterns. Therefore, in the absence of additional S fertilization, oilseed rape may be dependent on early S acquisition and the consequent S reserves accumulating in the leaves at the vegetative stages, along with a capacity to remobilize these reserves and other endogenous S compounds efficiently in order to sustain the growth of young tissues at later stages of development.
Sunarpi and Anderson (1997a, b) have reported that the response of soybean (Glycine max) to S deficiency, in terms of the remobilization of S compounds stored in leaves, was influenced by mineral N availability. Low levels of N nutrition promoted the loss of S from mature leaves to the benefit of the developing leaves, while high levels of nitrate inhibited this process. These data suggested that mineral N availability must be taken into account when monitoring the responses of plants to S deficiency. In oilseed rape, Blake-Kalff et al. (1998) reported that under optimal S supply, 70–90% of the total S in the middle and oldest leaves accumulated as sulphate, whereas glutathione and glucosinolates accounted for less than 1% of the total S. These authors demonstrated that the major sources of S during S deficiency would be sulphate reserves and existing proteins. Plants grown on nutrient solution containing low S and low N showed fewer deficiency symptoms than plants grown on solutions containing low S and high N; this effect of mineral N availability was largely explained by differences in growth rate (Blake-Kalff et al., 1998). In spite of these observations, in oilseed rape, there have been few published studies to determine if the S remobilization observed in response to sulphate deficiency (i) is related to the enhancement of leaf senescence processes as classically observed in the case of mineral N deficiency (Smart et al., 1995; Gombert et al., 2006; Lim et al., 2007) and (ii) differs as a function of mineral N availability.
The main target of the present study was to determine the impact of reduced sulphate supply, combined with variable nitrate availability, on S remobilization from expanding to older leaves, previously suggested to export large amount of S, at the rosette stage (Parmar et al., 2007). The impact of sulphate supply on S mobilization and leaf senescence in Low S-High N (LS-HN) conditions was compared to High S-High N (HS-HN) and to Low S-Low N (LS-LN). The two key variables were the level of S (between HS-HN and LS-HN) and the level of N associated with the limitation in S (between LS-HN and LS-LN). To evaluate the level of S remobilization from expanding and older leaves, a method was developed for long-term steady-state 34S−SO42− pulse-labelling, consisting of a 34S−SO42− application at the beginning of vegetative development for a period of 51 d, allowing analysis of the dynamics of the mobilization of S compounds during the following chase period of 28 d. This type of homogeneous labelling added additional resolution to previous studies by 35S pulse-chase, for instance in soybean (Sunarpi and Anderson, 1997a, b). In addition, to verify whether S recycling in response to S deficiency is associated with foliar senescence processes, leaf senescence progression was determined with a molecular indicator of leaf senescence status (SAG12/Cab), which was developed by Gombert et al. (2006) and Etienne et al. (2007) for oilseed rape. As sulphate is mainly stored in the vacuole and this represents the most important source of S in leaves of oilseed rape (Blake-Kalff et al., 1998), the survey of S redistribution was combined with a study of the expression levels of the BnSultr4;1 and BnSultr4;2 genes, which encode the sulphate transporters involved in the efflux of sulphate from the vacuole (Kataoka et al., 2004).
Materials and methods
Plant culture and applications of restricted S and N supply
Seeds of Brassica napus L. cv. Capitol were sterilized with 80% ethanol for 30 s followed by treatment with 20% sodium hypochlorite for 20 min and several washes in demineralized water. The seeds were germinated and grown in hydroponic solution under greenhouse conditions: fourteen 5-d-old seedlings were transplanted under hydroponic conditions into a 20 l plastic tank. The aerated nutrient solution contained 0.40 mM KH2PO4, 2.0 mM KCl, 3.0 mM CaCl2, 0.15 mM K2HPO4, 0.2 mM Fe-Na EDTA, 14 μM H3BO3, 5.0 μM MnSO4, 3.0 μM ZnSO4, 0.7 μM CuSO4, 0.7 μM (NH4)6Mo7O24, 0.1 μM CoCl2, and was renewed every 7 d. This solution was supplied with 1 mM KNO3, 0.3 mM MgSO4 two times per week to maintain concentrations at 1 mM nitrate and 0.3 mM sulphate. During this period of growth (51 d), plants were supplied with 34SO42− (1 atom% excess) in order to obtain plants with homogeneous 34S labelling. Afterwards, the plants were isolated (one plant per tank) and cultivated for the chase period in a 4 l tank of the aerated nutrient solution without the addition of 34SO42−. Three different levels of mineral S or N were applied for 28 d: 0.3 mM MgSO4, 1 mM KNO3 corresponding to the HS-HN treatment (i.e. control plants); 15 μM MgSO4, 1 mM KNO3 corresponding to the LS-HN treatment; and, 15 μM MgSO4, 250 μM KNO3 corresponding to the LS-LN treatment. These nutrient solutions were renewed every 7 d. During the whole experiment, the natural light was supplemented with green power Philips lamps (400 μmol m−2 s−1 of photosynthetically active radiation at the canopy) for 16 h d−1. The thermoperiod was 20 °C (day) and 15 °C (night).
Tissue sampling
Four plants of each of the three treatments (HS-HN, LS-HN, and LS-LN plants) were harvested every week and separated into the whole root system, the stem, the petiole, and the leaf blade of leaves, after the determination of the relative chlorophyll concentration using the non-destructive SPAD (Soil Plant Analysis Development) chlorophyll meter (Minolta, SPAD-502 model). Each data point represents the average of eight independent measurements for each leaf. One subsample of each plant fraction was weighed, freeze-dried, reweighed for dry weight determination, and then ground to a fine powder for S and N analyses. Other subsamples were immediately frozen in liquid nitrogen after harvest and then stored at –80 °C for subsequent RNA, protein, and sulphate extractions.
S, 34S, and N analysis
Samples were freeze-dried, weighed, and placed into tin analysis capsules. Both total S and N contents in the plant samples were determined with a continuous flow isotope mass spectrometer (Isoprime, GV Instruments, Manchester, UK) linked to an analyser (EA3000, EuroVector, Milan, Italy). For each sample, the δ34S were collected and data were normalized using V-CDT an internationally accepted isotope standard for S analysis. Stable isotope abundance (A) was calculated with the δ34S as follows:
 |
To determine the 34S amount in excess, the natural isotope abundance of 4.2549% was withdrawn to the value of A before the multiplication by the DW of the leaf blade.
Soluble proteins and sulphate extraction and quantification
Soluble proteins were extracted from 200 mg FW of frozen leaf blade samples, mechanically crushed with 500 μl of citrate Na-phosphate buffer (20 mM citrate and 160 mM Na2HPO4, pH 6.8). The homogenate was centrifuged at 12 000 g, 4 °C for 1 h and the resulting supernatant was used to determine the concentration in soluble proteins by protein–dye staining (Bradford, 1976), using bovine serum albumin (BSA) as standard, with three replications for each sample.
Sulphate was extracted from 45 mg DW of leaf blade samples, mechanically crushed by two successive incubations with 2 ml of ethanol 50%, at 45 °C for 1 h, centrifuged at 10 000 g for 20 min and two incubations with water, at 95 °C for 1 h, centrifuged at 10 000 g for 20 min. The supernatants were pooled and evaporated under vacuum (Concentrator Evaporator RC 10.22, Jouan, Saint-Herblain, France). The dry residue was resuspended in 2 ml of ultra-pure water and the sulphate concentration was determined by high performance liquid chromatography (HPLC, ICS3000, Dionex Corp., Sunnyvale, CA, USA).
RNA extraction
Total RNA was extracted from 200 mg of leaf blade fresh matter. Frozen samples were ground to a powder with a pestle in a mortar containing liquid nitrogen. The resulting powder was suspended in 750 μl extraction buffer (0.1 M TRIS, 0.1 M LiCl, 0.01 M EDTA, 1% SDS (w/v), pH 8) and 750 μl of hot phenol (80 °C, pH 4). This mixture was vortexed for 30 s and, after addition of 750 μl of chloroform/isoamylalcohol (24:1), the homogenate was centrifuged at 15 000 g (5 min, 4 °C). The supernatant was transferred into 4 M LiCl solution (w/v) and incubated overnight at 4 °C. After centrifugation (15 000 g, 30 min, 4 °C), the pellet was suspended in 250 μl of sterile water. Fifty microlitres of 3 M sodium acetate (pH 5.6) and 1 ml of 96% ethanol were added to precipitate the total RNA for 1 h at –80 °C. After centrifugation (15 000 g, 20 min, 4 °C), the pellet was washed with 1 ml of 70% ethanol, then centrifuged at 15 000 g for 5 min at 4 °C. The resulting pellet was dried for 5 min at room temperature and resuspended in sterile water containing 0.1% SDS and 20 mM EDTA. Quantification of total RNA was performed by spectrophotometer at 260 nm (BioPhotometer, Eppendorf, Le Pecq, France) before Reverse Transcription (RT), semi-quantitative, and quantitative PCR (Q-PCR) analyses.
Reverse transcription (RT) and semi-quantitative PCR analysis
For RT, 1 μg of total RNA was converted to cDNA with an ‘iScript cDNA synthesis kit’ according to the manufacturer's protocol (Bio-Rad, Marne-la-Coquette, France). PCRs were obtained using specific primers for Brassica napus CabLHB1B2 gene (Accession no: DQ355993) (forward primer: 5′-GGCAGCCCATGGTACGGATC-3′ and reverse primer 5′-CCTCCITCGCTGAAGATCTGT-3′), and primers shared by SAG12-1 (Accession no: AF089848) and SAG12-2 (Accession no: AF089849) genes of Brassica napus (forward primer: 5′-GGCAGTGGCACACCAMCCGGTTAG-3′ and reverse primer: 5′-AGAAGCMTTCATGGCAAGACCAC-3′). EF1-α gene (Accession no: DQ312264), was used as an internal control gene (Nicot et al., 2005; Etienne et al., 2007) and was amplified using forward primer: 5′-TTTCGAGGGTGACAACATGA-3′ and reverse primer 5′-CCGTTCCAATACCACCAATC-3′. PCRs were performed with Qbiogene Taq polymerase (MP Biomedicals, Illkirch, France) according to the manufacturer's protocol. The amplification programme was: 1 cycle at 95 °C for 5 min, 20 (Cab), 24 (SAG12) or 28 (EF1-α) cycles including a denaturing step at 95 °C for 45 s, a primer's hybridization step at 58 °C for 45 s, and an amplification step at 72 °C for 1 min. Each PCR reaction was ended with one cycle at 72 °C for 10 min. Three single 267, 161, and 164 bp cDNAs were amplified for SAG12, Cab, and EF1-α genes, respectively, and the identity of each fragment was checked by sequencing (Biofidal, Vaulx-en-Velin, France). For all RT-PCR reactions, the EF1-α gene was used as the cDNA synthesis and amplification control (Nicot et al., 2005; Etienne et al., 2007). PCR products were separated by electrophoresis through a 1% agarose gel. The steady-state level of transcripts was estimated by measurement of signal intensities using Biocapt software (Vilber Lourmat, Marne-La-Vallée, France) after normalization with the EF1-α gene. From each sample, three RT reactions were made, followed by two independent PCRs, and the corresponding data did not show significant variation of the steady-state transcript level, indicating that the PCR method was reproducible.
Study of leaf senescence progression using SAG12/Cab indicator
The rate of senescence progression was studied using the method developed by Gombert et al. (2006). Every week, for each plant, SAG12 and Cab gene expression levels were followed as a function of leaf rank, where the SAG12 and Cab gene expression levels were expressed as a percentage of the maximum of both transcripts obtained in overall leaf ranks studied during the experiment (see Supplementary Fig. S1 at JXB online). According to Gombert et al. (2006), the last theoretical senescent leaf rank was determined at the intersection point corresponding to the concomitant up- and down-regulation of SAG12 and Cab genes. The maximal and minimal values of the intersection point were determined geometrically, using the extreme values of SAG12 and Cab gene expression levels (see Supplementary Fig. S1 at JXB online). Analysis was first performed on leaf ranks nos 6, 8, 10, and 12 for each date of harvest and on leaf ranks nos 7 and 9 when necessary. Thereafter, changes of these theoretical leaf ranks were expressed as a function of time and the corresponding values presented a linear relationship, where the value of the slope indicates the rate of the leaf senescence progression in response to treatments.
Relative expression of BnSultr4 and BnSultr1 genes using Q-PCR
For Q-PCR amplification, primers of BnSultr4 encoding vacuolar sulphate transporters in Brassica napus were designed from the BnSultr4;1 sequence (Accession no: AJ416461), and from the BnSultr4;2 sequence (Accession no: AJ555124). The BnSultr4;2 sequence amplified corresponds to Accession no: FJ688133. Q-PCR amplifications were performed by using BnSultr4;1 forward primer: 5′-GACCAGACCCGTTAAGGTCA-3′ and reverse primer: 5′-TTGGAATCCATGTGAAGCAA-3′, BnSultr4;2 forward primer: 5′-AGCAAGATCAGGGATTGTGG-3′ and reverse primer: 5′-TGCAACATTTGTGGGTGTCT-3′, BnSultr1;1 forward primer: 5′-AGATATTGCGATCGGACCAG-3′ and reverse primer: 5′-GAAAACGCCAGCAAAGAAAG-3′, and BnSultr1;2 forward primer: 5′-GGTGTAGTCGCTGGAATGGT-3′ and reverse primer: 5′-AACGGAGTGAGGAAGAGCAA-3′. As indicated for semi-quantitative PCR analysis, EF1-α gene (Accession no: DQ312264), was used as an internal control gene and was amplified using the primers described above. Q-PCR reactions were performed with 4 μl of 100× diluted cDNA, 500 nM of primers, and 1× SYBR Green PCR Master Mix (Bio-Rad) in a ChromoFour System (Bio-Rad). For each pair of primers, a threshold value and PCR efficiency have been determined using a cDNA preparation diluted over 10-fold. For both pairs of primers, PCR efficiency was around 100%. The specificity of PCR amplification was examined by monitoring the presence of the single peak in the melting curves after Q-PCR reactions and by sequencing the Q-PCR product to confirm that the correct amplicons were produced from each pair of primers (Biofidal). In addition, BLASTN analysis (www.ncbi.nlm.nih.gov/blast/Blast.cgi) was performed in order to check the correct amplification of the target cDNA, BnSultr4;1 and BnSultr4;2. For each sample, the subsequent Q-PCR reactions were performed in triplicate and the relative expression of the BnSultr4 transporters in each sample was compared to the control sample (corresponding to control plants (HS-HN) at day 7) and was determined with the ΔΔCt method using the following equation:
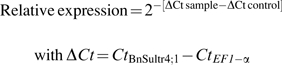 |
where Ct refers to the threshold cycle determined for each gene in the exponential phase of PCR amplification. Using this analysis method, relative expression of the BnSultr4;1 gene in the control sample was equal to one (20), by definition (Livak and Schmittgen, 2001).
Statistics
The normality of the data was studied with the Ryan–Joiner test at 95%. Analysis of variance (ANOVA) and the Tukey test to compare the means were performed using MINITAB13 on ‘Windows’ (Minitab Inc, State College, PA, USA). When the normality law of data was not respected, the non-parametric test of Kruskal–Wallis was done. Statistical significance was postulated at P <0.05.
Results
Effects of limited sulphate supply on shoot growth in the presence and absence of nitrate limitation
The dynamics of shoot fresh biomass production in control (HS-HN) and LS-HN plants were similar and biomass increased during the experiment (Fig. 1A). Compared to the control, the LS-LN treatment showed significantly reduced shoot fresh biomass production after 14 d of treatment. After 28 d of experiment, the shoot fresh matter production reached 69.2 g plant−1 in the LS-LN plants while it was 112.9 g plant−1 in the control conditions (Fig. 1A).
Fig. 1.

Changes in fresh matter of oilseed rape shoots (A) and in dry matter of the leaf blade of the younger leaves (B1) and of leaf ranks 12 (B2), 10 (B3), and 8 (B4) of oilseed rape in control plants (HS-HN), sulphate-limited plants (LS-HN), and combined sulphate- and nitrate-limited plants (LS-LN) for the 28 d of treatments. Vertical bars indicate ±SE of the mean (n=4) when larger than the symbol. Different letters indicate that mean values are significantly different at a given date (P <0.05).
The dry biomass of leaf blade in leaves at different nodal positions (i.e. at contrasting stages of leaf development) was monitored in response to different mineral S and N treatments (Fig. 1B). Whatever the treatment, the biomass of the leaf blade of expanding leaves (young leaves and expanding leaf ranks 10 and 12; Fig. 1B1, B2, B3) increased throughout the experiment, while the biomass of the older leaf blade (leaf rank 8; Fig. 1B4) was maintained at around 1.5 g. However, in response to the LS-LN treatment, the biomass of expanding leaves was always lower than the control and the LS-HN plants. For example at day 28, the dry matter of LS-LN young leaves was about 7-fold lower than the control (Fig. 1B1).
Effects of limited sulphate supply on leaf senescence progression in the presence and absence of nitrate limitation
For each leaf rank, the expression of SAG12 and Cab genes (up- and down-regulated during the senescence process, respectively) was monitored by semi-quantitative RT-PCR (data not shown) in order to determine the theoretical date of the onset of foliar senescence (Gombert et al., 2006; Etienne et al., 2007; for details see the Materials and methods section). For each treatment, the leaf senescence progression was determined by the derivative of the linear equation indicating leaf rank senescence as a function of time (Fig. 2). In control plants, the senescence progressed by 0.19 leaf ranks per day throughout the experiment (Fig. 2). Between 0 d and 14 d, the progression of leaf senescence in response to LS-HN and LS-LN treatment was not significantly different from the control (data not shown). By contrast, after day 14, sulphate limitation affected the progression of leaf senescence differentially according to nitrate availability (Fig. 2). Compared with the control, the progression of leaf senescence was 1.4-fold lower in LS-HN and 2.3-fold higher in LS-LN plants. Using the corresponding equation given in Fig. 2, it was possible to determine the theoretical date of the commencement of senescence for a given leaf rank in order to evaluate the impact of the treatment on leaf development. Thus, in the older leaves, such as leaf rank 8, which were likely to export S reserves during the experiment, the theoretical date of the commencement of senescence was determined at day 18, 19, and 16, for control, LS-HN, and LS-LN plants, respectively (Fig. 2). By contrast, senescence in leaf rank 10, which was a young expanding leaf at the start of the treatment and became a fully expanded leaf by the end of the experiment, was determined at day 28 for control, day 34 for LS-HN, and day 23 for LS-LN plants (Fig. 2).
Fig. 2.

Kinetics of the progression of leaf senescence along the axis of oilseed rape (A) in control plants (HS-HN), sulphate-limited plants (LS-HN), and in combined sulphate- and nitrate-limited plants (LS-LN). For a given date, each value refers to the theoretical nodal position of the last leaf rank subjected to senescence (i.e. displaying SAG12 up-regulation and Cab down-regulation, concomitantly, in the leaf blade). Other details as for Fig. 1. Photography of old leaf (leaf rank 8) in combined sulphate- and nitrate-limited plants (LS-LN), control plants (HS-HN), and sulphate limited plants (LS-HN) (B).
The effects of limited S supply applied with or without N limitation on senescence progression were confirmed by the changes of the chlorophyll concentrations (Fig. 3). In the leaf blade of an old leaf (rank no. 8) from control plants, the chlorophyll concentration decreased after 21 d to reach a minimum value of 18.3 SPAD units after 28 d (Fig. 3A). In LS-HN treatment, the chlorophyll concentration of old leaves was similar to the control. Compared to both other treatments, the chlorophyll concentration in the old leaves of LS-LN plants started to decrease between 14 d and 21 d and was significantly affected by day 21. In the expanding leaf no. 10 from control plants (Fig. 3B), the chlorophyll concentration decreased after 21 d to reach a minimum value of 43 SPAD units after 28 d. During the experiment the changes of chlorophyll concentration in the expanding leaves of LS-LN plants were similar to the control. In the LS-HN treatment, the chlorophyll concentration of the expanding leaves was maintained at a value higher than 50 SPAD units throughout the experiment (Fig. 3B). The chlorophyll concentration in the expanding leaf of LS-LN plants was not affected before day 28, compared to the control, but was lower than for LS-HN plants.
Fig. 3.

Changes in the chlorophyll (SPAD) of the leaf ranks 8 (A) and 10 (B) of oilseed rape in control plants (HS-HN), sulphate-limited plants (LS-HN), and in combined sulphate- and nitrate-limited plants (LS-LN) for 28 d of treatments. Vertical arrows indicate the date of the theoretical onset of leaf senescence as described in Materials and methods. HS-HN, black arrow; LS-HN, grey arrow; LS-LN, white arrow. Other details as for Fig. 1.
Effects of limited sulphate supply on leaf N and S composition in old and expanding leaves in the presence and absence of nitrate limitation
S and N dynamics were monitored to determine the efficiency of mobilization of these elements and corresponding compounds in leaf rank no. 10, corresponding to the expanding leaf, which was the most markedly affected in terms of progression of leaf senescence, and in leaf no. 8, which was an old leaf likely to mobilize its S compounds during the experiment (Fig. 4).
Fig. 4.

Changes in the S and N amounts of the leaf blade of the leaf ranks 8 (A, B) and 10 (C, D) of oilseed rape in control plants (HS-HN), sulphate-limited plants (LS-HN), and in combined sulphate- and nitrate-limited plants (LS-LN) for 28 d of treatments. Other details as for Fig. 3.
In the older leaf of the control, the S amount represented about 125 μmol until day 28 (Fig. 4A). Compared with the control, the S amount decreased between days 7 and 21 in LS-HN and LS-LN. Finally, at day 28, the S amount represented only 24.2% of the control. In the expanding leaf of the control (Fig. 4C), the amount of S increased by about 40% between days 7 and 14 and remained stable thereafter. In response to the imposed limited S supply (LS-HN and LS-LN), the amount of S (Fig. 4C) decreased significantly after day 14, whatever the level of nitrate nutrition. Compared with the control, at day 14, the S amount was 70% and 60% lower in LS-HN and LS-LN, respectively.
In control plants, for 21 d, the N amount of old and expanding leaves was maintained at around 1 mmol leaf−1 and 1.4 mmol leaf−1, respectively. After this time, the N amount in both leaves tended to decrease slowly. Compared with the control, the N amount of the old and expanding leaves was not affected in LS-HN plants (Fig. 4B, D). By contrast, in the old leaf from LS-LN plants, the N amount decreased significantly after day 14. Finally, at day 28, the amount of N was 4-fold lower than at day 7 in LS-LN while it was only 2-fold less in control plants. Moreover, the amount of N of the expanding leaf from LS-LN plants decreased significantly after day 14, and reached a value 2-fold lower at day 28 compared with day 7.
Effects of limited sulphate supply on soluble proteins in old and expanding leaves in the presence and absence of nitrate limitation
Proteins are known to be mobilized during the senescence process and are an important reserve of N and S. The dynamics of soluble protein amounts would be expected to agree with the molecular indicators of senescence SAG12/Cab (Fig. 2). The changes of soluble protein amount in the old and expanding leaves were similar in control and LS-HN (Fig. 5). In both treatments, the soluble protein amount decreased between day 14 and day 28 (Fig. 5A), and day 21 and day 28 (Fig. 5B) for old and expanding leaves, respectively. In LS-LN conditions, the soluble protein amount in the old leaf was significantly lower than in the control up to day 21 and was finally 4-fold lower than the control by day 28 (Fig. 5A). By contrast, in response to LS-LN treatment, the soluble protein amount in the expanding leaf firstly decreased by 33% between 7 d and 14 d (Fig. 5B) and, secondly, decreased after day 21, finally to represent at day 28 only 44.2% of the control.
Fig. 5.

Changes in soluble protein amount in the leaf blade of the leaf ranks no. 8 (A) and 10 (B) of oilseed rape in control plants (HN-HS), sulphate-limited plants (HN-LS), and in combined sulphate- and nitrate-limited plants (LN-LS) for the 28 d of treatments. Other details as for Fig. 3.
Effects of limited sulphate supply on sulphate and 34S amounts in old and expanding leaves in the presence and absence of nitrate limitation
In the oldest leaves of control plants, the SO42− amount increased between 7 d and 14 d to reach a maximum around 100 μmol leaf−1 S−SO42−, and then remained constant between 14 d and 28 d (Fig. 6A). The SO42− amount of old leaves of LS-HN and LS-LN plants strongly decreased until day 21. Throughout the experiment, the SO42− amounts and concentrations observed in the old leaves from LS-HN plants were not significantly different from the amounts observed in LS-LN plants (Fig. 6A, B).
Fig. 6.

Changes in the sulphate-sulphur amount and concentration in the leaf blade of the leaf ranks 8 (A, B) and 10 (C, D) of oilseed rape in control plants (HS-HN), sulphate-limited plants (LS-HN), and in combined sulphate- and nitrate-limited plants (LS-LN) for the 28 d of treatments. Other details as for Fig. 3.
In the expanding leaf of control plants, the SO42− amount increased between 7 d and 14 d to reach a maximum of around 100 μmol leaf−1 S−SO42−, and remained constant between 14 d and 28 d (Fig. 6C). Compared with the control, the SO42− amount of expanding leaves of LS-HN and LS-LN plants remained lower during the experiment (around 30 μmol leaf−1). Between 7 d and 21 d, the SO42− amount was not significantly different in the expanding leaves from LS-HN and LS-LN plants. By contrast, between 21 d and 28 d, SO42− decreased in LS-LN, and at day 28, the SO42− amount was 2.5-fold lower in LS-LN than in LS-HN. Notably this decrease coincides with the theoretical date of the commencement of senescence, as previously determined (Fig. 2). The dynamics of SO42− concentration in the expanding leaf in LS-HN and LS-LN plants were different (Fig. 6D). The SO42− concentration in the expanding leaf of LS-HN plants decreased by 54% between days 7 and 14, whereas it did not decrease in LS-LN plants. By day 28, there was no significant difference between the residual SO42− concentration in the expanding leaves from LS-HN and LS-LN plants.
34S dynamics in old and expanding leaves were monitored to estimate the mobilization of S acquired before the application of S and N deficiencies (day 0). The 34S amount in the control old leaf decreased by 60% between 7 d and 28 d of the treatment (Fig. 7A). In the LS-HN old leaves, limited sulphate supply provoked a faster mobilization of 34S (Fig. 7A). The 34S amount in the LS-LN expanding leaves declined similarly to the control expanding leaves until day 21, and decreased faster between 21 d and 28 d to reach values similar to the LS-HN condition.
Fig. 7.

Changes in the 34S amount in the leaf blade of the leaf ranks 8 (A) and 10 (B) of oilseed rape in control plants (HS-HN), sulphate-limited plants (LS-HN), and in combined sulphate- and nitrate-limited plants (LS-LN) for 28 d of treatments. The plants were submitted to a long period of 34S-sulphate labelling until day 0, the date of the beginning of the chase period. Other details as for Fig. 3.
Figure 7B shows that, in spite of the increase followed by a maintenance of the total S amount at about 125 μmol observed in the expanding leaves of the control (Fig. 4C), the 34S previously assimilated was mobilized. The 34S amount in the control expanding leaves decreased mainly between days 7 and 14 (by 38%) and remained constant thereafter. The change of 34S amount in the LS-HN expanding leaves was similar to the control up to day 14. Compared with the control, after day 7, the 34S amount of these leaves decreased rapidly before the theoretical date of the onset of senescence and represented at day 21, about a half of the 34S amount of control leaves (Fig. 7B). The 34S amount in the LS-LN expanding leaves was reduced substantially between days 21 and 28, to reach a value 80% lower than at day 7. It was observed that the high decrease of 34S between days 21 and 28, was concomitant to the theoretical date of onset of senescence previously determined for the LS-LN expanding leaves.
Effects of limited sulphate supply on BnSultr4;1 and BnSultr4;2 gene expression in old and expanding leaves and on BnSultr1;1 and BnSultr1;2 gene expression in roots in the presence and absence of nitrate limitation
As the sulphate transporters BnSULTR4;1 and BnSULTR4;2 are implicated in the remobilization of sulphate stored in the vacuole (Buchner et al., 2004; Kataoka et al., 2004), their expression was examined in the old and expanding leaves (Fig. 8).
Fig. 8.

Relative expression of BnSultr4;1 and BnSultr4;2 genes expression in the leaf ranks 8 (A, B) and 10 (C, D) of oilseed rape in control plants (HS-HN), sulphate-limited plants (LS-HN), and in combined sulphate- and nitrate-limited plants (LS-LN) for the 28 d of treatments. The results of BnSultr4;1 and BnSultr4;2 expressions are relative to the result obtained in control plants (HS-HN) at day 7. Data were not determined at day 0 for the expanding leaf and at day 28 for the old leaf because of a lack of fresh matter. Other details as for Fig. 3.
In the older leaves of the control, BnSultr4;1 gene expression was stable throughout the experiment (Fig. 8A) whereas BnSultr4;2 gene expression was 6.7-fold increased between day 0 and day 21 (Fig. 8B). In response to LS-HN treatment, BnSultr4;1 expression in old leaves was higher than in the control from day 14 until day 21 (with an expression 6.6-fold higher at day 21 than in the control; Fig. 8A). BnSultr4;2 expression also highly increased at day 21 in the LS-HN old leaf (19.6-fold higher than in the control, Fig. 8B). For the old leaf in the double limitation (LS-LN), there was no significant difference for BnSultr4;1 gene expression during the 21 d of the experiment, while BnSultr4;2 expression was 9.1-fold higher at day 21 (Fig. 8A, B).
In the expanding leaves of the control, BnSultr4;1 gene expression was 4.3-fold increased between day 7 and day 14 (Fig. 8C) while BnSultr4;2 gene expression was stable throughout the experiment (Fig. 8D). In response to sulphate supply limitation (LS-HN), the level of BnSultr4;1 gene expression was increased at day 14 (3.4-fold higher compared to the control) and remained highly expressed until the end of the experiment (Fig. 8C). In addition, BnSultr4;2 gene expression also increased after day 21 in the expanding leaves subject to the LS-HN treatment and was 86.8-fold higher than control (Fig. 8D). In the case of the double limitation (LS-LN), there was no significant difference in BnSultr4;1 gene expression compared to control expanding leaves before day 21 (Fig. 8C). Between 21 d and 28 d, the expression level of BnSultr4;1 was increased by 2.6-fold compared to the control expanding leaves. Compared to the control, BnSultr4;2 gene expression in LS-LN increased slightly by day 14 (5.5-fold, Fig. 8D), and more strongly by day 28 (75.8-fold, Fig. 8D). Moreover, in response to the double limitation (LS-LN), the massive induction of BnSultr4;1 and 4;2 genes in the expanding leaf coincided with the commencement of senescence as determined with the SAG12/Cab indicator (Fig. 8C, D).
Since it has been demonstrated that the two high-affinity sulphate transporters Sultr1;1 and Sultr1;2 were involved in the major part of sulphate uptake (Buchner et al., 2004; Parmar et al., 2007; Barberon et al., 2008), and were dependent on different regulatory networks in Arabidopsis (Rouached et al., 2008), the expression of these two genes was also examined in lateral roots (see Supplementary Fig. S2 at JXB online). The BnSultr1;1 and BnSultr1;2 gene expressions in lateral roots (see Supplementary Fig. S2 at JXB online) were up-regulated in response to S deficiency. Compared with the control, BnSultr1;1 expression was up-regulated at day 21 (9-fold) in LS-HN roots while it was not induced in LS-LN lateral roots. BnSultr1;2 expression was also up-regulated at day 21 (3-fold) in LS-HN roots and at day 28 (3-fold) in LS-LN roots.
Discussion
This study investigated the impact of limited S supply in the presence and absence of N limitation, applied to winter oilseed rape at the rosette stage, a vegetative stage of development often characterized by the occurrence of a transient limitation of mineral S and N resources. In order to determine if S recycling was associated with the foliar senescence processes, a leaf senescence molecular indicator (SAG12/Cab), previously developed by Gombert et al. (2006) and Etienne et al. (2007) in oilseed rape, was used. In addition, the dynamic of S remobilization in expanding and old leaves, considered to export large amounts of S (Parmar et al., 2007), was examined by using a long-term steady-state method of 34S labelling and by studying the expression level of BnSultr4;1, and BnSultr4;2 genes, which encode two transporters involved in the efflux of sulphate from the vacuole (Kataoka et al., 2004; Parmar et al., 2007).
In the vegetative stage, the present study revealed that decreased sulphate supply (15 μM; LS versus 300 μM SO42−; HS) applied for 28 d had no significant effect on the total fresh matter of shoots (Fig. 1). These results are in accordance with the study conducted by Koralewska et al. (2007), indicating that biomass allocation in Brassica oleracea is not affected solely by low concentrations of sulphate in the root environment but only by actual deficiency. In our study, the period of preculture for 51 d with an optimal sulphate level resulted in plants with a high initial S status. Thus, the remobilization of endogenous S compounds was sufficiently efficient to maintain growth during the 28 d of S deficiency.
Is S remobilization in S-limited plants related to leaf senescence processes and mineral N availability?
It is generally accepted that several resource limitations, such as water deficit or mineral N deficiency, can induce premature leaf senescence (Smart, 1994; Gan and Amasino, 1997; Etienne et al., 2007; Diaz et al., 2008). Based on the recent approach of Gombert et al. (2006) and Etienne et al. (2007), the SAG12/Cab molecular indicator was used to determine the progression of leaf senescence in oilseed rape. The effect of reducing sulphate supply on foliar senescence was highly dependent on nitrate availability. In the event of a transient mineral S deficiency occurring at the rosette stage, the recycling of endogenous foliar S compounds (particularly SO42− which may account for up to 70% of foliar S) may occur without any acceleration of leaf senescence process. Indeed, under high mineral N availability (LS-HN treatment), the progression of spatial leaf senescence was not accelerated in response to reduced sulphate supply, but, on the contrary, it was delayed until day 21 (Fig. 2). Moreover, these results were confirmed by the chlorophyll concentrations, which were maintained at a higher, or at least at the same level compared to the corresponding control leaves (Fig. 3). A similar result, with respect to chlorophyll concentration, was obtained by Blake-Kalff et al. (1998) for the oldest leaves of oilseed rape submitted to sulphate deficiency. According to Noodén et al. (1997), the establishment of the senescence process in leaves is accompanied by an induction of proteolysis. The amount of soluble protein in the old and expanding leaves of LS-HN plants remained similar to control values until the end of the experiment (Fig. 5). The remobilization of S from proteins does not take place under conditions of S starvation unless N is also deficient (Sunarpi and Anderson, 1996, 1997a, b). To our knowledge, it is the first time that a delay in leaf senescence in response to a sulphate deficiency has been demonstrated. In a recent experiment conducted with a different genotype of oilseed rape (Pollen), and for a longer period of S limitation, which was applied 35 d earlier, a delay in the progression of spatial leaf senescence was also observed (J-C Avice, unpublished results). The delay in leaf senescence observed in oilseed rape due to sulphate deficiency may be explained by the modifications of S metabolism related to phytohormones involved in the regulation of the leaf senescence process. Whilst about 20% of the methionine, synthesized simultaneously with cysteine (Ravanel et al., 1998), is incorporated into proteins, 80% of the remaining methionine is converted to SAM (Giovanelli et al., 1980; Giovanelli, 1990; Hoefgen and Hesse, 2007), a methyl donor required for the biosynthesis of ethylene, an up-regulator of leaf senescence (Sakai et al., 1998). Thus, in this study, the effect of transient S deficiency on leaf senescence may be explained by a decrease of SAM and ethylene biosynthesis in response to limiting S-assimilation (Hesse et al., 2004).
To assess whether mobilization processes were associated with the observed senescence, N and S composition and dynamics were studied in leaf no. 8 (an old and senescing leaf which can rapidly remobilize S) and in leaf no. 10 (a leaf in the expansion phase at the beginning of mineral S treatment which became a mature leaf by the end of experiment). This expanding leaf is notable because it is the leaf rank subject to the most contrasting status of senescence in response to the treatments (Fig. 3).
Dynamics of S remobilization and relationships between SO42− remobilization/BnSultr4-type gene expression in response to S deficiency is affected by N availability
SAG12/Cab expression indicated that the old leaf of HS-HN (control) plants senesced 18 d after the beginning of the treatment (Fig. 2). As expected, after this date, decreases in the amounts of chlorophyll concentration (Fig. 3A), total N (Fig. 4B), and soluble protein (Fig. 5A) were observed. Surprisingly, the S (Fig. 4A) and SO42− (Fig. 6A) amounts remained unchanged until the end of experiment, indicating that, upon optimal S and N nutrition, SO42− is maintained at a high level in old leaves, independent of the senescence status. In addition, the expression of the BnSultr4;1, a gene encoding a transporter involved in the remobilization of sulphate stored in the vacuolar compartment (Kataoka et al., 2004; Parmar et al., 2007), remained low in the control old leaves throughout the experiment (Fig. 8A). Nevertheless, the expression of BnSultr4;2, a gene encoding another putative tonoplast sulphate transporter (Kataoka et al., 2004; Parmar et al., 2007), increased during the experiment (×6.7 by day 21, Fig. 8B) in old leaves of control plants. In parallel, a decrease in the amount of 34S had been observed since the beginning of the experiment (Fig. 7A), indicating that the processes of remobilization in senescing leaves occurred even while the continued uptake of sulphate allowed the amount of total S to be maintained at a high level in these leaves. However, under optimal S availability, old leaves may be lost whilst still containing a high level of SO42−, which must result in a low S use efficiency for oilseed rape.
In expanding leaves of control plants, the S amount strongly increased between day 7 and day 14 and remained stable at about 125 μmol until the end of experiment (Fig. 4A). This may be explained by sulphate influx observed up until day 14 (Fig. 6). Nevertheless, while the S concentration of expanding leaves of control plants was not affected by senescence processes before the end of the experiment, the soluble protein amount (Fig. 5, day 28) and the 34S previously incorporated, significantly decreased (Fig. 7A). This decrease of 34S was in accordance with a transient increase of BnSultr4;1 (but not BnSultr4;2) gene expression between 7 s and 14 d (Fig. 8C, D). It is also interesting to note that, in spite of a maintenance of the total S amount at about 125 μmol (Fig. 4A), and of the SO42− amount at about 100 μmol S−SO42− (Fig. 6A), the 34S previously incorporated in old leaves of the control decreased during the first 14 d of the experiment, mainly before the onset of senescence (Fig. 7A). These observations underline the complex foliar dynamics of S movements involving processes of mobilization independent of the senescence status and obscured under control conditions by an accumulation or maintenance of sulphate amount, which is principally in the vacuole. This mobilization of previously assimilated 34S can be explained by (i) protein turnover accompanied by mobilization of free S-amino acids generated by protein degradation, (ii) mobilization of SO42− concomitant with an accumulation of newly accumulated unlabelled SO42−, and/or (iii) mobilization of other organic S compounds such as glutathione, glucosinolates, and non-protein thiols.
In response to limiting S supply (LS-HN), the total S amount of old leaves strongly decreased, indicating a large remobilization of S compounds. The decrease of S (Fig. 4A) is not related to the remobilization of S from proteins (Fig. 5A) but is mainly explained by the remobilization of previously accumulated sulphate (Fig. 6A), and coincided with the induction of BnSultr4;1 gene expression. Compared to the control, BnSultr4;1 gene expression was increased earlier than BnSultr4;2 in old leaves of LS-HN plants (day 14 for BnSultr4;1 compared with day 21 for BnSultr4;2, Fig. 8A, B). In addition, the kinetics of the 34S amount (Fig. 7A) paralleled the changes in the amount of sulphate and BnSultr4;1 gene expression. As sulphate is often the major endogenous S compound (Blake-Kalff et al., 1998), it may be hypothesized that the 34S mobilized in old leaves is in the sulphate form. Altogether, these data suggest that, under S limitation, the vacuolar transporters BnSULTR4 (initially mainly BnSULTR4;1 and under extreme conditions, BnSULTR4;2) contributed to the efficient efflux of sulphate from the vacuoles of old leaves, destined for redistribution towards young organs. Under these experimental conditions, this remobilization of sulphate in S-limited plants was sufficient to maintain the growth of shoots at the same level as control plants (Fig. 1A).
As with LS-HN plants, in response to the combined limitations of S and N supply (LS-LN), the amounts of total S (Fig. 4A) and 34S (Fig. 7A) of the old leaves declined rapidly. The decrease of S in old leaves of LS-LN not only coincided with sulphate remobilization (Fig. 6A) but also with the recycling of S coming from the hydrolysis of soluble proteins (Fig. 5A) associated with the acceleration of senescence. The inhibition of shoot growth observed in LS-LN plants appears to be essentially due to the limitation of N nutrition. Compared with old leaves of LS-HN, the over-expression of the BnSultr4;1 transporter gene was not observed in old leaves of LS-LN plants (Fig. 8A). By contrast, LS-LN conditions led to an increase in BnSultr4;2 expression at day 21 (Fig. 8B), a pattern that coincided with the decrease of S and 34S observed after this date (Figs 4A, 7A).
Compared to the control, there is no accumulation of sulphate in the expanding leaves of LS-HN and LS-LN plants (Fig. 6C). Under LS-HN conditions, the transcripts abundance of BnSultr4;1 and BnSultr4;2 in expanding leaves strongly increased after 14 d and 21 d, respectively, and remained high thereafter (Fig. 8C, D). Simultaneously, the SO42− amount in expanding leaves of LS-HN plants remained low and stable (Fig. 6C), while the 34S amount decreased more rapidly than in control plants, before the theoretical date of the onset of senescence (Fig. 7B). These observations are explained, at least partially, by a mobilization of SO42− concomitant with the accumulation of newly acquired unlabelled SO42− after day 0. In the LS-LN expanding leaf, the major decrease of SO42− (Fig. 6C) and 34S (Fig. 7B) observed between 21 d and 28 d was concomitant with the theoretical date of onset of senescence, as determined by the SAG12/Cab indicator, and to a significant increase of BnSultr4;1 and BnSultr4;2 expression (Fig. 8C, D). Therefore, in expanding leaves subject to S and N limitation, the tonoplast transporters, BnSULTR4;1 and BnSULTR4;2, would be particularly involved in sulphate remobilization, concomitant with the beginning of leaf senescence.
From these results, it appears that sulphate mobilization observed in response to S limitation is more accurately determined by the 34S labelling-method than by the survey of apparent sulphate amounts. Second, in response to S limitation, sulphate recycling is mainly related to the over-expression of tonoplast SULTR4-group transporters and the relationship between sulphate mobilization and up-regulation of the gene expression of these transporters seems to be dependent on leaf development, and more specifically on the availability of mineral N. This clearly confirms the interaction of N metabolism on S use efficiency as previously reported (Janzen and Bettany, 1984; Schnug et al., 1993; Fismes et al., 2000).
Interestingly, as with BnSultr4;1 and BnSultr4;2, the expression of BnSultr1;1 and BnSultr1;2 genes in roots (see Supplementary Fig. S2 at JXB online) was differentially regulated in response to sulphate limitation and depended on the nitrate availability. These results show that the observation for BnSultr4;1 and BnSultr4;2 in leaves might be part of a larger regulatory mechanism responsible for the co-ordinated regulation of S and N metabolism between shoots and roots. The possibility for members of gene families of displaying an additional function besides its roles of sulphate membrane transport was recently raised by Barberon et al. (2008). Thus, in order to understand the contribution of sulphate transporters of groups 1 and 4 in the S management between roots and shoots of oilseed rape subject to S limitation, it will be necessary to investigate the patterns of gene expression of these sulphate transporters and to compare these data with the distribution of sulphate at whole plant level using 34S fluxes.
In conclusion, the processes involved in leaf S remobilization in response to restricted sulphate supply would differ in relation to nitrate availability. In the case of a transient mineral S limitation occurring at the rosette stage, the present study suggests that winter oilseed rape is able to maintain its growth by an optimization of the recycling of endogenous foliar S compounds (particularly sulphate) in old leaves without any acceleration of leaf senescence processes, which is not the case when S limitation is combined with low mineral N availability. Limitation of S supply induces a process of mobilization of sulphate concomitant with the up-regulation of the BnSULTR4 transporters mediating vacuolar sulphate efflux (LS-HN treatment). In future, to characterize the processes of S recycling better, it will be interesting to compare the foliar S distribution described here for oilseed rape rosettes with the distribution at stages characterized by higher growth rates and by high demand in S, for example, during the bolting (stem elongation) and flowering stages.
Supplementary Material
Acknowledgments
This work was supported by the French National Research Agency (ANR-COSMOS no. ANR-05-JC05-51097). Rothamsted Research receives grant-aided support from the Biotechnology and Biological Sciences Research Council (BBSRC), UK. The authors thank Mr Jean-Bernard Cliquet for his help in 34S oxidation, Mrs Servane Lemauviel-Lavenant for her help in statistical analysis, and Ms Alexandra Girondé for her valuable help in biochemical analysis.
Glossary
Abbreviations
- APS
5′-adenylphosphosulphate
- HS-HN
High S-High N
- LS-HN
Low S-High N
- LS-LN
Low S-Low N
- OAS
O-acetyl serine
- DW
dry weight
- S
sulphur
- SAM
S-adenosyl methionine
- V-CDT
Vienna Canyon Diablo Troilite
References
- Barberon M, Berthomieu P, Clairotte M, Shibagaki N, Davidian JC, Gosti F. Unequal functional redundancy between the two Arabidopsis thaliana high-affinity sulphate transporters SULTR1;1 and SULTR1;2. New Phytologist. 2008;180:608–619. doi: 10.1111/j.1469-8137.2008.02604.x. [DOI] [PubMed] [Google Scholar]
- Blake-Kalff MMA, Harrison KR, Hawkesford MJ, Zhao FJ, McGrath SP. Distribution of sulphur within oilseed rape leaves in response to sulphur deficiency during vegetative growth. Plant Physiology. 1998;118:1337–1344. doi: 10.1104/pp.118.4.1337. [DOI] [PMC free article] [PubMed] [Google Scholar]
- Bradford MM. A rapid method for the quantitation of microgram quantities of protein utilizing the principle of protein–dye binding. Analytical Biochemistry. 1976;72:248–254. doi: 10.1006/abio.1976.9999. [DOI] [PubMed] [Google Scholar]
- Buchner P, Stuiver CEE, Westerman S, Wirtz M, Hell R, Hawkesford MJ, De Kok LJ. Regulation of sulphate uptake and expression of sulphate transporter genes in Brassica oleracea as affected by atmospheric H2S and pedospheric sulphate nutrition. Plant Physiology. 2004;136:3396–3408. doi: 10.1104/pp.104.046441. [DOI] [PMC free article] [PubMed] [Google Scholar]
- Diaz C, Lemaître T, Christ A, Azzopardi M, Kato Y, Sato F, Morot-Gaudry JF, Le Dily F, Masclaux-Daubresse C. Nitrogen recycling and remobilization are differentially controlled by leaf senescence and development stage in Arabidopsis under low nitrogen nutrition. Plant Physiology. 2008;147:1437–1449. doi: 10.1104/pp.108.119040. [DOI] [PMC free article] [PubMed] [Google Scholar]
- Etienne P, Desclos M, Le Gou L, Bonnefoy J, Simon L, Maurel K, Le Dily F, Ourry A, Avice JC. N-protein mobilization associated to leaf senescence process of oilseed rape (Brassica napus L.) is concomitant with the disappearance of a trypsin inhibitor activity. Functional Plant Biology. 2007;34:895–906. doi: 10.1071/FP07088. [DOI] [PubMed] [Google Scholar]
- Fismes J, Vong PC, Guckert A, Frossard E. Influence of sulphur on apparent N-use efficiency, yield, and quality of oilseed rape (Brassica napus L.) grown on a calcareous soil. European Journal of Agronomy. 2000;12:127–141. [Google Scholar]
- Gan S, Amasino RM. Making sense of senescence. Molecular genetic regulation and manipulation of leaf senescence. Plant Physiology. 1997;113:313–319. doi: 10.1104/pp.113.2.313. [DOI] [PMC free article] [PubMed] [Google Scholar]
- Giovanelli J. Regulatory aspects of cysteine and methionine biosynthesis. In: Rennenberg H, Brunold C, De Kok LJ, Stulen I, editors. Sulphur nutrition and sulphur assimilation in higher plants; fundamental, environmental and agricultural aspects. The Hague: SPB Academic Publishing; 1990. pp. 33–48. [Google Scholar]
- Giovanelli J, Mudd SH, Datko AH. Sulphur amino acids in plants. In: Miflin BJ, editor. The biochemistry of plants. Vol. 5. New York: Academic Press; 1980. pp. 453–505. [Google Scholar]
- Gombert J, Etienne P, Ourry A, Le Dily F. The expression patterns of SAG12/Cab genes reveal the spatial and temporal progression of leaf senescence in Brassica napus L. with sensitivity to the environment. Journal of Experimental Botany. 2006;57:1949–1956. doi: 10.1093/jxb/erj142. [DOI] [PubMed] [Google Scholar]
- Hawkesford MJ. Plant responses to sulphur deficiency and the genetic manipulation of sulphate transporters to improve S-utilization efficiency. Journal of Experimental Botany. 2000;51:131–138. [PubMed] [Google Scholar]
- Hawkesford MJ. Transporter gene families in plants: the sulphate transporter gene family: redundancy or specialization? Physiologia Plantarum. 2003;117:155–165. [Google Scholar]
- Hawkesford MJ, De Kok LJ. Managing sulphur metabolism in plants. Plant, Cell and Environment. 2006;29:382–395. doi: 10.1111/j.1365-3040.2005.01470.x. [DOI] [PubMed] [Google Scholar]
- Hesse H, Nikiforova V, Gakière B, Hoefgen R. Molecular analysis and control of cysteine biosynthesis: integration of nitrogen and sulphur metabolism. Journal of Experimental Botany. 2004;55:1283–1292. doi: 10.1093/jxb/erh136. [DOI] [PubMed] [Google Scholar]
- Hirai YM, Fujiwara T, Awazuhara M, Kimura T, Masaaki N, Saito K. Global expression profiling of sulphur-starved Arabidopsis by DNA macroarray reveals the role of O-acetyl-L-serine as a general regulator of gene expression in response to sulphur nutrition. The Plant Journal. 2003;33:651–663. doi: 10.1046/j.1365-313x.2003.01658.x. [DOI] [PubMed] [Google Scholar]
- Hirai MY, Klein M, Fujikawa Y, et al. Elucidation of gene-to-gene and metabolite-to-gene networks in Arabidopsis by integration of metabolomics and transcriptomics. Journal of Biological Chemistry. 2005;280:25590–25595. doi: 10.1074/jbc.M502332200. [DOI] [PubMed] [Google Scholar]
- Hirai MY, Yano M, Goodenowe DB, Kanaya S, Kimura T, Awazuhara M, Arita M, Fujiwara T, Saito K. Integration of transcriptomics and metabolomics for understanding of global responses to nutritional stresses in Arabidopsis thaliana. Proceedings of the National Academy of Sciences, USA. 2004;101:10205–10210. doi: 10.1073/pnas.0403218101. [DOI] [PMC free article] [PubMed] [Google Scholar]
- Hoefgen R, Hesse H. Sulphur in plants as part of a metabolic network. In: Hawkesford MJ, De Kok LJ, editors. Sulphur in plants: an ecological perspective. Vol. 6. Netherlands: Springer; 2007. pp. 107–142. [Google Scholar]
- Janzen HH, Bettany JR. Sulphur nutrition of rapeseed. I. Influence of fertilizer nitrogen and sulphur rates. Soil Science Society of America Journal. 1984;48:100–107. [Google Scholar]
- Kataoka T, Watanabe-Takahashi A, Hayashi N, Ohnishi M, Mimura T, Buchner P, Hawkesford MJ, Yamaya T, Takahashi H. Vacuolar sulphate transporters are essential determinants controlling internal distribution of sulphate in Arabidopsis. The Plant Cell. 2004;16:2693–2704. doi: 10.1105/tpc.104.023960. [DOI] [PMC free article] [PubMed] [Google Scholar]
- Kopriva S, Rennenberg H. Control of sulphate assimilation and glutathione synthesis: interaction with N and C metabolism. Journal of Experimental Botany. 2004;55:1831–1842. doi: 10.1093/jxb/erh203. [DOI] [PubMed] [Google Scholar]
- Koralewska A, Posthumus FS, Stuiver CEE, Buchner P, Hawkesford MJ, De Kok LJ. The characteristic high sulphate content in Brassica oleracea is controlled by the expression and the activity of sulphate transporter. Plant Biology. 2007;9:654–661. doi: 10.1055/s-2007-965438. [DOI] [PubMed] [Google Scholar]
- Lim PO, Kim HJ, Nam HG. Leaf senescence. Annual Review of Plant Biology. 2007;58:115–136. doi: 10.1146/annurev.arplant.57.032905.105316. [DOI] [PubMed] [Google Scholar]
- Livak KJ, Schmittgen TD. Analysis of relative gene expression data using real-time quantitative PCR and the 2−ΔΔCT method. Methods. 2001;25:402–408. doi: 10.1006/meth.2001.1262. [DOI] [PubMed] [Google Scholar]
- Maruyama-Nakashita A, Inoue E, Watanabe-Takahashi A, Yamaya T, Takahashi H. Transcriptome profiling of sulphur-responsive genes in Arabidopsis reveals global effects of sulphur nutition on multiple metabolic pathways. Plant Physiology. 2003;132:597–605. doi: 10.1104/pp.102.019802. [DOI] [PMC free article] [PubMed] [Google Scholar]
- McGrath SP, Zhao FJ. Sulphur uptake, yield responses and the interactions between nitrogen and sulphur in winter oilseed rape (Brassica napus) Journal of Agricultural Science. 1996;126:53–62. [Google Scholar]
- Migge A, Bork C, Hell R, Becker TW. Negative regulation of nitrate reductase gene expression by glutamine or asparagine accumulating in leaves of sulphur-deprived tobacco. Planta. 2000;211:587–595. doi: 10.1007/s004250000322. [DOI] [PubMed] [Google Scholar]
- Nicot N, Hausman JF, Hoffmann L, Evars D. Housekeeping gene selection for real-time RT-PCR normalization in potato during biotic and abiotic stress. Journal of Experimental Botany. 2005;56:2907–2914. doi: 10.1093/jxb/eri285. [DOI] [PubMed] [Google Scholar]
- Nikiforova V, Freitag J, Kempa S, Adamik M, Hesse H, Hoefgen R. Transcriptome analysis of sulphur depletion in Arabidopsis thaliana: interlacing of biosynthetic pathways provides response specificity. The Plant Journal. 2003;33:633–650. doi: 10.1046/j.1365-313x.2003.01657.x. [DOI] [PubMed] [Google Scholar]
- Nikiforova VJ, Gakière B, Kempa S, Adamik M, Willmitzer L, Hesse H, Hoefgen R. Towards dissecting nutrient metabolism in plants: a systems biology case study on sulphur metabolism. Journal of Experimental Botany. 2004;55:1861–1870. doi: 10.1093/jxb/erh177. [DOI] [PubMed] [Google Scholar]
- Nikiforova VJ, Kopka J, Tolstikov V, Fiehn O, Hopkins L, Hawkesford MJ, Hesse H, Hoefgen R. Systems rebalancing of metabolism in response to sulphur deprivation, as revealed by metabolome analysis of Arabidopsis plants. Plant Physiology. 2005;138:304–318. doi: 10.1104/pp.104.053793. [DOI] [PMC free article] [PubMed] [Google Scholar]
- Noquet C, Avice JC, Rossato L, Beauclair P, Henry MP, Ourry A. Effects of altered source–sink relationship on N allocation and vegetative storage protein accumulation in Brassica napus L. Plant Science. 2004;166:1007–1018. [Google Scholar]
- Noodén LD, Guiamét JJ, John I. Senescence mechanisms. Physiologia Plantarum. 1997;101:746–753. [Google Scholar]
- Parmar S, Buchner P, Hawkesford MJ. Leaf developmental stage affects sulphate depletion and specific sulphate transporter expression during sulphur deprivation in Brassica napus. Plant Biology. 2007;9:647–653. doi: 10.1055/s-2007-965428. [DOI] [PubMed] [Google Scholar]
- Ravanel S, Gakière B, Job D, Douce R. The specific features of methionine biosynthesis and metabolism in plants. Proceedings of the National Academy of Sciences, USA. 1998;95:7805–7812. doi: 10.1073/pnas.95.13.7805. [DOI] [PMC free article] [PubMed] [Google Scholar]
- Rouached H, Wirtz M, Alary R, Hell R, Arpat AB, Davidian JC, Fourcroy P, Berthomieu P. Differential regulation of the expression of two high-affinity sulphate transporters, SULTR1.1 and SULTR1.2, in Arabidopsis. Plant Physiology. 2008;147:897–911. doi: 10.1104/pp.108.118612. [DOI] [PMC free article] [PubMed] [Google Scholar]
- Sakai H, Hua J, Chen QG, Chang C, Medrano LJ, Bleecker AB, Meyerowitz EM. ETR2 is an ETR1-like gene involved in ethylene signaling in Arabidopsis. Proceedings of the National Academy of Sciences, USA. 1998;95:5812–5817. doi: 10.1073/pnas.95.10.5812. [DOI] [PMC free article] [PubMed] [Google Scholar]
- Scherer HW. Sulphur in crop production: invited paper. European Journal of Agronomy. 2001;14:81–100. [Google Scholar]
- Schnug E, Haneklaus S, Murphy D. Impact of sulphur fertilization on fertilizer nitrogen efficiency. Sulphur in Agriculture. 1993;17:8–12. [Google Scholar]
- Smart C. Gene expression during leaf senescence. New Physiologist. 1994;126:419–448. doi: 10.1111/j.1469-8137.1994.tb04243.x. [DOI] [PubMed] [Google Scholar]
- Smart CM, Hosken SE, Thomas H, Greaves JA, Blair BG, Schuch W. The timing of maize leaf senescence and characterization of senescence-related cDNAs. Physiologia Plantarum. 1995;93:673–682. [Google Scholar]
- Sunarpi, Anderson JW. Distribution and redistribution of sulphur supplied as [35S]sulphate to roots during vegetative growth of soybean. Plant Physiology. 1996;11:1151–1157. doi: 10.1104/pp.110.4.1151. [DOI] [PMC free article] [PubMed] [Google Scholar]
- Sunarpi, Anderson JW. Allocation of S in generative growth of soybean. Plant Physiology. 1997a;114:687–693. doi: 10.1104/pp.114.2.687. [DOI] [PMC free article] [PubMed] [Google Scholar]
- Sunarpi, Anderson JW. Effect of nitrogen nutrition on remobilization of protein sulphur in the leaves of vegetative soybean and associated changes in soluble sulphur metabolites. Plant Physiology. 1997b;115:1671–1680. doi: 10.1104/pp.115.4.1671. [DOI] [PMC free article] [PubMed] [Google Scholar]
Associated Data
This section collects any data citations, data availability statements, or supplementary materials included in this article.