

Abstract
Amyloid fibrils are associated with more than 20 diseases, including Alzheimer's disease and type II diabetes. Insulin is a 51-residue polypeptide hormone, with its two polypeptide chains linked by one intrachain and two interchain disulfide bonds, and has long been known to self-assemble in vitro into amyloid fibrils. We demonstrate here that bovine insulin forms flexible filaments in the presence of a reducing agent, Tris (2-carboxyethyl) phosphine. The insulin filaments, possibly formed due to partial reduction of S-S bonds in insulin molecules, differ from intact insulin fibrils in terms of their secondary structure. The insulin filaments were determined to have an antiparallel β-sheet structure, whereas the insulin fibrils have a parallel β-sheet structure. Of importance, the cell toxicity of the insulin filaments was remarkably lower than that of the insulin fibrils. This finding supports the idea that cell toxicity of amyloids correlates with their morphology. The remarkably low toxicity of the filamentous structure should shed new light on possible pharmacological approaches to the various diseases caused by amyloid fibrils.
Introduction
Protein aggregation, and amyloid formation in particular, are receiving considerable interest because growing evidence indicates that they are likely to be key issues in the etiology of more than 20 disease states, including Alzheimer's disease, Parkinson's disease, and Creutzfeldt-Jakob disease (1–3). Recent studies have shown that a number of nondisease-associated proteins can also form similar amyloid-like fibers under appropriate conditions in vitro, suggesting that such conformations are common to many proteins (1,3).
Although no sequence or structural similarity between the amyloid precursor proteins has been found, amyloid fibrils share several common structural and spectroscopic properties. Amyloid fibrils are typically rigid, unbranched structures with diameters of 8–13 nm and lengths of up to several micrometers. They are typified by a cross-β structure in which the β-strands are aligned perpendicularly to the long axis of the fibril (4), and by characteristic spectroscopic properties when dyes such as thioflavine T (ThT) and Congo red (CR) bind (5).
One of the most intensively studied amyloid-forming proteins is insulin. Insulin, a 51-residue polypeptide hormone, has a mainly helical native structure, with its two polypeptide chains linked by one intrachain and two interchain disulfide bonds (6). Amyloid deposits of insulin molecules were previously observed in a patient with insulin-dependent diabetes undergoing treatment by injection of porcine insulin (7). In vitro, insulin is readily converted to an inactive β-sheet-rich amyloid fibrillar form by incubation at high insulin concentrations, acidic pH, and elevated temperatures, and in the presence of organic solvents and agitation (8). It has been proposed that insulin fibrillation occurs through the dissociation of oligomers into monomers, with the monomer undergoing structural changes to partially folded intermediates that have a strong propensity to fibrillate (9–11).
The structure of insulin is substantially constrained by two disulfide bridges that cross-link the A-chain and B-chain, and a third disulfide bridge within the A-chain, all of which are retained in the fibrillar state (8). Devlin et al. (12) and Hong and Fink (13) showed that both the A-chain and B-chain of bovine insulin can independently form amyloid fibrils under conditions similar to those for the intact insulin. A detailed atomic force microscopy study showed that the fibrils of the A-chain and B-chain were different from the intact insulin fibrils in terms of diameter, helical repeat, and twist properties (12), which suggests that disulfide bonds cross-linking the A-chain and B-chain affect insulin fibrillation.
In this study, we examine the effect of reduction of the disulfide bonds on bovine insulin fibrillation. Since bovine insulin was dissolved and fibrillated in an acidic buffer, we used the reducing agent Tris(2-carboxyethyl)phosphine (TCEP), which works under acidic conditions (14). We demonstrate that in the presence of TCEP, insulin forms flexible filaments that are morphologically much different from typical insulin fibrils. Furthermore, we show that insulin filaments differ from insulin fibrils in terms of secondary structure and cell toxicity. This implies that the cell toxicity of amyloid fibrils is closely connected with their morphology. Since this filamentous aggregate could not be formed from the A-chains and B-chains independently, or from their mixture, we suggest that filament formation may be induced by a partial reduction of the disulfide bonds of insulin.
Materials and Methods
Materials
Bovine insulin and oxidized bovine insulin A-chains and B-chains were purchased from Sigma-Aldrich (St. Louis, MO). The cysteine residues of oxidized bovine insulin A-chains and B-chains were oxidized to cysteine-sulfonic acid (Cys-SO3H). ThT and CR were also obtained from Sigma-Aldrich. TCEP was obtained from Pierce (Rockford, IL). All other reagents were of analytical grade. Aqueous solutions were prepared with deionized Milli-Q water (Millipore, Billerica, MA) throughout this study.
Preparation of insulin samples
All protein samples were prepared immediately before the experiments were performed. Insulin was dissolved at a concentration of 20 mg/mL in 40 mM HCl (pH 1.5) and then immediately diluted in buffer A (20% acetic acid, 100 mM NaCl, pH 1.6), including 0–20 mM TCEP at a protein concentration of 2 mg/mL (345 μM). The concentration of insulin was determined using an extinction coefficient of 1.0 cm−1 for 1 mg/mL at 276 nm (11). Fibrillation was induced by heating the insulin solution at 70°C for 13 h without agitation. Samples of 2 mg/mL incubated insulin were dialyzed by 20% acetate buffer and subsequently distilled water using a Slide-A-Lyzer Mini dialysis unit (10,000 MWCO; Pierce) for removal of insulin monomers and buffer exchange. For several experiments, insulin fibrils and filaments were further concentrated by removal of supernatant after centrifugation at 15,000 rpm for 30 min. No insulin sample was observed in the supernatant. This centrifugation treatment did not alter the morphologies of the insulin fibrils or filaments (data not shown). The fibril concentrations and conversion ratio from insulin monomer into insulin fibrils were determined beforehand by subtracting the insulin monomer concentration measured in supernatants after centrifugation at 15,000 rpm for 60 min in part of the incubated insulin samples.
ThT assay
For the time-course assay, 29 μL aliquots were taken at desired time intervals from the incubated mixture and added to a 2 mL solution containing 5 μM ThT in 10 mM phosphate, pH 7.4, 150 mM NaCl (final pH of the ThT solution decreased to 1.6), and fluorescence measurements were carried out with a spectrofluorometer (FP-6500; Jasco, Tokyo, Japan) at 25°C. The excitation wavelength was 450 nm and the emission was measured at 485 nm. The intensities were corrected to correspond to the equal amount (5 μM as monomer concentration) of the assembled insulin fibrils and filaments after 13 h incubation.
To obtain fluorescence spectra, 10 μL of 1 mM insulin fibril/filament samples dissolved in distilled water were added to a 2 mL solution containing 5 μM ThT in 10 mM phosphate, pH 7.4, and 150 mM NaCl, and fluorescence spectra with the excitation wavelength at 450 nm at 25°C were obtained with the spectrofluorometer.
CR binding assay
To evaluate binding of CR to insulin fibrils and filaments, 10 μL of 1 mM insulin fibril/filament samples dissolved in distilled water was added to a 2 mL solution containing 25 μM CR in 10 mM phosphate, pH 7.4, 150 mM NaCl. After 30 min incubation at room temperature, absorbance spectra were obtained with an ultraviolet-visible spectrophotometer (CARY 50; Varian, Palo Alto, CA).
Far-ultraviolet circular dichroism
The far-ultraviolet (UV) circular dichroism (CD) spectra of 0.3 mg/mL insulin fibrils and filaments were recorded using a Jasco-720W spectropolarimeter at 25°C with a thermostated cell holder and a 2.0 mm-path-length quartz cuvette. The CD spectrum of distilled water was subtracted from the sample spectra for background correction.
Transmission electron microscopy
Transmission electron microscopy (TEM) measurements were performed on a JEM-1011 transmission electron microscope (JEOL, Tokyo, Japan) operated at 100 kV. Samples were diluted 10-fold with distilled water and negatively stained with 2% (w/v) uranyl acetate solution on copper grids (400-mesh) covered by carbon-coated Formvar film (JEOL DATUM, Tokyo, Japan). The observation magnification was ×25,000.
Fourier transform infrared spectroscopy
Attenuated total reflectance Fourier transform infrared (ATR-FTIR) spectra were recorded on a FT/IR 615 spectrophotometer (Jasco, Tokyo, Japan) with an MK II Golden Gate Single Reflection ATR system attachment (Specac, Kent, UK) from 1750 to 1550 cm−1 using a resolution of 4 cm−1 and an accumulation of 256 scans. Ten μL of the aliquots from the concentrated (100 mg/mL) insulin fibril/filaments samples whose buffer was replaced by D2O as described above were spread on the surface of a diamond crystal. Curve-fitting of the amide I regions (raw spectra) was performed using Igor Pro software (WaveMetrics, Portland, OR). Deconvolution analysis with Gaussian function was carried out using the five peak positions that were previously used for the analysis of protein amyloid: 1600–1615 cm−1 (β-sheet, extended chain, side chain), 1615–1630 cm−1 (β-sheet), 1630–1650 cm−1 (α-helix), 1650–1690 cm−1 (turn, disordered), and 1690–1700 cm−1 (antiparallel β-sheet) (13,15,16). The bandwidth for each deconvoluted spectra was set to 14 cm−1 (halfwidth at half-maximum amplitude), except for one for the 1690–1700 cm−1 peak (4.5 cm−1).
Micro-Raman spectroscopy
Raman spectra of solid samples were recorded using a Raman microscope system (LabRAM; Dilor-Jobin Yvon, Horiba, Tokyo, Japan). In brief, 50–100 μL of the fibril solution dissolved in distilled water was directly applied on a stainless-steel plate and subsequently air-dried. Solid samples were observed through the microscope with a 100× object lens (Olympus, Tokyo, Japan) and CCD camera (17). Approximately 10 mW of 514.5 nm laser excitation from an Ar+ laser was used to generate Raman scattering with an acquisition time of 2–5 min. Spectra were normalized relative to the 1673 cm−1 amide I band as an internal standard. Curve-fitting of the amide I regions (raw spectra) was performed with the use of Igor Pro software using peak positions that were previously used for analysis of proteins (18). At least three individual spectra were obtained, and one is shown in the figures. The bandwidth for each deconvoluted spectrum was set to 5, 25, 12, 9, and 12 cm−1 for the 1618, 1630, 1660, 1675, and 1689 cm−1 peak, respectively, except for one for the 1605 cm−1 peak (7.3 cm−1 for fibrils and 17 cm−1 for filaments, respectively).
Quantification of S-S bonds in insulin fibrils
Changes in the amount of S-S bonds in insulin fibrils were investigated by analyzing the S-S stretching frequencies centered at 514 cm−1 and S-H stretching frequencies at 2574 cm−1 of the Raman spectra (18). The peak area was calculated by fitting with Gaussian functions using Levenberg-Marquardt nonlinear least-squares methods in the Igor Pro software. The amount of S-S bonds and free SH groups were estimated as peak area ratios of each band to the amide I band (1673 cm−1), respectively, as described in a previous study (18).
Size exclusion chromatography of supernatants
Size exclusion chromatography was performed with a column (G2000SWXL; Tosho, Tokyo, Japan) using a high-performance liquid chromatography system (EZChromElite; Hitachi, Tokyo, Japan) connected to a UV detector (L-2455; Hitachi). After incubation in buffer A in the presence or absence of 20 mM TCEP at a protein concentration of 2 mg/mL at 70°C for 13 h, the samples were centrifuged (15,000 rpm for 60 min). The insulin monomer concentration that remained in the supernatant was determined as described. Then 100 μL aliquots of supernatant, including 0.2 mg/mL insulin sample diluted in the running buffer (45% acetonitrile and 0.1% TFA), were loaded on the column at 25°C. Elution was performed with the running buffer at a flow rate of 1.0 mL/min and absorbance of the sample was monitored at 220 nm.
Toxic assay
Cell viability was determined with the use of an MTT cell proliferation kit (Roche, Basel, Switzerland), which is based on the conversion of tetrazolium salt by mitochondrial dehydrogenase to a formazan product that is spectrophotometrically measurable at 550 nm, according to the manufacturer's instructions.
PC12 cells (a clonal line of rat pheochromocytoma) were maintained in RPMI1640 medium with 10% horse serum, 5% fetal bovine serum, penicillin (100 U/mL), and streptomycin (100 μg/mL) in 5% CO2 at 37°C.
Cells were plated out in 96-well plates at a density of 50,000 cells/well and grown overnight. The cells were then incubated in 100 μL medium in the absence (control) and presence of insulin fibrils dialyzed with PBS buffer instead of distilled water as described above. After 24 h of incubation, 10 μL of MTT reagents were added to each well. The cells were incubated for 4 h at 37°C in a 5% CO2 incubator. The reaction was stopped by adding 100 μL of 10% SDS in 10 mM HCl. The plates were read with a microplate reader (SPECTRAmax; Molecular Devices, Sunnyvale, CA) at 550 nm. Each data point was an average of three triplet-well assays.
Results
Fibrillation of insulin in the presence of TCEP
The time course of the fibrillation of bovine insulin with and without the reducing agent, TCEP, was monitored by ThT fluorescence (Fig. 1 A). TCEP was used because it is known to work under acidic conditions (14), which are classic and widely employed in insulin fibrillation studies (8,11). ThT is a widely used fluorescence dye whose fluorescence emission increases upon binding to stacked β-sheet structures in amyloid fibrils (5,19). In the absence of TCEP, insulin fibrillation was observed after a lag time of ∼3 h, as previously shown (8,11). TEM observations confirmed the formation of straight fibrils (Fig. 2 A), as reported in previous studies (8,11,12). The conversion ratio from insulin monomer into insulin fibrils after 13 h incubation was calculated to be 97.5% by measuring the amount of unconverted insulin monomer that remained in the supernatants after centrifugation of part of the incubated insulin samples.
Figure 1.
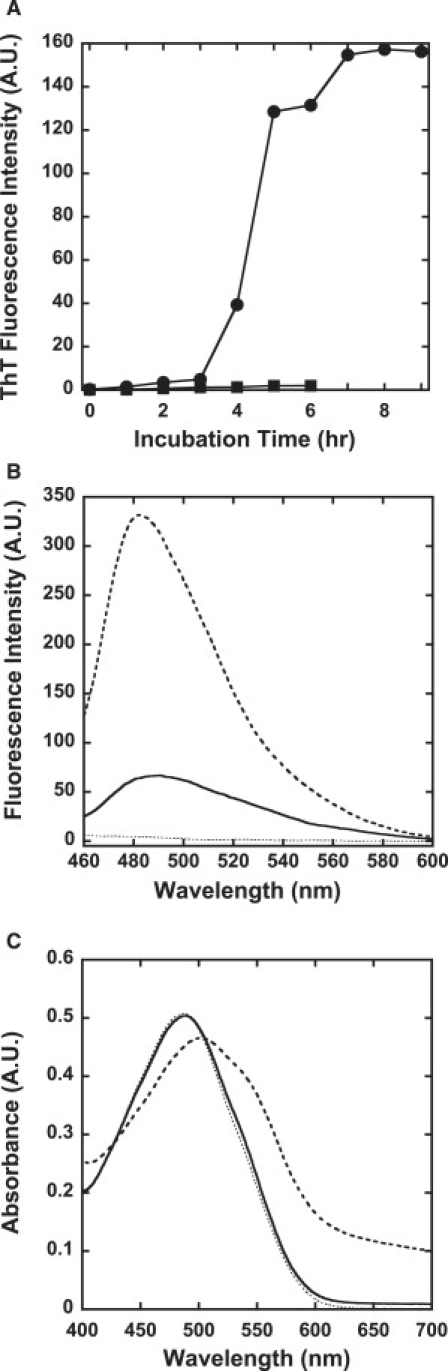
ThT assay and CR assay of insulin aggregation in the presence of TCEP. (A) Time-course assay monitored by ThT fluorescence: bovine insulin was incubated in the absence (●) or presence (■) of 20 mM TCEP. ThT fluorescence at 485 nm was measured. The intensities were corrected to correspond to the equal amount (5 μM as monomer concentration) of the assembled insulin fibrils and filaments after 13 h incubation. (B) ThT assay: 10 μL of 1 mM insulin aggregates formed in the absence (broken line) and presence (solid line) of 20 mM TCEP dissolved in distilled water were added to a 2 mL solution containing 5 μM ThT in 10 mM phosphate, pH 7.4, 150 mM NaCl (dotted line), and fluorescence spectra with the excitation wavelength at 450 nm at 25°C were obtained by the spectrofluorometer. (C) CR assay: 10 μL of 1 mM insulin aggregates formed in the absence (broken line) and presence (solid line) of 20 mM TCEP dissolved in distilled water were added to a 2 mL solution containing 25 μM CR in 10 mM phosphate, pH 7.4, 150 mM NaCl (dotted line). After 30 min incubation at room temperature, absorbance spectra were obtained with an ultraviolet-visible spectrophotometer.
Figure 2.
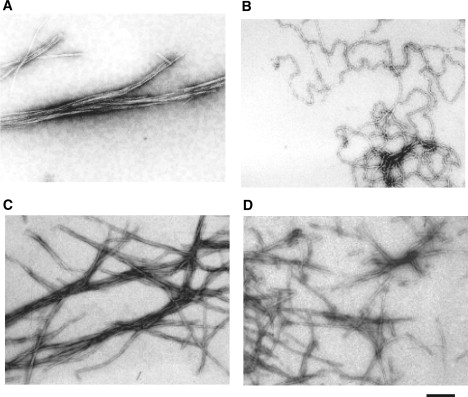
TEM analysis of insulin aggregates. Bovine insulin was incubated at a final concentration of 2 mg/mL at pH 1.6 and 70°C for 13 h in the absence (A) and presence (B) of 20 mM TCEP. Equal molar amounts of insulin A-chain and B-chain were co-incubated under identical conditions in the absence (C) and presence (D) of 20 mM TCEP. The scale bar represents 200 nm.
In contrast, when insulin was incubated with excess TCEP, only a small increase in the ThT fluorescence signal was observed (Fig. 1 A). Since almost the same ThT intensities were observed for insulin samples incubated with 1, 5, or 20 mM TCEP (data not shown), samples incubated with 20 mM TCEP were used for further studies. TEM imaging revealed that filamentous insulin amyloids, which differ from intact fibrils, were formed in the presence of TCEP (Fig. 2 B). TCEP-treated insulin filaments were more highly flexible than intact insulin fibrils. It should be noted that a mixture of the individual insulin A- and B-chains did not form this filamentous amyloid structure, regardless of the presence of TCEP (Fig. 2, C and D). These results indicate that insulin filaments were formed only when intact insulin was incubated in the presence of TCEP, as discussed later. The conversion ratio from insulin monomer into insulin filaments after 13 h incubation was calculated to be 69.5%.
Of interest, small but significant ThT fluorescence was observed for the insulin filaments when the dissolved buffers were exchanged to distilled water before the assay, which indicates that ThT can bind to insulin filaments weakly at pH 7.4 (Fig. 1 B). Since only a trace ThT intensity was observed for insulin filaments at pH 1.6 (Fig. 1 A), this result suggests that insulin filaments are more pH-sensitive in ThT binding than insulin fibrils.
A CR binding assay was also carried out. CR is also widely used to detect amyloid formation (5). The buffers of both insulin fibrils and filaments were also exchanged to distilled water before the assay. As shown in Fig. 1 C, no change in the absorbance spectra was observed upon addition of filamentous insulin amyloids, although the same amount of insulin fibrils induced a significant spectral change. These results indicate that CR does not bind to insulin filaments formed in the presence of TCEP, whereas ThT can weakly bind to insulin filaments.
Secondary structure of insulin fibrils and filaments
The far-UV CD spectra of insulin fibrils and filaments are shown in Fig. 3. The spectrum of native insulin before incubation is also shown for comparison. The spectrum had double minima at 208 and 222 nm, which is characteristic of the α-helical structure. In contrast, both fibrils and filaments showed a β-sheet structure, with a single minimum observed at ∼220 nm. The peak of filaments differed a little from that of fibrils. These longer-wavelength peaks have been observed in various kinds of fibrils and are thought to be evidence of the formation of β-sheet structures (9,20).
Figure 3.
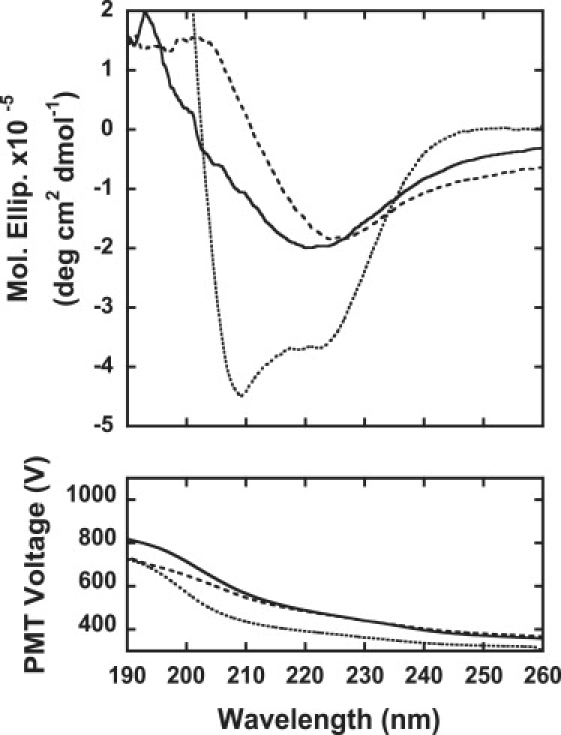
Far-UV CD spectra of insulin samples: 0.3 mg/mL insulin samples of native insulin (dotted line), insulin fibrils formed in the absence of TCEP (broken line), and insulin filaments formed in the presence of 20 mM TCEP (solid line) were assayed. The photomultiplier voltage is also shown in the figure.
ATR-FTIR was used to study the secondary structures of insulin fibrils and filaments. Previous studies showed that monomeric native insulin is characterized by a peak at ∼1654 cm−1, which is characteristic of α-helical proteins, and when converted into fibrils the peak shifts to ∼1628 cm−1, which is consistent with the high β-sheet structure content of the fibrils (15,21,22). In our experiment, a similar peak shift was also observed between the ATR-FTIR spectra of native insulin and insulin fibrils (Fig. 4, A and B). Although the second derivatives of IR spectra are usually used to identify the peaks of each component band, the resolutions of our spectra were not sufficient for the analysis. Therefore, our spectra were analyzed using five bands having a center within 1600–1615, 1615–1640, 1640–1660, 1660–1690, and 1690–1700 cm−1, which are assigned to extended chain β-sheet or side chain, β-sheet, α-helix, turn or disordered, and antiparallel β-sheet structure, respectively (see also Table S1 in the Supporting Material). As a result, it was revealed that the relative area of the band corresponding to the α-helix (at 1642–1644 cm−1) decreased to only 17% in insulin fibrils, whereas the β-sheet bands (1623 cm−1) were significantly elevated to 62%. This observation indicates that the formation of the fibril is accompanied by the conversion of the α-helix to β-sheet structures. The peak position of the β-sheet band in insulin fibrils (1623 cm−1) is significantly different from that in native insulin (1628 cm−1), which is typical for amyloid fibrils, suggesting intermolecular β-sheet formation (23).
Figure 4.
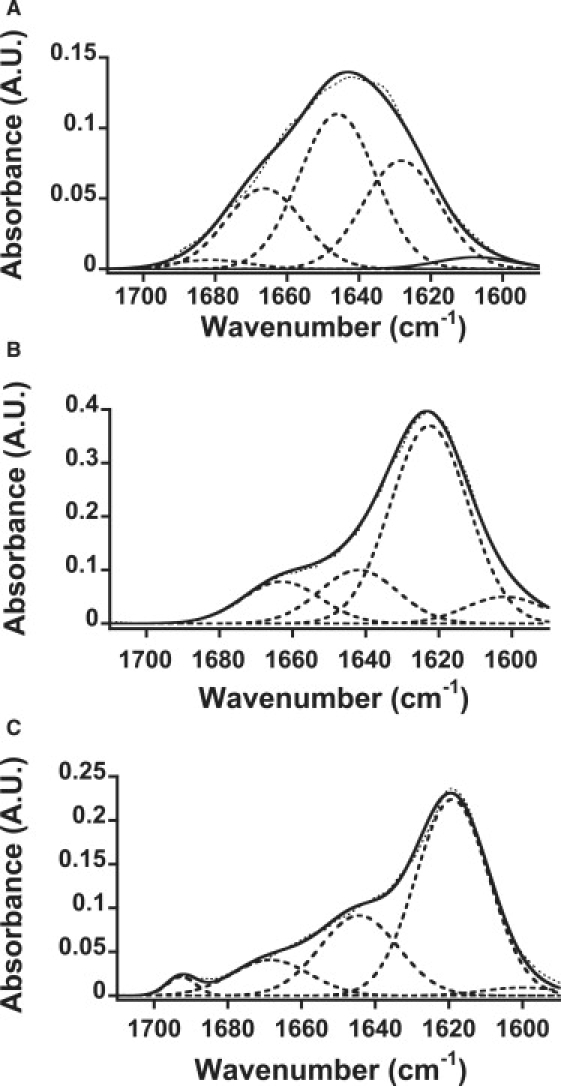
Changes in the secondary structure composition of insulin samples with FTIR. ATR-FTIR spectra insulin samples: (A) native insulin, (B) insulin fibrils formed in the absence of TCEP, and (C) insulin filaments formed in the presence of 20 mM TCEP. The dotted line represents the raw data, and the solid line represents the fitted data used for deconvolution (broken line).
The insulin filaments gave the spectrum shown in Fig. 4 C, which has a strong band at 1619 cm−1 and an additional band at 1693 cm−1. The deconvoluted spectra show 1600, 1619, 1644, 1668, and 1693 cm−1 bands. The large intermolecular β-sheet band at 1619 cm−1 was also observed for insulin filaments. In comparison with those of the insulin fibrils, the 1644 cm−1 band assigned to α-helix remarkably increased, and the bands around 1600 and 1668 cm−1 were reduced. The 1668 cm−1 band can be assigned to nonhydrogen-bonded amide groups in a turn/disordered structure (24). Because α-helix structure is formed by the hydrogen bonds between amide groups in the same strand, the increase in the α-helical contents indicates an increase in the intramolecular interactions. Moreover, the decrease in the band at 1600 cm−1 suggests a decrease in the intermolecular hydrogen bonds in an extended β-sheet. Therefore, it is plausible that insulin filaments harbor more intramolecular interactions than insulin fibrils.
The secondary structures of insulin fibrils and filaments were also investigated by means of Micro-Raman spectroscopy (Fig. 5). Fig. 5, B and C, show an expansion of the amide I region of the Raman spectra of insulin fibrils and filaments, respectively. In the amide I region, two spectra gave rise to a peak around 1675 cm−1, assigned to a β-sheet structure, although the peak at ∼1650–1700 cm−1 of the filament spectrum was broader than the corresponding part of the fibril spectrum. A component analysis was conducted according to a previous report (17), and the results are given in Table S2. In fibrils, the major contribution (55%) was from organized β-sheet structures, along with helix (15%) and loose β-strand/disordered (30%) structures (Fig. 5 B). In filaments, the contribution from organized β-sheet structures (40%) was lower, and the helical content (22%) was significantly higher (Fig. 5 C). These results are consistent with those obtained by IR spectral analysis.
Figure 5.
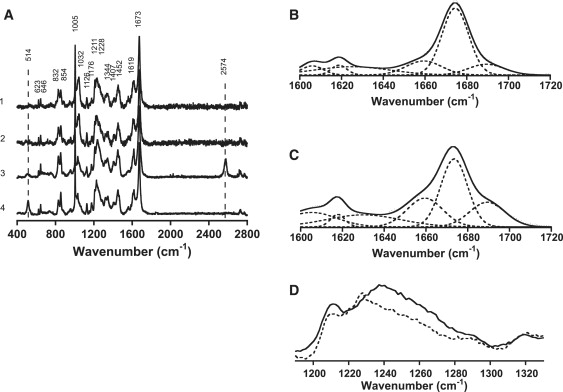
Raman studies of insulin fibrils and filaments. (A) Solid-state spectra of insulin fibrils and filaments formed in the absence and presence of 20 mM TCEP. Spectra were normalized relative to the 1673 cm−1 amide I band as an internal standard. 1) A-chain and B-chain incubated with TCEP. 2) A-chain and B-chain incubated without TCEP. 3) Insulin incubated with TCEP. 4) Insulin incubated without TCEP. Peak frequencies are indicated in the figure. The broken lines indicate S-S stretching frequencies centered at 514 cm−1 and S-H stretching frequencies at 2574 cm−1, respectively. (B and C) Expansion of the amide I Raman region with Gaussian deconvolution of insulin fibrils formed in the absence of TCEP (B) and filaments formed in the presence of TCEP (C). (D) Expansion of the amide III Raman region of insulin fibrils formed in the absence of TCEP (broken line) and insulin filaments in the presence of TCEP (solid line).
Of interest, in the ATR-FTIR spectra, a 1693 cm−1 peak was observed only for insulin filaments (Fig. 4 C), which suggests that the secondary structure of insulin filaments differs from that of insulin fibrils. Since this peak is assigned to an antiparallel β-sheet structure (15,21,22,25), these spectra suggest that insulin filaments induced by TCEP have an antiparallel β-sheet structure, whereas fibrils have a parallel β-sheet structure.
The antiparallel β-sheet structure of insulin filaments was also supported by Raman spectra (Fig. 5 D). The Raman intensity of the amide III region was stronger in insulin filaments than in insulin fibrils, which supports the antiparallel β-sheet structure.
Quantification of S-S bonds in insulin fibrils
Changes in the amount of S-S bonds in insulin fibrils were investigated by analyzing the S-S stretching frequencies centered at 514 cm−1 and the S-H stretching frequencies at 2574 cm−1 of the Raman spectra as previously described. As shown in Fig. 5 A, the peak area at 514 cm−1 decreased and the peak area at 2574 cm−1 increased upon addition of TCEP, strongly supporting the premise that TCEP actually reduced the disulfide bonds of insulin. The amounts of S-S bonds were estimated as peak area ratios of each band to the amide I band (1673 cm−1), respectively (18). The remaining S-S bonds in insulin filaments were roughly estimated to be 27%, 15%, and 13% for insulin incubated with 1, 5, or 20 mM TCEP, respectively, assuming that 100% S-S bond remained for insulin fibrils made without TCEP, and that 0% S-S bonds are present in fibrils made by insulin A- and B-chains (data not shown for Raman spectra of insulin filaments incubated with 1 and 5 mM TCEP). This result indicates that S-S bonds partially remained for insulin filaments.
Size exclusion chromatography of supernatants
To further confirm that the A- and B-chains of an insulin molecule treated with TCEP remained associated, gel filtration analysis of supernatants after centrifugation (15,000 rpm for 60 min) of an insulin sample incubated at 70°C for 13 h was carried out. As shown in Fig. 6, there was no separated B-chain in the supernatant of incubated insulin with TCEP, which indirectly supports the idea that the A- and B-chains of the insulin molecule treated with TCEP remained associated.
Figure 6.
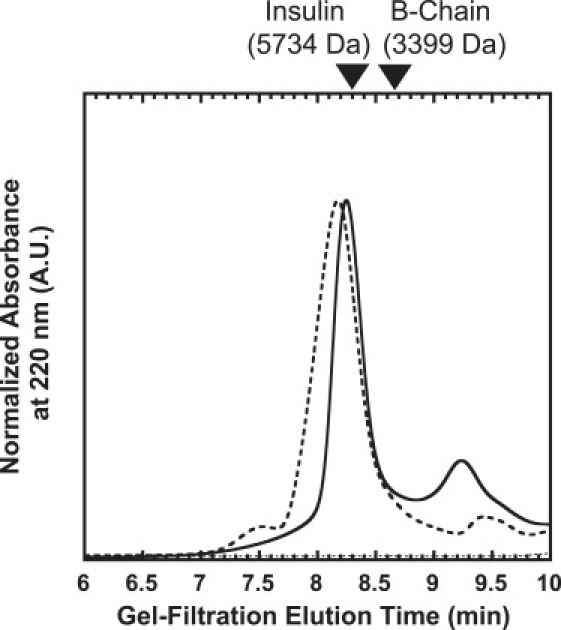
Size exclusion chromatography of supernatants of incubated insulin. After incubation of insulin in buffer A in the presence and absence of 20 mM TCEP at a protein insulin concentration of 2 mg/mL at 70°C for 13 h, the samples were centrifuged (15,000 rpm for 60 min). The 100 μL aliquots of supernatant, including 0.2 mg/mL insulin samples treated with TCEP (solid line) and without TCEP (broken line) diluted in the running buffer (45% acetonitrile and 0.1% TFA), were applied to a G2000SWXL high-performance liquid chromatography column at 25°C at a flow rate of 1.0 mL/min, and the absorbance of the sample was monitored at 220 nm. The 100 μL aliquots of buffer A diluted (1/5 dilution) in the running buffer were applied as a control (dotted line). Native insulin (5734 kDa) and insulin B-chain (3399 kDa) were used for marker samples.
Toxic assay
The cell toxicity of insulin fibrils and filaments in the PC12 pheochromocytoma cell line was examined with MTT assay (Fig. 7). Insulin fibrils showed dose-dependent cell toxicity as Aβ fibrils (26). Intriguingly, insulin filaments showed no detectable cell toxicity at the examined concentrations. To exclude the possibility of structural changes in insulin fibrils and/or filaments resulting from the incubation process (24 h in cell culture medium) in the toxicity assay, the persistence of both structures after incubation was confirmed by TEM observation and ThT assay (data not shown). These results imply that the morphology of insulin amyloid fibrils is correlated with their cell toxicity.
Figure 7.
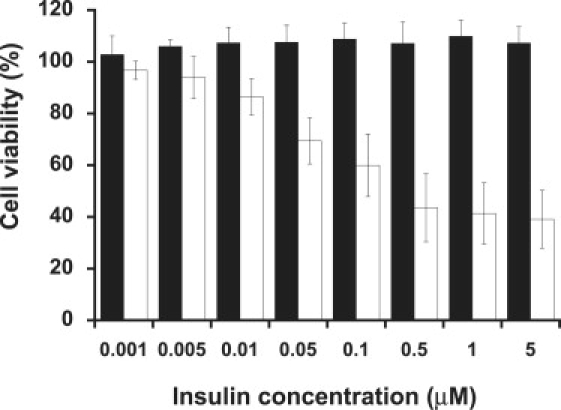
Cell toxicity of insulin fibrils and filaments. Cell viability was determined with the use of an MTT cell proliferation kit. PC12 cells were plated in 96-well plates at a density of 50,000 cells/well and grown overnight. Cells were then incubated in the absence (control) and presence of either insulin filaments (black) or insulin fibrils (white) dialyzed with PBS buffer at indicated concentrations.
Discussion
Insulin is composed of disulfide-linked peptides (A- and B-chains) and provides a model for nonneuropathic systemic amyloidoses and human diseases associated with amyloids (3,8). In such pathological processes, proteins lose their native structures and form fibrils. It has been proposed that bovine insulin fibrillation occurs though the dissociation of native oligomers into monomers, and that the monomers undergo a structural change to a partially folded intermediate that has a strong propensity for fibrillation. Thus, fibrillation of bovine insulin occurs readily at acidic pH (a condition favoring monomerization) (8,11).
The roles of the A- and B-chains have been investigated, and it was shown that a region in the B-chain is important for bovine insulin fibril formation (10). It was also demonstrated that the B-chain of bovine insulin forms straight fibrils under acidic conditions (12,13). The A-chain of bovine insulin was shown to form fibrils that differ from those of the B-chain fibrils and intact insulin fibrils in terms of diameter, helical repeat, and twist properties (12).
Although it is rarely observed in vivo, fibrillation of insulin has long complicated its manufacture and use in the treatment of diabetes mellitus. We chose to investigate the molecular basis of insulin fibrillation as a model for an important class of amyloidogenic proteins and in relation to cell toxicity. In this study, we demonstrated that bovine insulin forms flexible filaments in the presence of TCEP, which works as a reducing agent in acidic conditions. We investigated the structural characteristics and cell toxicity of these novel bovine insulin filaments and compared them with those of intact insulin fibrils.
Secondary structure
Proteins undergo cross-β assembly to form fibrils (4). Although they may have similar morphologies at EM resolution, polypeptides can exhibit different structural modes of cross-β assembly, differing in protofilament orientation (parallel or antiparallel), registry, and packing (27). In this study, we found that in the presence of TCEP, bovine insulin formed flexible filaments that were very different from intact insulin fibrils, as shown in Fig. 2. The far-UV CD spectra of these fibrils and filaments indicate the formation of typical β-structures (Fig. 3). It should be noted that the peak wavelength of insulin filaments (222 nm) was slightly different from that of insulin fibrils (225 nm). Although far-UV CD spectra have been used to detect β-structures of various amyloids (3,9,20,28), the peak positions differ depending on their parent proteins, which has not been discussed to date. However, our study suggests that CD spectra could reflect the morphological difference of amyloid fibrils and filaments from the same parent protein. Different binding properties of ThT and CR dyes on fibrils and filaments (Fig. 1) would also support the idea that insulin fibrils and filaments may differ in the stacking arrangement of β-strands, since these dyes were thought to bind specifically to the β-sheet arranged perpendicularly to the long axis of the fibrils (19). Most recently, luminescent conjugated polymers (LCPs) were introduced for the study of amyloid structures (29). It should be noted that LCPs were able distinguish different types of amyloid fibrils of Aβ in vitro and in vivo. Stabo-Eeg et al. (30) also reported that it is possible to distinguish conformational differences between amyloid fibrils formed from nonreduced and reduced insulin with separated A- and B-chains using an LCP. Thus, it would be interesting to examine the structural differences of insulin fibrils and filaments using these probes.
Further detailed analysis was carried out with the use of ATR-FTIR. FTIR spectroscopy has already been applied to elucidate amyloid fibril structure (21,23). Our results for ATR-FTIR spectra (Fig. 4) and secondary structure contents (summarized in Table S1) of insulin fibrils and filaments support the α-to-β conversion from native insulin, which is consistent with the results of CD spectra (Fig. 3) and micro-Raman spectroscopy (Fig. 5, B and C, and Table S2). It is notable that filaments exhibit a significantly lower content of organized β-sheet and a higher content of loose β-strand/disordered structure than fibrils (Table S2), which may be related to the formation of flexible insulin filaments.
Although insulin fibrils and filaments showed similarly high β-structure contents, a difference at ∼1695 cm−1 was evident (Fig. 4, B and C). A similar peak was observed for the aggregation of bovine insulin catalyzed by protein disulfide isomerase (31). Since this peak is assigned to the antiparallel β-sheet structure (15,21,22,25), this result suggests that bovine insulin can exhibit different orientation modes of cross-β assembly, i.e., an antiparallel β-sheet structure for insulin filaments induced by TCEP and a parallel β-sheet structure for insulin fibrils. This idea is supported by the results of structural studies of other amyloid fibrils, in which both FTIR and structural analyses were carried out. For example, Aβ34–42 and Aβ16–22 were shown to form antiparallel β-sheet structures by solid-state NMR (32,33) and to have an obvious 1695 cm−1 peak in FTIR spectra (34,35). On the other hand, Aβ10–35 and Aβ1–42, which form parallel β-sheet structures (36,37), showed a very weak peak, if any, at 1695 cm−1 in FTIR spectra (38,39). In a simulation study, it was found that a more stable antiparallel β-sheet structure could be expected when a clear band was observed at 1695 cm−1 (25). Together, the results of these studies strongly support our idea concerning bovine insulin.
The antiparallel β-sheet structure of insulin filaments can be confirmed with micro-Raman spectroscopy. As shown in Fig. 5, C and D, distinct amide I and III bands appeared at 1675 and 1240 cm−1, respectively, for insulin filaments formed in the presence of TCEP, which also supports the antiparallel β-sheet configuration (18,40).
Quantification of S-S bonds
To confirm the reduction of S-S bonds in insulin filaments by TCEP, the amounts of S-S bonds in insulin fibrils and filaments were examined by means of micro-Raman spectroscopy. Raman spectroscopy has been used to analyze S-S bonds of biological samples (18). As shown in Fig. 5 A, it was obvious that some S-S bonds remained in the insulin filaments formed in the presence of TCEP when compared with the data of insulin fibrils from a mixture of insulin A- and B-chains; ∼13% of the S-S bonds remained in insulin filaments formed in the presence of TCEP, even in the presence of excess TCEP.
The mixture of insulin A- and B-chains did not form filaments even in the presence of TCEP, but it did form fibrils similar to intact insulin fibrils (Fig. 2, C and D). The gel filtration chromatography analysis of supernatants after centrifugation of incubated insulin samples showed that the A- and B-chains of an insulin molecule treated with TCEP remained associated (Fig. 6). These results suggest that partial reduction of S-S bonds in bovine insulin induced formation of filaments. It is plausible that decreases in structural constraints for insulin molecules by partial reduction of S-S bonds might induce formation of a more flexible filamentous structure. This agrees well with previous studies of β2-microglobulins, which could not form typical amyloid fibrils when the disulfide bond was reduced, and instead formed immature protofibrils, indicating that the disulfide bond is important for amyloid fibril formation (28,41). However, further experiments, including mutagenesis studies of cysteine residues, will be needed to determine which disulfide bond(s) are responsible for the observed morphological differences between insulin fibrils and filaments. In a study by Mishra et al. (42), it was shown that nicked lysozyme by partial acid hydrolysis formed spherical oligomeric structures as fibrillation intermediate states that did not appear in the intact lysozyme fibrillation process. This result also supports the idea that partial cleavage of a protein could have a dramatic effect on its amyloid formation.
Low cell toxicity of insulin filaments
Fibrils made from proteins, such as Aβ, are known to be cytotoxic and cause various diseases (2,3). Of interest, insulin filaments showed no cell toxicity at the examined concentrations, whereas significant cell toxicity was observed for insulin fibrils at the same concentrations (Fig. 7).
Since our results indicate that morphologically different protein aggregations from the same parent protein exhibit different cell toxicities, it can be suggested that the morphology of protein fibrils is critical to the causation of cell death by amyloid fibrils. This idea is consistent with the recent notion that soluble oligomers, which usually are in an intermediate state before forming amyloid fibrils, are more toxic than fibrils (43). Various proteins, such as Aβ, α-synuclein, transthyretin, and nondisease-associated proteins, have been shown to form similar toxic oligomers (26,43,44). It is plausible that flexible insulin filaments do not damage the cell membrane, and therefore have only low toxicity. This idea is consistent with recent observations by Gharibyan et al. (45) that amyloid fibrils of hen lysozyme induce membrane damage leading to cell death. In addition, it has been reported that amyloid fibrils bind to several surface receptors, which is suggested to contribute cellular stress and toxicity (46). Thus it is also plausible that insulin filaments are not toxic, since they are not recognized by such surface receptors. Although these two possible reasons are not mutually exclusive, further studies are necessary to elucidate the low toxicity of insulin filaments.
Summary and Conclusions
In this study, we demonstrated that bovine insulin formed flexible filaments in the presence of TCEP. The insulin filaments, possibly formed due to partial reduction of S-S bonds in the insulin molecules, differ from the intact insulin fibrils in terms of their secondary structures. The insulin filaments were assigned to an antiparallel β-sheet structure, whereas the intact insulin fibrils had a parallel β-sheet structure. However, further studies are necessary to clarify their structural differences in detail. The distinct difference in cell toxicities supports the idea that the morphology of amyloid fibrils is correlated with their cellular toxicity. A detailed comparison between toxic fibril structures and nontoxic filamentous structures should shed new light on the mechanisms behind amyloid-associated diseases and possible pharmacological approaches to the various diseases caused by amyloid fibrils.
Supporting Material
Two tables are available at http://www.biophysj.org/biophysj/supplemental/S0006-3495(09)00486-X.
Supporting Material
Acknowledgments
We thank Drs. Yoshiaki Suzuki and Aiko Nakao of the RIKEN Beam Application Team, and Mr. Kazutoshi Kainuma of Atago Giken (Tokyo, Japan) for technical assistance with the Raman spectroscopy. We also thank Mr. Takao Sugaya of Systems Engineering (Tokyo, Japan) for his help with the FTIR, and Dr. Hiroshi Ueda of the University of Tokyo for his assistance with the toxic assay.
Funds for this research were provided by RIKEN (T.Z. and M.M.)
References
- 1.Dobson C.M. Protein folding and misfolding. Nature. 2003;426:884–890. doi: 10.1038/nature02261. [DOI] [PubMed] [Google Scholar]
- 2.Ross C.A., Poirier M.A. Protein aggregation and neurodegenerative disease. Nat. Med. 2004;10:S10–S17. doi: 10.1038/nm1066. [DOI] [PubMed] [Google Scholar]
- 3.Uversky V.N., Fink A.L. Conformational constraints for amyloid fibrillation: the importance of being unfolded. Biochim. Biophys. Acta. 2004;1698:131–153. doi: 10.1016/j.bbapap.2003.12.008. [DOI] [PubMed] [Google Scholar]
- 4.Blake C., Serpell L. Synchrotron X-ray studies suggest that the core of the transthyretin amyloid fibril is a continuous β-sheet helix. Structure. 1996;4:989–998. doi: 10.1016/s0969-2126(96)00104-9. [DOI] [PubMed] [Google Scholar]
- 5.Nilsson M.R. Techniques to study amyloid fibril formation in vitro. Methods. 2004;34:151–160. doi: 10.1016/j.ymeth.2004.03.012. [DOI] [PubMed] [Google Scholar]
- 6.Blundell T.L., Cutfield J.F., Cutfield S.M., Dodson E.J., Dodson G.G. Atomic positions in rhombohedral 2-zinc insulin crystals. Nature. 1971;231:506–511. doi: 10.1038/231506a0. [DOI] [PubMed] [Google Scholar]
- 7.Dische F.E., Wernstedt C., Westermark G.T., Westermark P., Pepys M.B. Insulin as an amyloid-fibril protein at sites of repeated insulin injections in a diabetic patient. Diabetologia. 1988;31:158–161. doi: 10.1007/BF00276849. [DOI] [PubMed] [Google Scholar]
- 8.Brange J., Andersen L., Laursen E.D., Meyn G., Rasmussen E. Toward understanding insulin fibrillation. J. Pharm. Sci. 1997;86:517–525. doi: 10.1021/js960297s. [DOI] [PubMed] [Google Scholar]
- 9.Ahmad A., Uversky V.N., Hong D., Fink A.L. Early events in the fibrillation of monomeric insulin. J. Biol. Chem. 2005;280:42669–42675. doi: 10.1074/jbc.M504298200. [DOI] [PubMed] [Google Scholar]
- 10.Nielsen L., Frokjaer S., Brange J., Uversky V.N., Fink A.L. Probing the mechanism of insulin fibril formation with insulin mutants. Biochemistry. 2001;40:8397–8409. doi: 10.1021/bi0105983. [DOI] [PubMed] [Google Scholar]
- 11.Nielsen L., Khurana R., Coats A., Frokjaer S., Brange J. Effect of environmental factors on the kinetics of insulin fibril formation: elucidation of the molecular mechanism. Biochemistry. 2001;40:6036–6046. doi: 10.1021/bi002555c. [DOI] [PubMed] [Google Scholar]
- 12.Devlin G.L., Knowles T.P., Squires A., McCammon M.G., Gras S.L. The component polypeptide chains of bovine insulin nucleate or inhibit aggregation of the parent protein in a conformation-dependent manner. J. Mol. Biol. 2006;360:497–509. doi: 10.1016/j.jmb.2006.05.007. [DOI] [PubMed] [Google Scholar]
- 13.Hong D.P., Fink A.L. Independent heterologous fibrillation of insulin and its B-chain peptide. Biochemistry. 2005;44:16701–16709. doi: 10.1021/bi051658y. [DOI] [PubMed] [Google Scholar]
- 14.Burns J.A., Butler J.C., Moran J., Whitesides G.M. Selective reduction of disulfides by Tris (2-carboxyethyl) phosphine. J. Org. Chem. 1991;56:2648–2650. [Google Scholar]
- 15.Krimm S., Bandekar J. Vibrational spectroscopy and conformation of peptides, polypeptides, and proteins. Adv. Protein Chem. 1986;38:181–364. doi: 10.1016/s0065-3233(08)60528-8. [DOI] [PubMed] [Google Scholar]
- 16.Wei J.A., Lin Y.Z., Zhou J.M., Tsou C.L. FTIR studies of secondary structures of bovine insulin and its derivatives. Biochim. Biophys. Acta. 1991;1080:29–33. doi: 10.1016/0167-4838(91)90107-b. [DOI] [PubMed] [Google Scholar]
- 17.Huang K., Maiti N.C., Phillips N.B., Carey P.R., Weiss M.A. Structure-specific effects of protein topology on cross-β assembly: studies of insulin fibrillation. Biochemistry. 2006;45:10278–10293. doi: 10.1021/bi060879g. [DOI] [PubMed] [Google Scholar]
- 18.Tu A.T. John Wiley; New York: 1982. Raman Spectroscopy in Biology: Principles and Applications. [Google Scholar]
- 19.Krebs M.R., Bromley E.H., Donald A.M. The binding of thioflavin-T to amyloid fibrils: localisation and implications. J. Struct. Biol. 2005;149:30–37. doi: 10.1016/j.jsb.2004.08.002. [DOI] [PubMed] [Google Scholar]
- 20.Yagi H., Kusaka E., Hongo K., Mizobata T., Kawata Y. Amyloid fibril formation of α-synuclein is accelerated by preformed amyloid seeds of other proteins: implications for the mechanism of transmissible conformational diseases. J. Biol. Chem. 2005;280:38609–38616. doi: 10.1074/jbc.M508623200. [DOI] [PubMed] [Google Scholar]
- 21.Seshadri S., Khurana R., Fink A.L. Fourier transform infrared spectroscopy in analysis of protein deposits. Methods Enzymol. 1999;309:559–576. doi: 10.1016/s0076-6879(99)09038-2. [DOI] [PubMed] [Google Scholar]
- 22.Bandekar J. Amide modes and protein conformation. Biochim. Biophys. Acta. 1992;1120:123–143. doi: 10.1016/0167-4838(92)90261-b. [DOI] [PubMed] [Google Scholar]
- 23.Zandomeneghi G., Krebs M.R., McCammon M.G., Fandrich M. FTIR reveals structural differences between native β-sheet proteins and amyloid fibrils. Protein Sci. 2004;13:3314–3321. doi: 10.1110/ps.041024904. [DOI] [PMC free article] [PubMed] [Google Scholar]
- 24.Jackson M., Mantsch H.H. The use and misuse of FTIR spectroscopy in the determination of protein structure. Crit. Rev. Biochem. Mol. Biol. 1995;30:95–120. doi: 10.3109/10409239509085140. [DOI] [PubMed] [Google Scholar]
- 25.Hahn S., Kim S.S., Lee C., Cho M. Characteristic two-dimensional IR spectroscopic features of antiparallel and parallel β-sheet polypeptides: simulation studies. J. Chem. Phys. 2005;123:084905. doi: 10.1063/1.1997151. [DOI] [PubMed] [Google Scholar]
- 26.Sakono M., Zako T., Ueda H., Yohda M., Maeda M. Formation of highly toxic soluble amyloid β oligomers by the molecular chaperone prefoldin. FEBS J. 2008;275:5982–5993. doi: 10.1111/j.1742-4658.2008.06727.x. [DOI] [PubMed] [Google Scholar]
- 27.Lynn D.G., Meredith S.C. Review: model peptides and the physicochemical approach to β-amyloids. J. Struct. Biol. 2000;130:153–173. doi: 10.1006/jsbi.2000.4287. [DOI] [PubMed] [Google Scholar]
- 28.Ohhashi Y., Hagihara Y., Kozhukh G., Hoshino M., Hasegawa K. The intrachain disulfide bond of β (2)-microglobulin is not essential for the immunoglobulin fold at neutral pH, but is essential for amyloid fibril formation at acidic pH. J. Biochem. (Tokyo) 2002;131:45–52. doi: 10.1093/oxfordjournals.jbchem.a003076. [DOI] [PubMed] [Google Scholar]
- 29.Nilsson K.P., Aslund A., Berg I., Nystrom S., Konradsson P. Imaging distinct conformational states of amyloid-β fibrils in Alzheimer's disease using novel luminescent probes. ACS Chem. Biol. 2007;2:553–560. doi: 10.1021/cb700116u. [DOI] [PubMed] [Google Scholar]
- 30.Stabo-Eeg F., Lindgren M., Nilsson K.P., Inganas O., Hammarstrom P. Quantum efficiency and two-photon absorption cross-section of conjugated polyelectrolytes used for protein conformation measurements with applications on amyloid structures. Chem. Phys. 2007;336:121–126. [Google Scholar]
- 31.Maeda R., Ado K., Takeda N., Taniguchi Y. Promotion of insulin aggregation by protein disulfide isomerase. Biochim. Biophys. Acta. 2007;1774:1619–1627. doi: 10.1016/j.bbapap.2007.08.016. [DOI] [PubMed] [Google Scholar]
- 32.Balbach J.J., Ishii Y., Antzutkin O.N., Leapman R.D., Rizzo N.W. Amyloid fibril formation by A β 16–22, a seven-residue fragment of the Alzheimer's β-amyloid peptide, and structural characterization by solid state NMR. Biochemistry. 2000;39:13748–13759. doi: 10.1021/bi0011330. [DOI] [PubMed] [Google Scholar]
- 33.Lansbury P.T., Costa P.R., Griffiths J.M., Simon E.J., Auger M. Structural model for the β-amyloid fibril based on interstrand alignment of an antiparallel-sheet comprising a C-terminal peptide. Nat. Struct. Biol. 1995;2:990–998. doi: 10.1038/nsb1195-990. [DOI] [PubMed] [Google Scholar]
- 34.Halverson K., Fraser P.E., Kirschner D.A., Lansbury P.T. Molecular determinants of amyloid deposition in Alzheimer's disease: conformational studies of synthetic β-protein fragments. Biochemistry. 1990;29:2639–2644. doi: 10.1021/bi00463a003. [DOI] [PubMed] [Google Scholar]
- 35.Petty S.A., Decatur S.M. Experimental evidence for the reorganization of β-strands within aggregates of the Aβ (16–22) peptide. J. Am. Chem. Soc. 2005;127:13488–13489. doi: 10.1021/ja054663y. [DOI] [PubMed] [Google Scholar]
- 36.Benzinger T.L., Gregory D.M., Burkoth T.S., Miller-Auer H., Lynn D.G. Propagating structure of Alzheimer's β-amyloid(10–35) is parallel β-sheet with residues in exact register. Proc. Natl. Acad. Sci. USA. 1998;95:13407–13412. doi: 10.1073/pnas.95.23.13407. [DOI] [PMC free article] [PubMed] [Google Scholar]
- 37.Luhrs T., Ritter C., Adrian M., Riek-Loher D., Bohrmann B. 3D structure of Alzheimer's amyloid-β (1–42) fibrils. Proc. Natl. Acad. Sci. USA. 2005;102:17342–17347. doi: 10.1073/pnas.0506723102. [DOI] [PMC free article] [PubMed] [Google Scholar]
- 38.Murakami K., Irie K., Morimoto A., Ohigashi H., Shindo M. Neurotoxicity and physicochemical properties of Aβ mutant peptides from cerebral amyloid angiopathy: implication for the pathogenesis of cerebral amyloid angiopathy and Alzheimer's disease. J. Biol. Chem. 2003;278:46179–46187. doi: 10.1074/jbc.M301874200. [DOI] [PubMed] [Google Scholar]
- 39.Paul C., Axelsen P.H. β-Sheet structure in amyloid β fibrils and vibrational dipolar coupling. J. Am. Chem. Soc. 2005;127:5754–5755. doi: 10.1021/ja042569w. [DOI] [PubMed] [Google Scholar]
- 40.Frushour B.G., Koenig J.L. Raman Spectroscopy of Proteins. In: Downey J.R., Jans G.J., editors. Advances in Infrared and Raman Spectroscopy. Heydon & Son; London: 1975. [Google Scholar]
- 41.Smith D.P., Radford S.E. Role of the single disulphide bond of β(2)-microglobulin in amyloidosis in vitro. Protein Sci. 2001;10:1775–1784. doi: 10.1110/ps.4901. [DOI] [PMC free article] [PubMed] [Google Scholar]
- 42.Mishra R., Sorgjerd K., Nystrom S., Nordigarden A., Yu Y.C. Lysozyme amyloidogenesis is accelerated by specific nicking and fragmentation but decelerated by intact protein binding and conversion. J. Mol. Biol. 2007;366:1029–1044. doi: 10.1016/j.jmb.2006.11.084. [DOI] [PubMed] [Google Scholar]
- 43.Kayed R., Head E., Thompson J.L., McIntire T.M., Milton S.C. Common structure of soluble amyloid oligomers implies common mechanism of pathogenesis. Science. 2003;300:486–489. doi: 10.1126/science.1079469. [DOI] [PubMed] [Google Scholar]
- 44.Sorgjerd K., Klingstedt T., Lindgren M., Kagedal K., Hammarstrom P. Prefibrillar transthyretin oligomers and cold stored native tetrameric transthyretin are cytotoxic in cell culture. Biochem. Biophys. Res. Commun. 2008;377:1072–1078. doi: 10.1016/j.bbrc.2008.10.121. [DOI] [PubMed] [Google Scholar]
- 45.Gharibyan A.L., Zamotin V., Yanamandra K., Moskaleva O.S., Margulis B.A. Lysozyme amyloid oligomers and fibrils induce cellular death via different apoptotic/necrotic pathways. J. Mol. Biol. 2007;365:1337–1349. doi: 10.1016/j.jmb.2006.10.101. [DOI] [PubMed] [Google Scholar]
- 46.Bamberger M.E., Harris M.E., McDonald D.R., Husemann J., Landreth G.E. A cell surface receptor complex for fibrillar β-amyloid mediates microglial activation. J. Neurosci. 2003;23:2665–2674. doi: 10.1523/JNEUROSCI.23-07-02665.2003. [DOI] [PMC free article] [PubMed] [Google Scholar]
Associated Data
This section collects any data citations, data availability statements, or supplementary materials included in this article.