

Abstract
The lipid matrix, or the lipid bilayer, of cell membranes is a natural binding site for amphipathic molecules, including antimicrobial peptides, pore-forming proteins, and many drugs. The unique property of pore-forming antimicrobial peptides is that they exhibit a threshold concentration (called the lethal concentration or the minimum inhibitory concentration) for activity, below which no effect is seen. Without this property, antimicrobial peptides would not be effective self-defense weapons, because they would have harmed all cells at any concentration. The question is what gives rise to this unique property? This study provides a free energy description for the origin of a threshold concentration. The same free energy applied differently also explains the binding of drugs that shows no threshold concentrations. The idea is compared with theories of micellar solutions that require a large oligomer size (n ⪞ 15) to achieve a threshold concentration. The elasticity of lipid bilayers makes the phenomena in membranes different. The majority of antimicrobial peptides have a large negative binding energy to the bilayer interface, but the binding causes an expansion in the membrane area, or equivalently a thinning in the membrane thickness. This elastic energy of membrane thinning elevates the energy level of interfacial binding with the peptide concentration, hence gives rise to a threshold concentration for forming pores containing as few as four peptides.
Introduction
Antimicrobial peptides (1) are small pore-forming proteins. They are water-soluble but will spontaneously bind to cell membranes and form stable transmembrane pores (2,3). There is now direct structural evidence for two types of peptide-induced pores. The majority of water-soluble antimicrobial peptides induce pores that are lined at least partially by lipid headgroups, called the toroidal model (4,5). Only alamethicin-like peptides induce pores lined entirely by helical peptides, called the barrel-stave model (6). An important characteristic of antimicrobial peptides is that they exhibit a threshold concentration for their activity, below which no effect is seen. In bactericidal and toxicity essays these thresholds are expressed as lethal concentrations (7), which are typically in the range of micromoles against microbes and one or two orders of magnitude higher against mammalian cells (7). This difference in the range of lethal concentrations, between that against microbial and mammalian cells, is understood as due to the different design features for the two types of membranes. The outer leaflet of microbial membranes is heavily populated by lipids of negatively charged headgroups, whereas the outer leaflet of mammalian membranes has no net charge (1). Thus antimicrobial peptides, which are cationic, are more effectively attracted to the microbial membranes than to mammalian membranes. However, despite such an electrostatic bias, these peptides would not be effective self-defense weapons if there is no concentration threshold for their activity. Without thresholds, they would attack all cell membranes, including that of the cells producing them, at any concentration.
Here we discuss specifically the cases where the initial binding of the peptides from solution to a lipid bilayer is on the water-lipid chain interface (8–12). (There are lipid bilayers, particularly that of saturated chains such as dilauroyl phosphatidylcholine (DLPC), which showed no detectable interfacial binding by peptides. For example, alamethicin in all experimental concentrations inserts perpendicularly in DLPC bilayers, equivalent to a zero lethal concentration. Such bilayer behaviors are perhaps irrelevant to cell membranes that are typically of lipid mixtures containing unsaturated chains (13).) There were no detectable changes in the permeability of the bilayer when peptides bound on the interface (2,14). Only when the bound peptide concentration exceeds a certain threshold value pore formation occurs (7,15–19). The following questions are asked: What is the driving force that changes the state of peptides from bound to the interface to pore formation? Why is there a concentration threshold for the onset of pore formation? This study discusses the free energy of this driving force that could give rise to a threshold concentration corresponding to experimental data. Naturally, for such complex systems, we try to focus only on the essential physics that accounts for the main effect. Recent experiments have shown similarity of pore-forming activities by antimicrobial peptides and by a major class of pore-forming proteins called α-pore-forming proteins (α-PFPs) (20–22). Based on this similarity, we will speculate on the driving force for pore-formation by α-PFPs.
The lipid matrix, or the lipid bilayer, of cell membranes is a natural binding site for amphipathic molecules, including peptides, proteins, and organic molecules such as amphipathic drugs. The basic assumption used in this study is that the same energetic principle should explain the binding states of all membrane-active molecules. A bound state in a fluid lipid bilayer is often subject to substantial variations, due to the flexibilities of both the binding molecule and the lipid molecules. A bound state and all of its thermal variations constitute a phase characterized by a chemical potential. Available experimental evidence suggests that there are at least two different phases for each binding molecule, one for binding on the interface and another for binding in the region of the hydrocarbon core of the lipid bilayer. This study also suggests that a two-phase model can adequately describe the experimental data. (This idea was expressed previously as a “two-state model” for antimicrobial peptides, intended to imply two types of states (18); we believe that “two-phase” is more appropriate.)
We take it as given that the amphipathic molecules under consideration spontaneously bind to lipid bilayers. This process often involves a conformational change of the binding molecule that is of great interest (particularly for pore-forming proteins) but will not be considered here. Our starting point is the initial bound state. The characteristic of amphipathic binding to a lipid bilayer, i.e., a molecular binding to the water-lipid chain interface, is an increase of the interfacial area. An increase of the interfacial area stretches the hydrocarbon core of the bilayer in the plane of the interface, therefore causes a decrease in the hydrocarbon thickness, due to the very low volume compressibility of the lipid chains (23). This membrane area increase can be measured in a giant unilamellar vesicle (GUV) experiment (2,24). The corresponding decrease of the membrane thickness can be measured by x-ray diffraction (2,25). The average free energy of a molecular binding from the solution to a lipid bilayer can be measured by isothermal titration calorimetry (ITC) (25,26). ITC measurements have shown that, if the electrostatic interaction is excluded, the free energies of binding to charged and neutral lipids by antimicrobial peptides are comparable (27). ITC can also detect a change of phase of the bound state but is not sensitive enough to measure the dependence of the binding energy on the concentration of the bound molecules in the bilayer (27). Much more sensitive to the bound molecules' concentration are the area change and the thickness change of the lipid bilayer. These two measurements are consistent with each other, as shown recently in two different examples, the bindings of curcumin (24,25) and melittin (2) to lipid bilayers. Between the GUV and x-ray experiments, the latter gives more accurate measurements. Therefore the thermodynamics of molecular binding will be discussed based on the membrane thickness measurements.
The effect of molecular binding on the membrane thickness has been systematically measured by x-ray diffraction for a number of antimicrobial peptides in many lipid compositions. Membrane thinning by peptide binding was found to be a common characteristic of peptide-membrane interactions, if the initial bound states were on the interface. Among the most extensively measured are three helical peptides alamethicin (28–31), magainin (32), and melittin (2,29,30), and one β-hairpin peptide protegrin (33). Although alamethicin and the other three peptides make two different types of pores, as mentioned above, all showed very similar membrane thinning effects as a function of the peptide concentration bound to the lipid bilayers. Recently this membrane thinning effect was investigated independently by x-ray reflectivity (34) using different membrane preparations. Although different lipid compositions were used, their results were in qualitative agreement with previous measurements by x-ray diffraction.
The effect of an amphipathic drug, curcumin, on membrane thickness has been measured recently (25). Curcumin does not induce pore formation in membranes (35), and its thinning effect is significantly different from that of antimicrobial peptides. Unlike antimicrobial peptides, curcumin has no threshold concentration for activity. Our condition for the free energy construction is that the same theory should be able to explain both cases.
In principle the theory should be able to explain the kinetics of molecular binding to lipid bilayers, such as dye leakage from lipid vesicles by antimicrobial peptides. This, however, is complicated by the stochastic nature of pore formation by peptides in membranes. Tamba and Yamazaki (3) observed individual GUVs exposed to magainin and found the leakage was a stochastic event. Once a GUV leaked, the leakage was completed in a few seconds while the GUV remained intact. In comparison, a suspension of vesicles exposed to magainin showed leakage lasting for 10 min or longer. Clearly it is difficult to relate the leakage experiments from vesicle suspensions to a molecular mechanism. So far the only related example that has been discussed is the rupture experiment of vesicles under mechanical tension that was analyzed by Evans et al. (36) by a dynamic tension spectroscopy. A similar consideration may be necessary for analyzing the vesicle leakage experiments in terms of a molecular model.
Thermodynamics of molecular binding to a lipid bilayer
Consider a bilayer of L lipid molecules in which NB membrane-active molecules of a certain species are bound. As mentioned above, we consider the cases that at low values of the amphipathic molecules are bound to the interface of the bilayer—we shall call this the interfacial binding phase, or the S-phase. Initially we have NB = NS; NS is the number of bound molecules in the S-phase, which can be measured directly by, e.g., oriented circular dichroism (37) or solid state NMR (17). At the low end of , all bound molecules are sufficiently separated from each other—each is essentially bound to a free bilayer—the S-phase is akin to an ideal gas of the bound molecules. The molecular binding will create a local deformation in the monolayer, extending over a range of several nm (the value depends on the elasticity moduli of the lipid bilayer) (38). Nevertheless the binding energy is negative, denoted as . As the value of increases, the interactions between the bound states will increase and the S-phase is then akin to an interacting gas. The interaction between two interfacial bound states begins at a separation distance when two local monolayer deformations overlap (39–41). There is a theoretical basis to believe that the interaction between interfacial bound states is repulsive (42). This repulsive nature of interaction, in the case of antimicrobial peptides, has been shown rigorously by fluorescence energy transfer experiments (18,43). Quantitative analysis of this interaction energy is difficult as a general case, but it simplifies at high values of . At above ∼, there is an overall membrane thinning due to the interfacial area increase caused by, in time average, uniformly distributed bound molecules. This assertion is based on the experimental fact that there is a well-defined average trans-bilayer electron density profile whose thickness decreases with , as will be further described in the next section. Our hypothesis is that in the regime of high (above ∼1/200) the interaction energy between the interfacial bound molecules is dominated by the elastic energy of the membrane thinning.
Concentration dependent measurements, including that of the peptide orientation by oriented circular dichroism (8,44) and by solid state NMR (17) as well as that of the membrane thickness by x-ray (25,28), made it apparent that all membrane-active molecules had at least two different phases of binding at high values of . In each of such measurements, there was an abrupt change in both the peptide orientation and membrane thinning as a function of . The second phase will be called the I-phase. For simplicity we assume that the I-phase is composed of monodisperse oligomeric states, each of n molecules. Note that in a solution, an oligomeric state implies a molecular aggregation, but in a lipid bilayer this is not necessarily so. For example, a toroidal pore may contain a number of peptides bound to the edge of the pore, but the individual peptides maybe separated by lipid molecules (4,5,15). This is important because most antimicrobial peptides are highly cationic (∼25% of their amino acids). Oligomeric states are very unlikely for these peptides if there is direct peptide-peptide contact.
We now consider the two-phase model at high values of where the S- and I-phases coexist. We extend the thermodynamic theory of micellar solutions (45) to molecules bound to lipid bilayers. In equilibrium NS molecules are distributed in the S-phase and Nn oligomeric states in the I-phase, so that NB = NS + nNn. Define and . The chemical potentials of the interfacial bound states in the S-phase and the oligomeric states in the I-phase are, respectively, given as
| (1) |
| (2) |
These expressions are the same as for micelles in solutions (45), except for the second term on the right hand side of Eq. 1. The last term of each chemical potential comes from the entropy of mixing (where kB is the Boltzmann constant and T the temperature). is the intrinsic binding energy per molecule for the bound states in the S-phase. is the energy per molecule for the bound states in the I-phase. What is unique for binding to a lipid bilayer is the second term on the right hand side of Eq. 1 that is derived as follows (29).
As mentioned above, the interfacial binding in the S-phase increases the interfacial area of the monolayer: let AS be the area increase (of the monolayer) by one molecule. With NS molecules bound in the S-phase, the total monolayer area increase is ΔA = NSAS. The total monolayer area of the pure lipid bilayer is A = ALL, where AL is the cross section area per lipid molecule. A fractional area expansion is a strain whose corresponding stress is the monolayer tension , where Ka is the bilayer stretch coefficient and is the monolayer stretch coefficient (46). Thus an increase of δNS molecules in the S-phase causes a change in the energy of the system where the second term is the elastic energy of area stretching. Thus the energy change per molecule in the S-phase is —the first two terms for Eq. 1. We assume that the bound states in the I-phase are inserted in the hydrocarbon region, where the energy of the state is independent of the presence of other bound molecules. We note that we have treated the two monolayers of the bilayer equally, i.e., as a symmetric bilayer. We have evidence that even when peptides or curcumin bound to a GUV from the external solution, the bound molecules were distributed equally in both monolayers (2,24).
Thermodynamic equilibrium requires that the chemical potential per molecule must be equal between the two phases, namely or . This equation gives
| (3) |
with , and . Because for the majority of available data, the number of bound molecules is much less than the number of lipid molecules, we will use the approximations and . Then we obtain a relation between Xn and XS:
| (4) |
From NB = NS + nNn or , we obtain
| (5) |
The bound molecule-to-lipid ratio is an experimental variable. If the constants a and b are determined, Eq. 5 predicts the value of XS for a given , for every value of n.
The membrane thickness measurement gives the fractional thickness change as a function of , where h is the thickness of the hydrocarbon region of the bilayer. To compare with the theory, we use the consequence of volume conservation for the hydrocarbon region (23), i.e.,
| (6) |
that connects the experimental value to the solution of Eq. 5, XS.
Comparison with experiment
It is important to make clear how the theory is going to be compared with the membrane thickness measurement. For phospholipids, their bilayer thickness is most conveniently measured by x-ray diffraction. The measured electron density profile across the bilayer peaks at the position of the phosphate group on each side of the bilayer. The peak-to-peak distance across the bilayer, denoted as PtP, can be measured precisely. The thickness of the hydrocarbon region is Å, or PtP minus twice the length of the glycerol region (from the phosphate to the first methylene of the hydrocarbon chains). This relation was found in pure lipid bilayers (47–49). Is this relation valid for the lipid bilayers containing bound molecules?
In addition to providing a precise measurement for PtP, x-ray diffraction also shows qualitative structural information about the bilayers (50). For example, if the quality of lipid bilayers deteriorates with increasing peptide concentration, the number of diffraction peaks would decrease. This was not the case for the experimental data used below (see Fig. 4 of Hung et al. (25) and Fig. 3 of Chen et al. (28)). This implied that the bound molecules were in average uniformly distributed in the plane of the bilayers, otherwise there would be nonequivalent domains or deteriorating diffraction patterns. When we examined the electron density profiles of lipid bilayers containing bound molecules (25,28–30), we found that that there was no significant change in the headgroup-glycerol region as the concentration of bound molecules increased from = 0 to ∼ —the main changes occurred in the central chain region and the peak-to-peak distance. Because the profile was averaged over the plane of the bilayer, the headgroup-glycerol region would have broadened if the bilayer thickness were significantly nonuniform or if the headgroups changed their configurations due to the bound peptides (see examples in Li and Salditt (34)). Instead, the experimental results indicated that the time-averaged structure of the bilayers was uniform with a well-defined bilayer thickness (despite the fact that the structure of the bilayer contained local deformations due to the bound peptides and pores) and there were no significant changes in the headgroup-glycerol configuration despite the inclusion of high peptide concentrations. The changes in the profile of the central chain region were the results of increasing chain disorder consistent with the compression (decrease) of the bilayer thickness (50). The vertical distance (i.e., normal to the plane of the bilayer) from the phosphate to the first methylene is ∼5 Å (47–49) as long as the majority of the glycerol backbones are more or less vertical, which should be the case for . Also in numerous measurements on lipid bilayers containing antimicrobial peptides (28–30), the PtP initially thinned by an amount ranging from 0.5 to 2 Å and then became almost constant with increasing concentrations of peptides, indicating no significant effect on the glycerol configuration by high concentrations of peptide binding. Thus there is no experimental evidence against the use of the relation Å for lipid bilayers containing molecules at . Recently we have shown that the values of measured by x-ray diffraction and using the relation Å agreed with the corresponding fractional area changes measured by GUV experiments, i.e., (2,35).
Figure 4.

(Top) Fractional thickness changes of DOPC bilayers containing melittin as a function of melittin/DOPC molar ratio. The data points were from Chen et al. (28). The solid curve was the solution of Eqs. 5 and 6 with n = 7, a = 2.0, and b = 313. (The b value is equivalent to AS = 280 Å2; the value AL = 74 Å2 was calculated by the volume of lipid chains divided by the h of free bilayer (28)). (Bottom) The values of XS (the number of melittin in the S-phase per lipid) and 7X7 (the number of melittin in the I-phase per lipid) from the solution of Eq. 5 above. The arrow indicates the threshold concentration for the I-phase.
Figure 3.
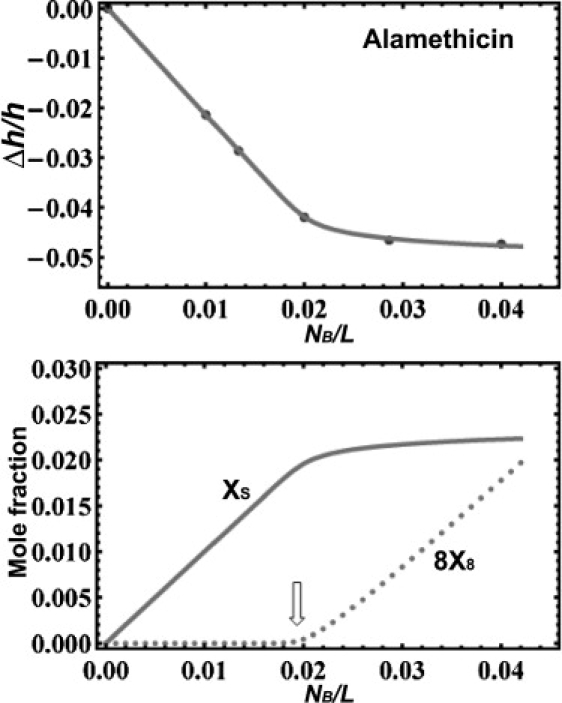
(Top) Fractional thickness changes of diphytanoyl phosphatidylcholine (DPhPC) bilayers containing alamethicin as a function of alamethicin/DPhPC molar ratio. The data points are from Chen et al. (28). The solid curve is the solution of Eqs. 5 and 6 with n = 8, a = −0.3, and b = 123. (The b value is equivalent to AS = 195 Å2; the value AL = 91 Å2 was calculated by the volume of lipid chains divided by the h of free bilayer (28)). (Bottom) The values of XS (the number of alamethicin in the S-phase per lipid) and 8X8 (the number of alamethicin in the I-phase per lipid) from the solution of Eq. 5. The arrow indicates the threshold concentration for the I-phase.
Besides the oligomeric factor n, the combination of Eqs. 5 and 6 contains only two unknown parameters, a and b, or equivalently (∈oS − ∈oI) and AS. The value of Ka has been measured independently by the GUV aspiration method; for most common phosphatidylcholines their values are all ∼240 mN/m (46). The value of AL is calculated from the chain volume (51) divided by the hydrocarbon thickness h of pure lipid bilayers. The theory will be compared with the data on the thinning of bilayers as a function of the bound molecular concentration, i.e., versus . The three parameters (a, b, and n) are determined as follows. Because the molecules initially bind to the S-phase, we have for small values of . From the initial slope of versus at small values of one obtains the value of AS (see Eq. 6), and from which the value of b. We then adjust the parameter a and the integral value n to fit the solution of Eq. 5 to the data versus .
To see the effect of the multiplicity n, we show in Fig. 1 versus by solving Eq. 5 for values n = 1,2,3,…,8 with the values a and b taken from the melittin example. (The details of melittin binding will be described in further detail below.) The point is to simply note that increasing n from 1 to ∼5 drastically changes the shape of the curve for versus . The changes of the shape become insignificant for n > 5. The differences are most likely indistinguishable by experimental data.
Figure 1.
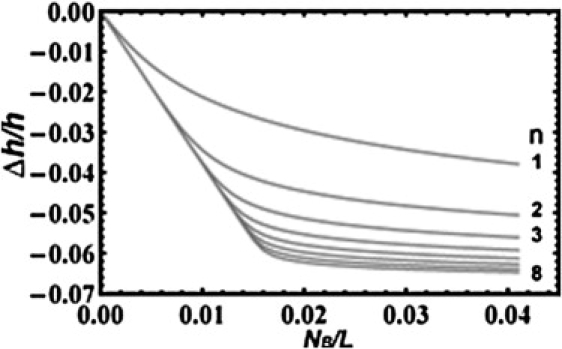
Illustration of the effect of n on the membrane thinning curve. The solution of Eq. 5, XS as a function of , for n = 1,2,3,…,8 is substituted into Eq. 6 and plotted sequentially from top to bottom. The parameters a and b in Eqs. 5 and 6 were taken from the melittin example described in Fig. 4 legend.
We now compare the theory with three membrane-binding molecules: curcumin, alamethicin and melittin. These three molecules have the best membrane-thinning data in terms of quality and the range of . In the case of alamethicin and melittin, the data are available in many lipid compositions, including lipid mixtures (19,28–30). The general features of these peptide data are similar, so one example for each peptide is sufficient for our purpose.
Curcumin
Curcumin (MW 368 g/mol) is a natural compound extracted from rhizomes of turmeric, used commonly for centuries as a yellow spice (curry). It has long been reported to be biologically active (52), and has been found to accumulate in cell membranes (53). In GUV experiments, curcumin was found to spontaneously bind to lipid bilayers but did not affect the membrane permeability even at high concentrations. No leakage was detected in GUVs with curcumin concentrations up to an equivalence of curcumin/lipid molar ratio = 0.324 (35). We compare our model theory with the membrane thickness measurement for dioleoyl phosphatidylcholine (DOPC) bilayers containing curcumin up to ∼0.1 (25), the valid range of the theory. We found that the model (Eqs. 5 and 6) fits the data quite well with n = 1, a = 1.9, and b = 293 as shown in Fig. 2. (The value of b corresponds to AS = 270 Å2. Independently the pure DOPC bilayer thickness gave AL = 74 Å2.) The model with n > 1 would not fit the data at all. Although curcumin is not related to pore-forming peptides, its simple binding states serve as a reference for the more complex molecular bindings by peptides.
Figure 2.

(Top) Fractional thickness changes of DOPC bilayers containing curcumin as a function of curcumin/DOPC molar ratio. The data points were from Hung et al. (25). The solid curve was the solution of Eqs. 5 and 6, with n = 1, a = 1.9, and b = 293. (The b value is equivalent to AS = 270 Å2; the value AL = 74 Å2 was calculated by the volume of lipid chains divided by the h of free bilayer (25)). (Bottom) The values of XS (the mole fraction of curcumin in the S-phase per lipid) and X1 (the mole fraction of curcumin in the I-phase per lipid) from the solution of Eq. 5.
The molecular conformation of curcumin is unknown in its bound states. But the agreement between its thinning data with the simple theoretical model above sheds some light on the nature of binding. Curcumin binds to lipid bilayers as monomers both in the S and I-phases (n= 1). The assumptions that the initial bindings are on the interface (hence thinning the membrane) and that the I-phase is in the hydrocarbon region (no thinning effect) are consistent with the data. The mole fractions of curcumin molecules in the S-phase and the I-phase, expressed as XS and X1, respectively, are shown in Fig. 2. Although the S-phase occupancy initially dominates, the I-phase occupancy steadily increases with and becomes dominant above ∼0.015. There is no concentration threshold for entering the I-phase.
Alamethicin
Alamethicin is a 20-residue long, bent helix (including a Pro14) (54,55). This peptide is distinct from almost all other pore-forming peptides (1): eight out of its 20 amino acids are the unusual residues α-aminoisobutyric acids; it is weakly charged and has low water solubility; and it produces well-defined, discrete single channel conductance (56,57). However, its binding behavior in lipid bilayers is very similar to other helical antimicrobial peptides such as melittin that will be discussed below. Measurements by oriented circular dichroism showed its helical axis parallel to the bilayers in the S-phase and perpendicular to the bilayers in the I-phase (8,58). Neutron in-plane scattering showed that alamethicin formed transmembrane pores in the I-phase (59,60). The major behavioral difference between alamethicin and the other well-studied antimicrobial peptides is that alamethicin forms barrel-stave pores instead of toroidal pores (6,59,60). At extremely low peptide concentrations, alamethicin forms transient single channels measurable by ion conduction, which fluctuate among well defined conduction levels interpreted as consisting of n = 5,6,7,…, monomers (56,57). At peptide concentrations effective for antimicrobial activity (i.e., when the I-phase appeared), pores were always formed in massive numbers and they appeared to have a well-defined size as detected by neutron in-plane scattering (6,60). The pore size depends somewhat on the lipid compositions (60), but typically consisting of n = 8, with a water channel of 1.8 nm in diameter and an outer diameter of 4.0 nm (6,60).
The thinning data on diphytanoyl phosphatidylcholine (DPhPC) bilayers by alamethicin (28) fit very well with the model at n = 8 (with a = −0.3 and b = 123; the b value corresponds to AS = 195 Å2. Independently the pure DPhPC bilayer thickness gave AL = 91 Å2) (Fig. 3). The data also fit the model well with n = 7 and a = −0.2, or with n = 6 and a = −0.1.The value, b = 123, is the same for all, because it was determined via AS by the initial slope of versus at small values of . The quality of the data needs to be much higher to distinguish n = 6, 7, and 8. However, the precise values of these parameters are not the issue in this discussion; rather our purpose is to show a mechanism that can explain the lethal concentrations of antimicrobial peptides. The most important consequence of the n = 6, 7, or 8 fitting is the appearance of a concentration threshold for the I-phase. Fig. 3 shows the mole fractions of alamethicin in the S-phase, XS, and in the I-phase, 8X8. There is no alamethicin in the I-phase for concentrations below ∼0.02, a clear threshold for pore formation.
The threshold concentration for the I-phase varies widely with lipid compositions. The example DPhPC (Fig. 3) and other lipid compositions (29,30) were chosen for having the threshold concentrations in a range (∼1/100 < <1/10) convenient for experiment. On the other hand, alamethicin showed no thinning effect in DLPC and DMPC (34). As noted by Li and Salditt (34), this was not a contradiction to the membrane thinning effect discussed above. It has been known that alamethicin has an extremely low threshold concentration for the I-phase in DLPC and DMPC—alamethicin was found inserted perpendicularly in the bilayers at all measurable concentrations (as long as the lipids were in the fluid phase) (8). In our theory, we have assumed that, to the first order approximation, there is no thinning effect from the molecular binding in the I-phase. In contrast the threshold concentrations in bilayers of unsaturated chains are usually high (at > 1/1000), so that the thinning effect was often observed in unsaturated lipids.
Melittin
Melittin, a 26-residue linear peptide extracted from bee venom (61), is one of the most studied membrane-active peptides (5,27,62,63). When bound to a lipid bilayer the peptide is helical according to circular dichroism (5), probably a bent α-helical rod (the bend is due to a Pro14) as in its crystal structure (64,65). Oriented circular dichroism showed that the helical axis is parallel to the plane of bilayer in the S-phase, but turns to the perpendicular orientation in the I-phase (28). In the I-phase, melittin forms well-defined stable pores in GUVs (2). The pore has a water channel of 4.4 nm in diameter as determined by neutron in-plane scattering (5), and its property is consistent with the toroidal model (4,5). The membrane thinning on DOPC bilayers by melittin (28) fit Eqs. 5 and 6 with n= 7 (and a = 2.0, b = 313; the b value corresponds to AS = 280 Å2. AL = 74 Å2 was obtained independently from the pure DOPC bilayer thickness) as shown in Fig. 4. The data also fit the model with n = 8, a = 1.9; n = 6, a = 2.1; or n = 5, a = 2.3. Note that b = 313 is the same for all, because it was determined via AS by the initial slope of versus at small values of .
In analogous to alamethicin, the most important consequence of the fits from n = 5 to n = 8 is the appearance of a concentration threshold for the I-phase. Fig. 4 shows the mole fractions of melittin in the S-phase, XS, and in the I-phase, 7X7. There are no melittin in the I-phase for concentrations below 0.015, a clear threshold for pore formation.
Discussion
Driving force for pore formation and threshold concentrations
In Figs. 3 and 4, each peptide shows a threshold concentration for the onset of the I (pore) phase. Below this threshold, there are practically no peptides in the I-phase. But once the peptide concentration exceeds the threshold, multiple pores are formed in the membrane. Although these threshold concentrations deduced from the membrane thinning data correlated with a corresponding peptide orientation change observed by oriented circular dichroism (28,29) and also with the detection of pores by neutron in-plane scattering (5,15,60), they were all measured in stacks of parallel bilayers at a humidity level close to full hydration. One might wonder if these threshold values are the same as one would obtain from single membranes in solution. For this reason, a GUV experiment was carried out recently to measure the value of when the pore formation occurred. The experiment was setup so that the of a GUV initially increased as melittin bound to the membrane from solution, but decreased as the pores began to form (2). In two different lipids, we found the values of pore-forming agreed with the corresponding threshold values measured by x-ray diffraction from a stack of multiple bilayers (2). The bound peptide concentration in lipid bilayers is related to the peptide concentration in solution by the partition coefficient (26,66). The lethal concentration in the solution is the threshold concentration in the membrane divided by the partition coefficient of the antimicrobial peptide with respect to the membrane.
In the literature, the toroidal model and the barrel-stave model were often portrayed as two different mechanisms for pore formation. This study shows that the mechanisms for the two types of pores are the same. The thermodynamics for two types of pores only differ in the energy of pore formation . It is obvious that the reason the peptides form pores is that the pore is the lowest-energy configuration for the peptides to bind in the bilayer other than the interfacial binding. For alamethicin the lowest-energy configuration is a barrel-stave pore, whereas for melittin and other cationic antimicrobial peptides it is a toroidal pore. Apparently the peptide orientation could vary in a toroidal pore, from parallel to tilted relative to the bilayer normal, to adopt the lowest energy state according to the physical condition of the lipid bilayer (67,68).
In biochemistry, when a dose-response curve rises from zero to a maximum in a sigmoidal fashion over a short range of the dose concentration, it is called a cooperative response (69). Bactericidal assays (1) and vesicle leakage (70) induced by antimicrobial peptides have been described as cooperative with a threshold peptide concentration in the micromolar range. The simplest way to give rise to a cooperativity is a reaction from monomers to oligomeric aggregates, like micellar phenomena (45). Indeed the cooperativity of the antimicrobial peptides' activities has been attributed to the formation of pores consisting of n monomers (10,71).
A two-level micellar solution (45,72) is described by Eqs. 1 and 2, without the second term on the right hand side of Eq. 1—equivalent to Ka = 0 (i.e., b = 0). In Fig. 5 we compare our model with a two-level micellar reaction. Indeed a two-level micellar model can produce a concentration threshold for the formation of micelles, but there are important differences between the two models. In our model if the pore consists of four or more peptides (n ≥ 4) the concentration dependence would show a clear threshold. In contrast a two-level micellar model requires n = 15 or greater to have a similar threshold, irrespective of the value of a (72) (Fig. 5). By experiments, the alamethicin pore has been determined to consist of eight alamethicin monomers (6,60); the toroidal pores were determined to contain four to seven peptide monomers (5,15). There is no evidence for pores consisting of 15 or more peptides.
Figure 5.
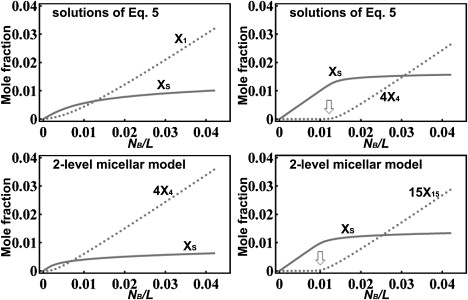
(Top row) The number of bound molecules per lipid in the S-phase, XS, and in the I-phase, nXn, from our model (Eq. 5) for n = 1 and 4. The parameters a = 2.0 and b = 313 are the same as in Fig. 4. A concentration threshold (arrow) is evident for n = 4. (Bottom row) The solution of Eq. 5 if b = 0 (equivalent to Ka = 0), a = −3.9 for n = 4 and 15. There is no clear threshold for nXn if n = <15, irrespective of the value of a. A threshold concentration (arrow) begins to appear for n = ≥15.
Note that in a two-level micellar model, the cooperativity (or the driving force for forming the micelles) comes from (in the example the micellar model, shown in the bottom row of Fig. 5, has a = −3.9), i.e., energetically peptides prefer micelles to monomers. It is the entropic effect that keeps the peptides in the S-phase at low . The thermodynamics of our model is very different: here the binding energy is lower than or, in the case of alamethicin, comparable, so the interfacial binding (the S-phase) is energetically preferred by the peptides. The driving force toward the pore formation (the I-phase) is the membrane thinning effect (the second term on the right hand side of Eq. 1) that raises the energy level (μS) of the S-phase with concentration. This driving force produces a threshold concentration for forming pores containing as few as four peptides.
It would be interesting to measure the constants a and b independently, for instance by molecular dynamics. The constant b is essentially determined by the interfacial area expansion AS per peptide. We have noted that AS is in general not the physical cross section of the peptide (29). This is because the headgroup region of a lipid bilayer includes associated water molecules. Binding of a peptide can increase or decrease the number of associated water molecules that would directly affect the value of AS (29). The constant a measures the difference of the two binding energies . We believe that a careful measurement by ITC (27) can provide an estimate for this value. The difference of the a value between melittin () and alamethicin () reflects the difference between the two types of peptides. Melittin that represents cationic, water-soluble antimicrobial peptides forms toroidal pores, whereas alamethicin, a more hydrophobic peptide, forms barrel-stave pores. However, the value of a does not reflect the pore-forming capability of a molecule. Curcumin and melittin both have a second phase of binding (the I-phase) besides the interfacial binding phase (the S-phase) and have comparable a values, but curcumin does not form pores. What properties enable a molecule to form transmembrane pores have not been clearly identified despite the availability of so many different pore-forming peptides (1). A clear understanding of how amphipathic molecules interact with lipid bilayers, including the pore-forming capability, might inspire molecular designs for synthetic antimicrobial therapeutics as well as agents for gene delivery and drug delivery.
α-Pore-forming proteins
In recent years an increasing number of water-soluble pore-forming proteins have been discovered (73,74). These proteins are of interest for their ability of regulating translocation of molecules across membranes, for their unusual sequence-structure relationships, and also for their potential applications in biotechnology and nanotechnology (75). The pore-forming proteins that have been investigated roughly fall into two distinct classes. One class of which, whose secondary structures are predominantly β-sheets, form crystallizable porin-like transmembrane β-barrel pores, e.g., Staphylococcal α-hemolysin (76). Another class whose secondary structures are predominantly α-helical segments form pores without a crystallizable protein assembly, e.g., colicins (20) and diphtheria toxin (77). The pore structures for this latter class α-pore-forming proteins (α-PFPs) have long been a puzzle, for unlike β-strands, α-helices can not hydrogen-bond side-by-side to form a bonded barrel structure. The class of α-PFPs now includes the Bcl-2 family of apoptosis-regulating proteins, notably Bax (78) that activates pore formation in the outer mitochondria membrane to release the apoptotic factor cytochrome c. Recent studies have shown that the pore forming properties of α-toxins (73) and Bax (21,22) are similar to that of antimicrobial peptides.
The structure of Bax (79) is closely similar to the pore-forming domain of colicins (20) or diphtheria toxin (77). Each consists of seven or more amphipathic α-helical segments. It is speculated that when an α-PFP binds to the membrane, most of these peptide segments are bound to the interface (20,78,80). These bound peptide segments are confined to a small area of membrane because they are linked. Thus in a local region of membrane even a small number of α-PFPs can create the effect of a high concentration of amphipathic peptides, which is the condition for pore formation as explained by the free energy of peptide-membrane interactions. This could explain the similarity of pore-forming activity between peptides and α-PFPs.
Acknowledgments
This work was supported by National Institutes of Health (grant GM55203) and the Robert A. Welch Foundation (grant C-0991).
References
- 1.Zasloff M. Antimicrobial peptides of multicellular organisms. Nature. 2002;415:389–395. doi: 10.1038/415389a. [DOI] [PubMed] [Google Scholar]
- 2.Lee M.T., Hung W.C., Chen F.Y., Huang H.W. Mechanism and kinetics of pore formation in membranes by water-soluble amphipathic peptides. Proc. Natl. Acad. Sci. USA. 2008;105:5087–5092. doi: 10.1073/pnas.0710625105. [DOI] [PMC free article] [PubMed] [Google Scholar]
- 3.Tamba Y., Yamazaki M. Single giant unilamellar vesicle method reveals effect of antimicrobial peptide magainin 2 on membrane permeability. Biochemistry. 2005;44:15823–15833. doi: 10.1021/bi051684w. [DOI] [PubMed] [Google Scholar]
- 4.Qian S., Wang W., Yang L., Huang H.W. Structures of transmembrane pores induced by Bax derived peptides: evidence for lipidic pores. Proc. Natl. Acad. Sci. USA. 2008;105:17379–17383. doi: 10.1073/pnas.0807764105. [DOI] [PMC free article] [PubMed] [Google Scholar]
- 5.Yang L., Harroun T.A., Weiss T.M., Ding L., Huang H.W. Barrel-stave model or toroidal model? a case study on melittin pores. Biophys. J. 2001;81:1475–1485. doi: 10.1016/S0006-3495(01)75802-X. [DOI] [PMC free article] [PubMed] [Google Scholar]
- 6.Qian S., Wang W., Yang L., Huang H.W. Structure of the alamethicin pore reconstructed by X-ray diffraction analysis. Biophys. J. 2008;94:3512–3522. doi: 10.1529/biophysj.107.126474. [DOI] [PMC free article] [PubMed] [Google Scholar]
- 7.Merrifield R.B., Merrifield E.L., Juvvadi P., Andreu D., Boman H.G. Design and synthesis of antimicrobial peptides. In: Boman H.G., Marsh J., Goode J.A., editors. Antimicrobial Peptides. John Wiley & Sons; Chichester: 1994. pp. 5–26. [PubMed] [Google Scholar]
- 8.Huang H.W., Wu Y. Lipid-alamethicin interactions influence alamethicin orientation. Biophys. J. 1991;60:1079–1087. doi: 10.1016/S0006-3495(91)82144-0. [DOI] [PMC free article] [PubMed] [Google Scholar]
- 9.Bechinger B., Kim Y., Chirlian L.E., Gesell J., Neumann J.M. Orientations of amphipathic helical peptides in membrane bilayers determined by solid-state NMR spectroscopy. J. Biomol. NMR. 1991;1:167–173. doi: 10.1007/BF01877228. [DOI] [PubMed] [Google Scholar]
- 10.Matsuzaki K., Murase O., Tokuda H., Funakoshi S., Fujii N. Orientational and aggregational states of magainin 2 in phospholipid bilayers. Biochemistry. 1994;33:3342–3349. doi: 10.1021/bi00177a027. [DOI] [PubMed] [Google Scholar]
- 11.Williams R.W., Starman R., Taylor K.M., Gable K., Beeler T. Raman spectroscopy of synthetic antimicrobial frog peptides magainin 2a and PGLa. Biochemistry. 1990;29:4490–4496. doi: 10.1021/bi00470a031. [DOI] [PubMed] [Google Scholar]
- 12.Hirsh D.J., Hammer J., Maloy W.L., Blazyk J., Schaefer J. Secondary structure and location of a magainin analogue in synthetic phospholipid bilayers. Biochemistry. 1996;35:12733–12741. doi: 10.1021/bi961468a. [DOI] [PubMed] [Google Scholar]
- 13.Gennis R. Springer-Verlag; New York: 1989. Biomembranes. [Google Scholar]
- 14.Steiner H., Andreu D., Merrifield R.B. Binding and action of cecropin and cecropin analogues: antibacterial peptides from insects. Biochim. Biophys. Acta. 1988;939:260–266. doi: 10.1016/0005-2736(88)90069-7. [DOI] [PubMed] [Google Scholar]
- 15.Ludtke S.J., He K., Heller W.T., Harroun T.A., Yang L. Membrane pores induced by magainin. Biochemistry. 1996;35:13723–13728. doi: 10.1021/bi9620621. [DOI] [PubMed] [Google Scholar]
- 16.Matsuzaki K., Murase O., Fujii N., Miyajima K. An antimicrobial peptide, magainin 2, induced rapid flip-flop of phospholipids coupled with pore formation and peptide translocation. Biochemistry. 1996;35:11361–11368. doi: 10.1021/bi960016v. [DOI] [PubMed] [Google Scholar]
- 17.Glaser R.W., Sachse C., Durr U.H., Wadhwani P., Afonin S. Concentration-dependent realignment of the antimicrobial peptide PGLa in lipid membranes observed by solid-state 19F-NMR. Biophys. J. 2005;88:3392–3397. doi: 10.1529/biophysj.104.056424. [DOI] [PMC free article] [PubMed] [Google Scholar]
- 18.Huang H.W. Action of antimicrobial peptides: two-state model. Biochemistry. 2000;39:8347–8352. doi: 10.1021/bi000946l. [DOI] [PubMed] [Google Scholar]
- 19.Huang H.W. Molecular mechanism of antimicrobial peptides: the origin of cooperativity. Biochim. Biophys. Acta. 2006;1758:1292–1302. doi: 10.1016/j.bbamem.2006.02.001. [DOI] [PubMed] [Google Scholar]
- 20.Zakharov S.D., Kotova E.A., Antonenko Y.N., Cramer W.A. On the role of lipid in colicin pore formation. Biochim. Biophys. Acta. 2004;1666:239–249. doi: 10.1016/j.bbamem.2004.07.001. [DOI] [PubMed] [Google Scholar]
- 21.Basanez G., Sharpe J.C., Galanis J., Brandt T.B., Hardwick J.M. Bax-type apoptotic proteins porate pure lipid bilayers through a mechanism sensitive to intrinsic monolayer curvature. J. Biol. Chem. 2002;277:49360–49365. doi: 10.1074/jbc.M206069200. [DOI] [PubMed] [Google Scholar]
- 22.Terrones O., Antonsson B., Yamaguchi H., Wang H.G., Liu J. Lipidic pore formation by the concerted action of proapoptotic BAX and tBID. J. Biol. Chem. 2004;279:30081–30091. doi: 10.1074/jbc.M313420200. [DOI] [PubMed] [Google Scholar]
- 23.Seemann H., Winter R. Volumetric properties, compressibilities, and volume fluctuations in phospholipid-cholesterol bilayers. Z. Phys. Chem. 2003;217:831–846. [Google Scholar]
- 24.Sun Y., Lee C.C., Hung W.C., Chen F.Y., Lee M.T. The bound states of amphipathic drugs in lipid bilayers: study of curcumin. Biophys. J. 2008;95:2318–2324. doi: 10.1529/biophysj.108.133736. [DOI] [PMC free article] [PubMed] [Google Scholar]
- 25.Hung W.C., Chen F.Y., Lee C.C., Sun Y., Lee M.T. Membrane-thinning effect of curcumin. Biophys. J. 2008;94:4331–4338. doi: 10.1529/biophysj.107.126888. [DOI] [PMC free article] [PubMed] [Google Scholar]
- 26.Seelig J. Titration calorimetry of lipid-peptide interactions. Biochim. Biophys. Acta. 1997;1331:103–116. doi: 10.1016/s0304-4157(97)00002-6. [DOI] [PubMed] [Google Scholar]
- 27.Wenk M.R., Seelig J. Magainin 2 amide interaction with lipid membranes: calorimetric detection of peptide binding and pore formation. Biochemistry. 1998;37:3909–3916. doi: 10.1021/bi972615n. [DOI] [PubMed] [Google Scholar]
- 28.Chen F.Y., Lee M.T., Huang H.W. Evidence for membrane thinning effect as the mechanism for peptide-induced pore formation. Biophys. J. 2003;84:3751–3758. doi: 10.1016/S0006-3495(03)75103-0. [DOI] [PMC free article] [PubMed] [Google Scholar]
- 29.Lee M.T., Chen F.Y., Huang H.W. Energetics of pore formation induced by membrane active peptides. Biochemistry. 2004;43:3590–3599. doi: 10.1021/bi036153r. [DOI] [PubMed] [Google Scholar]
- 30.Lee M.T., Hung W.C., Chen F.Y., Huang H.W. Many-body effect of antimicrobial peptides: on the correlation between lipid's spontaneous curvature and pore formation. Biophys. J. 2005;89:4006–4016. doi: 10.1529/biophysj.105.068080. [DOI] [PMC free article] [PubMed] [Google Scholar]
- 31.Wu Y., He K., Ludtke S.J., Huang H.W. X-ray diffraction study of lipid bilayer membrane interacting with amphiphilic helical peptides: diphytanoyl phosphatidylcholine with alamethicin at low concentrations. Biophys. J. 1995;68:2361–2369. doi: 10.1016/S0006-3495(95)80418-2. [DOI] [PMC free article] [PubMed] [Google Scholar]
- 32.Ludtke S., He K., Huang H. Membrane thinning caused by magainin 2. Biochemistry. 1995;34:16764–16769. doi: 10.1021/bi00051a026. [DOI] [PubMed] [Google Scholar]
- 33.Heller W.T., Waring A.J., Lehrer R.I., Harroun T.A., Weiss T.M. Membrane thinning effect of the beta-sheet antimicrobial protegrin. Biochemistry. 2000;39:139–145. doi: 10.1021/bi991892m. [DOI] [PubMed] [Google Scholar]
- 34.Li C., Salditt T. Structure of magainin and alamethicin in model membranes studied by x-ray reflectivity. Biophys. J. 2006;91:3285–3300. doi: 10.1529/biophysj.106.090118. [DOI] [PMC free article] [PubMed] [Google Scholar]
- 35.Reference deleted in proof.
- 36.Evans E., Heinrich V., Ludwig F., Rawicz W. Dynamic tension spectroscopy and strength of biomembranes. Biophys. J. 2003;85:2342–2350. doi: 10.1016/s0006-3495(03)74658-x. [DOI] [PMC free article] [PubMed] [Google Scholar]
- 37.Wu Y., Huang H.W., Olah G.A. Method of oriented circular dichroism. Biophys. J. 1990;57:797–806. doi: 10.1016/S0006-3495(90)82599-6. [DOI] [PMC free article] [PubMed] [Google Scholar]
- 38.Goulian M. Inclusions in membranes. Curr. Opin. Colloid Interface Sci. 1996;1:358–361. [Google Scholar]
- 39.Marcelja S. Lipid-mediated protein interaction in membranes. Biochim. Biophys. Acta. 1976;455:1–7. doi: 10.1016/0005-2736(76)90149-8. [DOI] [PubMed] [Google Scholar]
- 40.Owicki J.C., McConnell H.M. Theory of protein-lipid and protein-protein interactions in bilayer membranes. Proc. Natl. Acad. Sci. USA. 1979;76:4750–4754. doi: 10.1073/pnas.76.10.4750. [DOI] [PMC free article] [PubMed] [Google Scholar]
- 41.Pearson L.T., Edelman J., Chan S.I. Statistical mechanics of lipid membranes. Protein correlation functions and lipid ordering. Biophys. J. 1984;45:863–871. doi: 10.1016/S0006-3495(84)84232-0. [DOI] [PMC free article] [PubMed] [Google Scholar]
- 42.Huang H.W. Elasticity of lipid bilayer interaction with amphiphilic helical peptides. Biochimie. 1995;5:1427–1431. [Google Scholar]
- 43.Schumann M., Dathe M., Wieprecht T., Beyermann M., Bienert M. The tendency of magainin to associate upon binding to phospholipid bilayers. Biochemistry. 1997;36:4345–4351. doi: 10.1021/bi962304x. [DOI] [PubMed] [Google Scholar]
- 44.Ludtke S.J., He K., Wu Y., Huang H.W. Cooperative membrane insertion of magainin correlated with its cytolytic activity. Biochim. Biophys. Acta. 1994;1190:181–184. doi: 10.1016/0005-2736(94)90050-7. [DOI] [PubMed] [Google Scholar]
- 45.Blankschtein D., Thurston G.M., Benedek G.B. Phenomenological theory of equilibrium thermodynamic properties and phase separation of micellar solutions. J. Chem. Phys. 1986;85:7268–7288. [Google Scholar]
- 46.Rawicz W., Olbrich K.C., McIntosh T., Needham D., Evans E. Effect of chain length and unsaturation on elasticity of lipid bilayers. Biophys. J. 2000;79:328–339. doi: 10.1016/S0006-3495(00)76295-3. [DOI] [PMC free article] [PubMed] [Google Scholar]
- 47.Hung W.C., Chen F.Y., Huang H.W. Order-disorder transition in bilayers of diphytanoyl phosphatidylcholine. Biochim. Biophys. Acta. 2000;1467:198–206. doi: 10.1016/s0005-2736(00)00221-2. [DOI] [PubMed] [Google Scholar]
- 48.Nagle J.F., Tristram-Nagle S. Structure of lipid bilayers. Biochim. Biophys. Acta. 2000;1469:159–195. doi: 10.1016/s0304-4157(00)00016-2. [DOI] [PMC free article] [PubMed] [Google Scholar]
- 49.Simon S., McIntosh T.J., Lattore R. Influence of cholesterol on water penetration into bilayers. Science. 1982;216:65–68. doi: 10.1126/science.7063872. [DOI] [PubMed] [Google Scholar]
- 50.Levine Y.K., Wilkins M.H. Structures of oriented lipid bilayers. Nat. New Biol. 1971;230:69–72. doi: 10.1038/newbio230069a0. [DOI] [PubMed] [Google Scholar]
- 51.Armen R.S., Uitto O.D., Feller S.E. Phospholipid component volumes: determination and application to bilayer structure calculations. Biophys. J. 1998;75:734–744. doi: 10.1016/S0006-3495(98)77563-0. [DOI] [PMC free article] [PubMed] [Google Scholar]
- 52.Maheshwari R.K., Singh A.K., Gaddipati J., Srimal R.C. Multiple biological activities of curcumin: a short review. Life Sci. 2005;78:2081–2087. doi: 10.1016/j.lfs.2005.12.007. [DOI] [PubMed] [Google Scholar]
- 53.Jaruga E., Sokal A., Chrul S., Bartosz G. Apoptosis-independent alterations in membrane dynamics induced by curcumin. Exp. Cell Res. 1998;245:303–312. doi: 10.1006/excr.1998.4225. [DOI] [PubMed] [Google Scholar]
- 54.Fox R.O., Richards F.M. A voltage-gated ion channel model inferred from the crystal structure of alamethicin at 1.5-A resolution. Nature. 1982;300:325–330. doi: 10.1038/300325a0. [DOI] [PubMed] [Google Scholar]
- 55.Pandey R., Cook J., Rinehart K. High resolution and field desorption mass spectrometry studies and revised structure of alamethicin i and ii. J. Am. Chem. Soc. 1977;99:8469–8483. doi: 10.1021/ja00457a063. [DOI] [PubMed] [Google Scholar]
- 56.Hall J.E., Vodyanoy I., Balasubramanian T.M., Marshall G.R. Alamethicin. A rich model for channel behavior. Biophys. J. 1984;45:233–247. doi: 10.1016/S0006-3495(84)84151-X. [DOI] [PMC free article] [PubMed] [Google Scholar]
- 57.Mak D.O., Webb W.W. Two classes of alamethicin transmembrane channels: molecular models from single-channel properties. Biophys. J. 1995;69:2323–2336. doi: 10.1016/S0006-3495(95)80102-5. [DOI] [PMC free article] [PubMed] [Google Scholar]
- 58.Chen F.Y., Lee M.T., Huang H.W. Sigmoidal concentration dependence of antimicrobial peptide activities: a case study on alamethicin. Biophys. J. 2002;82:908–914. doi: 10.1016/S0006-3495(02)75452-0. [DOI] [PMC free article] [PubMed] [Google Scholar]
- 59.He K., Ludtke S.J., Huang H.W., Worcester D.L. Antimicrobial peptide pores in membranes detected by neutron in-plane scattering. Biochemistry. 1995;34:15614–15618. doi: 10.1021/bi00048a002. [DOI] [PubMed] [Google Scholar]
- 60.He K., Ludtke S.J., Worcester D.L., Huang H.W. Neutron scattering in the plane of membranes: structure of alamethicin pores. Biophys. J. 1996;70:2659–2666. doi: 10.1016/S0006-3495(96)79835-1. [DOI] [PMC free article] [PubMed] [Google Scholar]
- 61.Habermann E. Bee and wasp venoms. Science. 1972;177:314–322. doi: 10.1126/science.177.4046.314. [DOI] [PubMed] [Google Scholar]
- 62.Tosteson M.T., Tosteson D.C. The sting. Melittin forms channels in lipid bilayers. Biophys. J. 1981;36:109–116. doi: 10.1016/S0006-3495(81)84719-4. [DOI] [PMC free article] [PubMed] [Google Scholar]
- 63.Matsuzaki K., Yoneyama S., Miyajima K. Pore formation and translocation of melittin. Biophys. J. 1997;73:831–838. doi: 10.1016/S0006-3495(97)78115-3. [DOI] [PMC free article] [PubMed] [Google Scholar]
- 64.Eisenberg D., Terwilliger T.C., Tsui F. Structural studies of bee melittin. Biophys. J. 1980;32:252–254. doi: 10.1016/S0006-3495(80)84953-8. [DOI] [PMC free article] [PubMed] [Google Scholar]
- 65.Terwilliger T.C., Weissman L., Eisenberg D. The structure of melittin in the form I crystals and its implication for melittin's lytic and surface activities. Biophys. J. 1982;37:353–361. doi: 10.1016/S0006-3495(82)84683-3. [DOI] [PMC free article] [PubMed] [Google Scholar]
- 66.Wieprecht T., Seelig J. Isothermal titration calorimetry for studying interactions between peptides and lipid membranes. Curr. Top. Membr. 2002;52:31–56. [Google Scholar]
- 67.Afonin S., Grage S.L., Ieronimo M., Wadhwani P., Ulrich A.S. Temperature-dependent transmembrane insertion of the amphiphilic peptide PGLa in lipid bilayers observed by solid state (19)F NMR spectroscopy. J. Am. Chem. Soc. 2008;130:16512–16514. doi: 10.1021/ja803156d. [DOI] [PubMed] [Google Scholar]
- 68.Leontiadou H., Mark A.E., Marrink S.J. Antimicrobial peptides in action. J. Am. Chem. Soc. 2006;128:12156–12161. doi: 10.1021/ja062927q. [DOI] [PubMed] [Google Scholar]
- 69.Alberts B., Johnson A., Lewis J., Raff M., Roberts K. Garland Science; New York: 2008. Molecular Biology of the Cell. [Google Scholar]
- 70.Matsuzaki K., Sugishita K., Ishibe N., Ueha M., Nakata S. Relationship of membrane curvature to the formation of pores by magainin 2. Biochemistry. 1998;37:11856–11863. doi: 10.1021/bi980539y. [DOI] [PubMed] [Google Scholar]
- 71.Boman H.G., Marsh J., Goode J.A. John Wiley and Sons; Chichester: 1994. Antimicrobial peptides. [Google Scholar]
- 72.Debye P. Light scattering in soap solutions. Ann. N.Y. Acad. Sci. 1949;51:575–592. [Google Scholar]
- 73.Menestrina G., Serra M.D., Lazarovici P. Taylor & Francis; London: 2003. Pore-Forming Peptides and Protein Toxins. [Google Scholar]
- 74.van der Goot F.G. Springer; Berlin: 2001. Pore-Forming Toxins. [Google Scholar]
- 75.Panchal R.G., Smart M.L., Browser D.N., Williams D.A., Petrou S. Pore-forming proteins and their application in biotechnology. Curr. Pharm. Biotechnol. 2002;3:99–115. doi: 10.2174/1389201023378418. [DOI] [PubMed] [Google Scholar]
- 76.Song L., Hobaugh M.R., Shustak C., Cheley S., Bayley H. Structure of staphylococcal alpha-hemolysin, a heptameric transmembrane pore. Science. 1996;274:1859–1866. doi: 10.1126/science.274.5294.1859. [DOI] [PubMed] [Google Scholar]
- 77.Choe S., Bennett M.J., Fujii G., Curmi P.M., Kantardjieff K.A. The crystal structure of diphtheria toxin. Nature. 1992;357:216–222. doi: 10.1038/357216a0. [DOI] [PubMed] [Google Scholar]
- 78.Schlesinger P.H., Saito M. The Bax pore in liposomes. Biophysics. Cell Death Differ. 2006;13:1403–1408. doi: 10.1038/sj.cdd.4401991. [DOI] [PubMed] [Google Scholar]
- 79.Suzuki M., Youle R.J., Tjandra N. Structure of Bax: coregulation of dimer formation and intracellular localization. Cell. 2000;103:645–654. doi: 10.1016/s0092-8674(00)00167-7. [DOI] [PubMed] [Google Scholar]
- 80.Garcia-Saez A.J., Mingarro I., Perez-Paya E., Salgado J. Membrane-insertion fragments of Bcl-xL, Bax, and Bid. Biochemistry. 2004;43:10930–10943. doi: 10.1021/bi036044c. [DOI] [PubMed] [Google Scholar]