

Abstract
Since its discovery, the light-gated cation channel Channelrhodopsin-2 (ChR2) has proven to be a long-sought tool for the noninvasive, light-activated control of neural cells in culture and in living animals. Although ChR2 is widely used in neurobiological applications, little is known about its molecular mechanism. In this work, the unitary conductance of ChR2 was determined for different cations, for example 40 fS at 200 mM NaCl and −60 mV, using noise analysis. The kinetics of the ion channel obtained by noise analysis is in excellent agreement with the photocurrent kinetics obtained by voltage-clamp and time-resolved spectroscopy. The inward rectification of the channel could be explained by the single channel parameters. ChR2 represents an ion channel with a 7 transmembrane helix motif, even though the sequence homology of its essential amino acids to those of the light-driven H+ pump bacteriorhodopsin (bR) is high. Here, we also show that when ChR2 is expressed in electrofused giant HEK293 cells or reconstituted on planar lipid membranes, it can indeed act as an outwardly driven H+ pump, demonstrating that ChR2 is bifunctional, and in-line with other microbial rhodopsins, a H+ pump but with a leak that shows ion channel properties.
Keywords: light-driven pump, light-gated channel, noise analysis, ion transport
Channelrhodopsin-2 (ChR2) is a light-gated ion channel, which is native to the eyespot of the unicellular alga Chlamydomonas reinhardtii (1). ChR2 is involved in the photoperception of the alga, leading to its phototactic behavior. ChR2 represents an ion channel with a 7 transmembrane helix motif. Besides its biological function, ChR2 has become an excellent tool for neurobiological applications. It has been shown that ChR2 can be expressed functionally in neural cells both in culture and in living animals (2–4). Because of the inward current of the ChR2 channel under physiological conditions, illumination causes a depolarization of neural cells (2, 3, 5). Thus, these cells are stimulated by light. This allows circuit mapping and analysis of neural nets with not only high cell specificity (5) but also high temporal and spatial resolution that is superior to the conventional microelectrode techniques (6). Whereas this so-called optogenetic approach has found broad application in the field of neuroscience (7, 8), little is known about the basic properties of the light-gated channel. A major issue is the relationship between photochemical and electrophysiological properties. Recently, it was shown that the kinetics of macroscopic photocurrents recorded from ChR2-expressing HEK293 cells can be related to the kinetics of the photocycle obtained by flash photolysis (9, 10), showing that the open channel state can be attributed to an intermediate of the photocycle with the absorbance maximum at 520 nm and a lifetime of 10 ms.
However, one of the most important properties, the precise size of the single channel conductance, has not yet been characterized. Estimates and nonstationary noise experiments resulted in values from 50 fS (1), 0.25–2.4 pS (11) to 10 pS (12). To clarify this, a detailed study of the single channel properties was performed. In a first attempt, we tried to determine the single channel conductance directly by the conventional patch-clamp technique of excised patches. This approach was not successful, indicating that the single channel current must be smaller than expected from the published data (10−13 A at −100 mV) (11). Alternatively, the single channel parameters were herein determined by stationary noise analysis of the (macroscopic) photocurrent fluctuations under various external conditions. At 200 mM Na+, a single channel conductance of 40 fS was obtained, corresponding to a single channel current of 3.5 × 10⁻¹⁵ A (at −60 mV). As shown below, the inwardly directed rectification by ChR2 was analyzed from the voltage dependence of the power spectra. It is demonstrated that this property can be explained by the nonlinear voltage dependence of the single channel currents.
ChR2 undergoes a photocycle like bR (9, 10). After a short laser pulse, a blue shifted, M-like intermediate appears, indicating the deprotonation of the retinal binding Schiff-base in helix 7. Structurally, a high homology exists in helices 3 and 7. We concluded from these indications that ChR2, in addition to its channel function, can act as a proton pump with a presumably tight coupling to the intermediates of the photocycle. Indeed, ChR2 reconstituted on planar lipid membranes or expressed in giant electrofused HEK293 cells acts as a light-driven proton pump in the absence of any electrochemical gradient, showing the bifunctional character of the protein.
Results
Determination of the Single Channel Conductance.
For whole-cell patch-clamp experiments, a HEK293 cell line stably expressing the truncated ChR2-YFP fusion protein (1, 13) was used. Illumination with blue laser light (473 nm) induces a typical photocurrent trace with the characteristic inwardly directed voltage dependence (Fig. 1A). The I-V curve is presented in Fig. 1B. Inspection of the shape of the photocurrent shows the desensitization of the current that was described earlier (1). After illumination is discontinued, the photocurrent decays exponentially with the time course described by the time constant τoff. τoff represents the mean lifetime of the open channel or 1/τoff the closing rate constant koff. Under excised patch conditions, single channel events were not observed, suggesting that the single channel conductance is too small to be determined by this method. As an alternative approach, the analysis of the stationary current noise was chosen.
Fig. 1.

Channelrhodopsin-2 currents from a whole-cell patch recording with standard patch solutions (see Methods; 11.5 °C). Currents were induced by a DPSS laser (473 nm). (A) Applied voltage steps reached from −80 mV to + 80 mV in 40 mV steps. (B) Current-voltage relationship of the currents shown in A.
Under the assumption of a two-state model (open-closed; Eq. 1) (14), the power spectra can be evaluated.
The statistical process of the opening and closing produces current fluctuations, whose spectral density is described by a Lorentzian function:
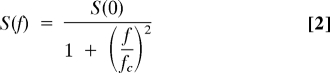 |
Where S(f) is the spectral density, S(0) is the spectral density at 0 Hertz, f is the frequency and fc is the corner frequency. The single channel conductance γ and the open time can be calculated from S(0), fc, the variance σ2, and the calculated open probability Po
where I is the macroscopic photocurrent and i the current through a single channel. The corner frequency is related to the relaxation time constant, τ = (1/τon + 1/τoff)−1 ⇔ k = kon + koff, by fc = . Single channel conductances were calculated using the applied voltage (V) and the reversal potential (Vrev):
Amplification of the photocurrent trace shows an increased noise level compared with that in absence of light (Fig. 2A, Inset). No such light-induced change in noise level could be detected on HEK293 control cells (where ChR2 had not been expressed) (Fig. 2B, Inset). Only a relatively small difference of the power spectra can be expected in the presence and absence of light. To obtain an optimal result with and without illumination, background noise sources such as instrumental noise, other ion channel noise and thermal noise had to be minimized. To keep the membrane conductance in the absence of illumination low, it was sufficient to hold the temperature at 11.5 °C (if not otherwise indicated). In most experiments guanidine+, the cation with the highest permeability ratio for ChR2 (1), was used, so that the largest light induced current amplitudes and fluctuations can be expected. For details see the material and methods section and figure legends of Figs. 1 and 2. In the absence and presence of light, the current traces showed low noise and no large unspecific fluctuations, which would cause an increased background noise (Fig. 2A, Inset).
Fig. 2.

Power spectra of whole-cell stationary recordings in standard solutions. Currents were recorded with and without illumination at light intensities that yielded half-maximal signal amplitude (−60 mV; 2 min; 11.5 °C; filtered at 2 kHz; see A and B, Insets). Power spectra of HEK293 cells with induction of ChR2 expression (A) and without (B, control). The red line shows the power spectra during illumination and the black one in the dark. (A and B, Insets) Macroscopic currents with illumination (red) and without illumination (black) are shown corresponding to the power spectra shown in A (ChR2 HEK293) and (B) (control HEK293). (C) Difference spectrum of the spectra shown in A fitted with a single Lorentzian (red line) between 2.5 Hz and 1 kHz. (D) Reduced difference spectrum of control cell spectra shown in B. Red line indicates the Lorentzian fit of C. Please note the logarithmic y axis [S(0) of the Lorentzian fit: 0.15 pA2/Hz; first data point in difference control spectrum: 0.04 pA2/Hz (0.84 Hz)].
Power spectra were recorded from stationary photocurrents and are shown in Fig. 2 A–D. To obtain the maximal fluctuation of the opening and closing of the light-gated channel, the spectra were taken at light intensities that yielded a half-maximal photocurrent amplitude. At low frequency (≈2.5 Hz), a larger noise amplitude can be observed with illumination compared with that in the absence of light. The power spectrum levels off at low frequency (red trace) whereas in the absence of light this inflection is absent (black trace; Fig. 2A). The difference power spectrum can be fitted with a Lorentzian function over 2 orders of magnitude in the frequency domain (Fig. 2C), indicating the open-closed mechanism. The noise of the control cell current is not affected by illumination (Fig. 2 B and D). The evaluation of the spectra according to Eqs. 2–4 gave a single channel conductance γ of 91.1 ± 24.9 fS in presence of 200 mM guanidine+ at −60 mV. Fig. 3A shows the single channel conductance with increasing concentrations of guanidine+. The saturation curve can be fitted with a Michaelis-Menten approach with a γmax of 128.5 ± 8.6 fS and a Km for the transported cation of 82.3 ± 13.9 mM. Please note the amplitude of S(0) was taken at 2.5 Hz because an increase of the noise amplitude was observed at frequencies between 0 and 2 Hz, possibly because of an unspecific conductance change of the cell membrane in the 100-fS range during the measuring time. The closing rate constant koff (1/τoff) and the corner frequency 2πfc are invariant regarding the concentration of the transported guanidine+, indicating that the mean life time and the open probability of the channel is not or only marginally affected by the concentration of the transported cation. The ion-specific permeability obtained by noise analysis agrees well with the data obtained via the determination of the reversal potential, guanidine+ > Li+ > Na+ (1). Details are given in Table 1.
Fig. 3.

Dependency of single channel parameters on guanidine+ concentration and temperature. (A) Change of the mean single channel conductance with increasing guanidine+ concentration. Conductances were calculated from the parameters of Lorentzian functions fitted to the power spectra (over a fixed interval of 2.5 Hz to 1 kHz; see Fig. 2). Approximation by a Michaelis-Menten function reveals a maximal single channel conductance of ChR2 of γmax = 128.5 ± 8.6 fS (Km = 82.3 ± 13.9 mM). Error bars indicate the standard deviation of the mean values. (B) Arrhenius plots of the rate constants k (2πfc; ■; from the Lorentzian fitted to the respective power spectra) and koff (1/τoff; Δ; from macroscopic data), and γ (□) are depicted. Lines indicate activation energies of 75 kJ/mol for k, 64 kJ/mol for koff, and 21 kJ/mol for γ. Whole-cell patches were clamped at −60 mV at 8 °C (n = 4), 11.5 °C (n = 22), 14 °C (n = 4), and 16 °C (n = 4) with standard patch solutions (see Methods).
Table 1.
Dependency of light-induced single channel conductances of ChR2 in the presence of guanidine+ (Gua+), Li+, and Na+, as well as the values for the ChR2 mutant H134R with 200 mM Gua+
| C, mM | Ion | γ, fS | fc, Hz | k, s−1 | τoff, ms | koff, s−1 | Po | n |
|---|---|---|---|---|---|---|---|---|
| 40 | Gua+ | 45.2 ± 11.2 | 10.1 ± 2.3 | 63.5 ± 14.5 | 28.7 ± 1.3 | 34.8 ± 1.5 | 0.45 | 4 |
| 80 | Gua+ | 58.7 ± 16.3 | 8.9 ± 2.6 | 55.9 ± 16.3 | 30.3 ± 2.8 | 33.0 ± 3.0 | 0.41 | 5 |
| 120 | Gua+ | 77.0 ± 23.9 | 8.0 ± 1.0 | 50.3 ± 6.3 | 30.7 ± 2.5 | 32.6 ± 2.7 | 0.35 | 4 |
| 160 | Gua+ | 85.9 ± 19.2 | 9.9 ± 1.9 | 62.2 ± 11.9 | 30.9 ± 3.3 | 32.4 ± 3.5 | 0.48 | 5 |
| 200 | Gua+ | 91.1 ± 24.9 | 9.6 ± 2.0 | 60.3 ± 12.6 | 32.0 ± 2.5 | 31.3 ± 2.5 | 0.48 | 22 |
| 200 | Gua+ H134R | 89.4 ± 30.7 | 7.3 ± 1.0 | 46.0 ± 6.3 | 55.4 ± 5.8 | 18.2 ± 1.9 | 0.60 | 4 |
| 200 | Li+ | 60.6 ± 17.8 | 7.5 ± 0.9 | 47.1 ± 5.7 | 34.7 ± 3.4 | 28.8 ± 3.0 | 0.39 | 6 |
| 200 | Na+ | 41.5 ± 6.7 | 10.4 ± 3.6 | 65.3 ± 22.6 | 31.2 ± 2.8 | 32.1 ± 3.0 | 0.51 | 4 |
γ, single channel conductance; Po, open probability; n, number of cells.
As a consistency test for the validity of the obtained noise, the channel kinetics of a point mutant of ChR2, H134R, were analyzed. The mutation at position H134, which corresponds to D96 in BR (crucial for H+ pumping), has been shown to lead to larger stationary current amplitudes compared with WT ChR2 (4), which could either be caused by an increase of γ or Po. The closing rate constant koff of the H134R channel is reduced by a factor of 1.73. Correspondingly, the corner frequency is reduced by a factor of 1.3 without affecting the single channel conductance. The original data are given in Table 1.
Temperature Dependence.
Generally, ion channels show markedly lower activation energies for ion transport than ion pumps or transporters. This is due to the relatively free diffusion of ions through the open state of the channel. In contrast, the ion movement of transporters is tightly coupled to the corresponding conformation changes as, for example, in the case of bR or the Na/K-ATPase. Usually, the temperature dependence of these conformation changes is steeper, yielding an activation energy ranging from 60 to 120 kJ/mol for ion transport. In contrast, a value of 21 ± 20.8 kJ/mol was found for the ion translocation in ChR2, which is a value typical for ion channels (e.g., 15) (Fig. 3B). Both the corner frequency 2πfc and 1/τoff show a steeper temperature dependence, resulting in activation energies of 75 ± 23 kJ/mol and 64 ± 11 kJ/mol, respectively. This indicates that the closing process of the channel is related to a conformational change of the protein (Fig. 3B).
Voltage Dependence.
The current-voltage relationship (Fig. 1B) shows that ChR2 acts as an inward rectifier. What determines this behavior? Inspection of the kinetic data obtained by noise analysis and from the macroscopic photocurrents shows a weak voltage dependence of the open probability (Table 2). Therefore, the rectification cannot be explained by a voltage induced increase of the lifetime of the channel. In contrast, the amplitude of the single channel currents, obtained by noise analysis, shows a significant inwardly directed voltage dependence in the experimentally accessible voltage range (0 to −60 mV). Normalization of the macroscopic photocurrents with the single channel currents obtained from the power spectra yields an excellent agreement for the current-voltage relationship. From this we conclude that the rectifying properties are dominantly determined by the hyperlinear voltage dependence of the single channel current (Fig. 4A).
Table 2.
The change of the single channel conductance γ and current i with the applied voltage (external 200 mM guanidine+)
| Voltage |
||||
|---|---|---|---|---|
| 0 mV | −20 mV | −40 mV | −60 mV | |
| γ, fS | 66.8 ± 19.8 | 67.4 ± 13.2 | 78.0 ± 14.1 | 91.1 ± 24.9 |
| i, fA | −3.4 ± 1.0 | −4.9 ± 0.8 | −7.0 ± 1.3 | −10.3 ± 2.6 |
| Po | 0.55 | 0.49 | 0.43 | 0.48 |
| n | 5 | 4 | 4 | 22 |
Po, open probability.
Fig. 4.

Voltage and light dependency.(A) Voltage dependency of normalized mean (black; n = 25) and single channel (i; red) currents [normalized to the values measured at −40 mV; i: n = 22 (−60 mV); n = 4 (−40 mV); n = 4 (−20 mV); n = 5 (0 mV)]. (B) Light dependency of a single HEK293 cell expressing ChR2. The mean macroscopic current at different light intensities (473 nm; 0.05–5.3 mW mm−2; −60 mV applied) is plotted against the variance σ2. Each variance is calculated from the parameters of the Lorentzian fit to the respective difference power spectra using σ2 = [πfcS(0)]/2. The data were approximated using σ2 = Ii − (I2/n) yielding a single channel current of i = −7.5 ± 0.6 fA and n = 160,000 ChR2 channels. The error bars given for σ2 are the combined error of the parameters S(0) and fc resulting from the fit of the difference power spectra. (A and B) 11.5 °C and external 200 mM Guanidine+.
Determination of the Variance σ2.
The detection of the ChR2 power spectra from the background noise is just on the borderline. Therefore, determination of the variance σ2 and its dependency on the light intensity is a crucial cross-check for the behavior of the channel. Fig. 4B shows the mean current plotted against the variance σ2. At increasing light intensity and a holding potential of −60 mV the inward current is directly correlated with the photon flux of the exciting light. The variance of the current was obtained from the Lorentzian function (Eqs. 2 and 3). At low light intensity, the amplitude is small and reaches a maximal value at half-maximal photocurrents (half-maximal light intensity). Experimentally, the single channel conductance does not change significantly, whereas S(0) first increases and then decreases again. The variance at higher light intensities until saturation should decay because the ratio of the noise amplitude S(0) to the mean current I is reduced. A tendency of the reduction of σ2 can be seen in Fig. 4B. However, it was impossible to measure the light dependence of σ2 under bright light because of the longer period (min), which was required for the recording of the photocurrents on the single cell, bright illumination destroyed the seal on the patch electrode. The mean open time increases with increasing light intensities. Under stationary light conditions, the ChR2 photocycle is a two-photon reaction (9, 10, 16) with a maximal on-rate constant kon that amounts to 30 s−1 as calculated from the measured corner frequency fc and koff, whereas in the single turnover experiments the channel opens with a rate constant of 5,000 s−1 (1, 9). The photocycle is accelerated by absorption of a second photon, thus bypassing the dark state and increasing the probability of the occurrence of the open state (see Fig. 5C). With low light intensities, the amount of second photons reaching the individual channels could be rate-limiting.
Fig. 5.

Pump current in relation to the photocyte. (A) Pump currents of ChR2: Proteoliposomes adhered to one side of the BLM in 20 mM Hepes/Tris, pH 7.4. The signals were recorded at different conductivities of the compound membrane directly after addition of the protonophore 1799 (0.4 nS, black trace) and after incubation for 1 h (2.8 nS, green trace) upon illumination (>435 nm). The insert shows the action spectrum for the stationary currents compared with the ground state spectrum of purified and solubilized ChR2 (red line). (B) Pump current measured on giant HEK293 cells after electrofusion (d ≈ 30 μm). The pump current was induced by a blue DPSS laser (473 nm, 40 mW mm−2). (C) The photocycle, the pump and the channel mode are related in a simplified photocycle under stationary conditions (9, 10). The ground state D470 reaches the early intermediate P500 after illumination. Deprotonation (no.1) to the extracellular (EC) side (P390) and reprotonation (no. 2) from the cytoplasmic (CP) side (P520) leads to the pumping of one proton per photocycle. During the lifetime of P520, the channel is open and allows permeation of protons and cations (M+) as indicated by the red arrow. Upon closing (no.3), ChR2 reaches the light-adapted state P480. Recovery to the ground state takes seconds in the dark and is accelerated by a second light reaction under continuous illumination. Therefore, the channel cycle can be lumped together to the 2-state model as indicated in the small circle inside. (D) Cartoon sketch of the mechanistic model for ChR2 in relation to the photocycle showing the retinylidene chromophore. Deprotonation of the Schiff-base (no. 1) takes place via the putative proton acceptor E123. Reprotonation occurs from an intramolecular donor toward (no. 2) that is going to be replenished from the cytoplasmic side (no. 3)
The light dependency of σ2 was fitted according to the function σ2 = Ii − (I2/n), which allows one to estimate the number n of active ChR2 molecules within the cell membrane (≈160.000 per cell or 226 ChR2/μm2). This number corresponds to that obtained by direct counting of particles in the plasma membrane by electron microscopy (17).
Channelrhodopsin: A Light-Driven Proton Pump?
The demonstration of the photocycle and the high sequence homology to bR regarding the ion pathway in helix 3 raise the question: Does ChR2 also act as a light-driven proton pump? Does a vectorial proton transport that is directly coupled to the intermediates of the photocycle exist (Fig. 5 C and D)? For the investigation of the putative pump mode, ChR2 was reconstituted in lipid vesicles. The proteoliposomes were adsorbed on to planar, optically black lipid membranes (BLM) as described earlier (18), with equimolar Tris-Hepes concentrations on both sides of the membrane to ensure that protons were the only permeating cations and light the only energy source. No current flow is expected in the absence of an applied potential if ChR2 exclusively functions as a channel. In addition to the control of the driving force, this experimental approach was chosen because the background conductance of the compound membrane is smaller than that of transfected HEK293 cells and a superior signal-to-noise ratio can be expected.
Illumination of the compound membranes yields transient photocurrents because of a capacitive coupling, which can be converted into a DC-coupling by the addition of appropriate ionophores (Fig. 5A). Under short-circuit conditions, comparably small stationary currents were obtained in the absence of any ion gradient and electrical potential difference. Thus, the resulting currents in Fig. 5A could only be due to the proton pumping activity of ChR2. Symmetrical addition of monovalent cations had no effect on the pump currents. Combining the results described above, ChR2 appears to have dual function as ion pump and ion channel. In case of the pump mode, the proton translocation is directly coupled to the photocycle. This is further substantiated by measurements with a slow mutant of ChR2, C128T (19). The lifetime and hence the photocycling time is increased by a factor of 100 leading to negligible stationary pump currents compared with WT because one proton per photocycle should be transported in the pump mode at most as assumed from the bR pump cycle. In contrast to this, in the presence of an electrochemical gradient, the transport of monovalent cations, protons included, is largely enhanced due to the increased open time of the channel.
From the BLM experiments, the direction of the pump currents is difficult to determine because the orientation of the reconstituted protein is unclear. An unambiguous answer regarding the orientation can be obtained using electrophysiology on ChR2 expressing HEK293 cells. Yet, the expected pump currents, as obtained from the BLM experiments, are too small to be detected due to the size of these cells. To overcome this difficulty, “giant” HEK293 cells were produced by electrofusion as described recently (13). The size of the HEK293 cells was increased by electrofusion of native cells to giant cells with diameters of up to 30 μm. In the absence of any electrochemical gradient an outwardly directed photocurrent was observed (Fig. 5B) that is in agreement with a proton pump mechanism. Application of a Na+ gradient to the same cell gave the usual inward current. From this and the separately determined single channel conductance, the number of active ChR2 molecules could be calculated. With this number the amount of charges per photocycle was estimated to be 0.2–0.4 elementary charges, indicating that a backflow (slip) also occurs in the pump mode. An active inwardly directed chloride transport, as present in the light-driven Cl−-pump Halorhodopsin, could be excluded because no effect by the exchange of supposedly inert anions was detectable.
Discussion
After the first description of ChR2 (1) and the elucidation of the photocycle (9, 16), precise and detailed single channel properties remained unknown. Two prior estimates both predicted a small single channel conductance on the basis of Chlamydomonas photocurrents (≈10 pS; under the assumption of a Ca2+-channel and a certain number of rhodopsin-like molecules; the conductance of the Ca2+-channel was estimated for ion concentrations for 0.1 mM Ca2+ and 6 mM K+; extrapolation to the physiological concentrations) (12), and after single channel measurements had been unsuccessful, the single channel conductance was estimated to 50 fS from the macroscopic photocurrent and its kinetics (1). The number of active molecules is based on the assumption that the expression level of ChR2 in Xenopus laevis oocytes is similar to the number that had been determined for bR. Using nonstationary noise analysis, Lin et al. (11) recently published an average value of 1.1 pS with a variation between 0.25 and 2.42 pS that might be a consequence of the desensitization (going from the peak current to the stationary state). This process is not well described in kinetic terms. It is strictly dependent on the light intensity and the starting concentration of the light and dark adapted form, P480 and D470 (Fig. 5C). However, one cannot rule out a higher conducting state, which is transiently present and has been observed in the nonstationary analysis. According to these values (11), a direct determination of the single channel current by conventional patch-clamp should be possible. However, all attempts by us failed. Therefore, stationary noise analysis was performed with the variation of many external parameters. A value of 40 fS was obtained, which corresponds to a single channel current of 3.5 × 10⁻¹⁵ A (200 mM Na+, −60 mV). This value is below the detection level of our experimental conditions for single channel measurements.
Power spectral density increases could be observed upon blue light illumination in ChR2 expressing HEK293 cells. Because this effect is absent in control cells (HEK293 cells), it can be attributed to the channel itself. Difference spectra showed a distinct shape that could be approximated by a single Lorentzian function over a range of 2 decades. This indicates that the simple two-state model (Eq. 1) is a good approximation of the channel gating in noise analysis.
The concentration dependence of the photocurrent is characterized by the saturation behavior. It can be observed on the level of the single channel current, as well as the level of the macroscopic photocurrents. In particular, it was elaborated for guanidine+ cation. Punctual measurements with sodium ions were in line with this. The saturation can either be explained by only one ion moving through the channel at a time, or by a number of ions moving through in a single file (20).
In line with the channel function of ChR2 is the activation energy of 20 kJ/mol determined for the single channel conductance, which is a typical value for ion channels. Both, the ChR1 off-time activation energies (≈60 kJ/mol) (21) and those derived from the ChR1 photocurrent amplitude (≈20 kJ/mol) (21) are congruent with those determined for ChR2. At 200 mM external ion concentration and an applied voltage of −60 mV the single channel conductances translate to a turnover between 2.2 × 10⁴ Na+ and 6.4 × 10⁴ guanidine+ ions per second (11.5 °C). bR, in comparison, has a turnover of ≈100 protons per second, due to the ≈10-ms photocycle duration. Combining the knowledge of the single channel current and the macroscopic current, the expression level of active ChR2 in cells can be determined. This might be important for the adjustment of the photon flux of the activating light and the optimization of the expression level to avoid eventual toxic effects by for example, overexpression of ChR2.
The inward rectification of ChR2 is not an effect of an increase of the life time or the amount of open channels at constant single channel conductance but rather because of the nonlinear current-voltage behavior of the single channels (Fig. 4A). Under symmetrical ion conditions ChR2 shows an inwardly directed rectification behavior. This can be explained when the highest barrier for the ion translocation is not in the middle of the membrane. With the application of an electrical field, the current voltage behavior then becomes asymmetrical, because of an asymmetric voltage drop resulting in the rectification as observed.
The “gain-of-function” feature of ChR2 mutant H134R (4) can be assigned to a prolonged lifetime of the open channel whereas the single channel conductance itself remains as for the WT ChR2. This becomes more important for the slow mutants C128X, which have a long-lasting open state, increasing the light sensitivity accordingly (19).
The demonstration of the pump activity of ChR2 is mechanistically important because ChR2 behaves similar to the other microbial rhodopsins in many respects, as one would expect from sequence comparison (1, 21). With the deprotonation and reprotonation of the Schiff-base (formation and disappearance of an M-like intermediate P390, Fig. 5C), the photocycle shows the typical rhodopsin behavior. This is in agreement with the extracellular proton release, followed by the reprotonation via the intracellular side with the vectorial transport as described (Fig. 5D). Spectroscopically, ChR2 behaves quite similar to the other microbial rhodopsins. However, its unique behavior as an ion channel is probably the appearance of a leak in the presence of the P520 intermediate in the photocycle, which abolishes the vectoriality of the pump almost completely. For a deeper understanding of the ChR2 mechanism, the ion pathway through the protein has to be identified and analyzed, which requires detailed structural investigations.
Materials and Methods
Cell Culture and Molecular Biology.
The C-terminally truncated ChR2-yellow fluorescent protein (vector: pcDNA4TO-chop2–315-EYFP) and the mutant H134R ChR2 (vector: pcDNA4TO-chop2–315(H134R)-His-TEV1-EYFP) were stably transfected in HEK293-TREX cells (Invitrogen), cultured and induced as described (9, 13). For control experiments the stable cell line without prior induction of ChR2 expression was used.
Patch Clamp and Stationary Noise Analysis.
Experiments were performed in the whole-cell configuration under voltage-clamp conditions (Axopatch 200B and DigiData 1322A interface; Axon Instruments). Patch-clamp pipettes (tip diameter: 1–2 μm) were fabricated from borosilicate glass capillaries (external diameter 1.5 mm; wall thickness 0.32 mm; Science Products). The pipette solution contained (in mM) 1 guanidine-HCl, 199 NMG-Cl (N-methylglucamine), 10 EGTA, 2 MgCl2, and 20 Hepes. All solutions were titrated to pH 7.4. The bath solution contained (in mM) 200 guanidine-HCl, 2 MgCl2, 2 CaCl2, and 20 Hepes. For determination of the guanidine+ dependency, the outside guanidine+ concentrations were (in mM) 40, 80, 120, 160, and 200 (guanidine+ was substituted with NMG (160, 120, 80, 40, and 0 mM, respectively). For measurements with alternate cations, the bath solution contained 200 NaCl or LiCl. ChR2 was induced by a diode-pumped solid-state laser (DPSS; 473 nm; max. 30 mW mm−2; Pusch OptoTech). All experiments were carried out under cooling conditions (8 °C, 11.5 °C, 14 °C, and 16 °C).
Current response to voltage step protocols (applied voltages ranging from −120 mV to + 80 mV in 40 mV steps) was recorded under saturating light conditions and again under light conditions where the current response at −60 mV was half the maximal current (I0.5; 2 kHz low-pass Bessel filter; sampling rate 100 kHz; cell diameter 15 μm). The reversal potential was determined from the corresponding current-voltage characteristic (see Fig. 1).
Recordings of the stationary current during prolonged illumination at light intensities that yielded half-maximal signal amplitude (2 min) at −60 mV holding potential and 11.5 °C (unless otherwise stated) were used to estimate the elementary conductance of the underlying channel (2 kHz low-pass Bessel filter; sampling rate 20 kHz). Recordings were collected without (control) and with illumination (30 s after the onset of the light stimulus). Noise analysis power spectral densities were calculated by a fast Fourier Transform (FFT) routine implemented in the Clampfit 10.0 software (spectral resolution: 0.07 Hz). Spectra were obtained by averaging individual spectra with illumination (channel noise; 2 measurements on the same cell; Fig. 2A red) and without illumination (background noise; 3 measurements on the same cell; Fig. 2A black). For difference spectra, the background noise was subtracted from the channel noise spectrum excluding negative values from the data (Fig. 2C). The resolution was reduced by 1/5. The difference spectrum was fitted between 2.5 Hz and 1 kHz with a single Lorentzian function (Eq. 2) and the single channel parameters determined (Eqs. 3–5). Data analysis was performed with Clampfit 10.0 (Axon Laboratories) and Origin 7.5 (OriginLab Corporation).
Preparation of Proteoliposomes.
ChR2 was isolated and purified as described in ref. 9. The protein was reconstituted in a polar lipid extract from E. coli (Avanti Polar Lipids). The lipids were solubilized with 1% (wt/vol) decyl maltoside in 20 mM Hepes/Tris, pH 7.4, by sonication in a bath sonicator. After addition of ChR2, the mixture was incubated for 15 min on ice. The detergent was removed over night either by adsorption on Bio-Beads SM 2 (Bio-Rad) or dialysis. The final concentration amounted to 10 mg/mL for the lipids and 4 to 10 μM for ChR2.
Black Lipid Membrane Measurements.
BLM experiments were performed as described in ref. 18. The bilayer was formed from a 1.5 (wt/vol) solution of diphytanoyllecithin (Avanti Polar Lipids) and 0.025% (wt/vol) octadecylamine (Riedel-De-Haen). Twenty μL proteoliposomes were added to a 1.5 mL compartment on the nonilluminated side of a Teflon cuvette filled with 20 mM Hepes/Tris, pH 7.4. For some experiments, 100 mM KCl was added. For stationary currents, the protonophore 1799, (2,6-dihydroxy)-1,1,1,7,7,7-hexafluoro-2,6-bis(trifluoromethyl)heptane-4-one, or the ionophores valinomycin and monensin (Sigma) were added to both sides of the bilayer and conductivity changes were followed electrically by a potential step. The cuvette was illuminated by a 75 W XBO lamp (Zeiss) after passing a heat protection filter (KG-3G, Optics Balzers) and a high-pass cutoff (OG435 nm, Optics Balzers) as indicated, yielding a photon flux density of up to 50 mW mm−2.
The action spectra were measured with different narrow band interference filters and neutral glass filters (Optics Balzers). The relative response was determined from the linear range of the stationary current. Light intensities were measured with a bolometer (3A-P, Ophir Optronics).
Pump Current Patch Clamp.
Electrofusion of the ChR2 expressing HEK293 cells was performed as described in ref. 14. Bath and pipette solution consisted of 170 mM Hepes, 10 mM HCl titrated with Tris-base to pH 7.4. For the recording of the pump current, cells were allowed to settle to 0–2 mV in current clamp mode after establishing whole-cell configuration. The exchange of the cytoplasm with the pipette solution, as indicated by a stable baseline, typically took 2 min.
Acknowledgments.
We thank A. Pustlauck and A. Becker for excellent technical support, Dr. U. Terpitz for help with the electrofusion of the HEK293 cells, and P. Wood for critical reading of the manuscript. This work was supported by Deutsche Forschungsgemeinschaft Sonderforschungsbereich Grants 472 and 807 (to E.B.) and from the Cluster of Excellence Frankfurt, Macromolecular Complexes.
Footnotes
The authors declare no conflict of interest.
References
- 1.Nagel G, et al. Channelrhodopsin-2, a directly light-gated cation-selective membrane channel. Proc Natl Acad Sci USA. 2003;100:13940–13945. doi: 10.1073/pnas.1936192100. [DOI] [PMC free article] [PubMed] [Google Scholar]
- 2.Boyden ES, Zhang F, Bamberg E, Nagel G, Deisseroth K. Millisecond-timescale, genetically targeted optical control of neural activity. Nat Neurosci. 2005;8:1263–1268. doi: 10.1038/nn1525. [DOI] [PubMed] [Google Scholar]
- 3.Li X, et al. Fast noninvasive activation and inhibition of neural and network activity by vertebrate rhodopsin and green algae channelrhodopsin. Proc Natl Acad Sci USA. 2005;102:17816–17821. doi: 10.1073/pnas.0509030102. [DOI] [PMC free article] [PubMed] [Google Scholar]
- 4.Nagel G, et al. Light activation of channelrhodopsin-2 in excitable cells of Caenorhabditis elegans triggers rapid behavioral responses. Curr Biol. 2005;15:2279–2284. doi: 10.1016/j.cub.2005.11.032. [DOI] [PubMed] [Google Scholar]
- 5.Lagali PS, et al. Light-activated channels targeted to ON bipolar cells restore visual function in retinal degeneration. Nat Neurosci. 2008;11:667–675. doi: 10.1038/nn.2117. [DOI] [PubMed] [Google Scholar]
- 6.Zhang W, Ge WP, Wang ZR. A toolbox for light control of Drosophila behaviors through channelrhodopsin 2-mediated photoactivation of targeted neurons. Eur J Neurosci. 2007;26:2405–2416. doi: 10.1111/j.1460-9568.2007.05862.x. [DOI] [PubMed] [Google Scholar]
- 7.Airan RD, et al. High-speed Imaging reveals neurophysiological links to behavior in an animal model of depression. Science. 2007;317:819–823. doi: 10.1126/science.1144400. [DOI] [PubMed] [Google Scholar]
- 8.Arenkiel BR, et al. In vivo light-induced activation of neural circuitry in transgenic mice expressing channelrhodopsin-2. Neuron. 2007;54:205–218. doi: 10.1016/j.neuron.2007.03.005. [DOI] [PMC free article] [PubMed] [Google Scholar]
- 9.Bamann C, Kirsch T, Nagel G, Bamberg E. Spectral characteristics of the photocycle of channelrhodopsin-2 and its implication for channel function. J Mol Biol. 2008;375:686–694. doi: 10.1016/j.jmb.2007.10.072. [DOI] [PubMed] [Google Scholar]
- 10.Ernst OP, et al. Photoactivation of channelrhodopsin. J Biol Chem. 2008;283:1637–1643. doi: 10.1074/jbc.M708039200. [DOI] [PubMed] [Google Scholar]
- 11.Lin JY, Lin MZ, Steinbach P, Tsien RY. Characterization of engineered channelrhodopsin variants with improved properties and kinetics. Biophys J. 2009;96:1803–1814. doi: 10.1016/j.bpj.2008.11.034. [DOI] [PMC free article] [PubMed] [Google Scholar]
- 12.Harz H, Nonnengasser C, Hegemann P. The photoreceptor current of the green-alga Chlamydomonas. Philos Trans R Soc London B. 1992;338:39–52. [Google Scholar]
- 13.Zimmermann D, et al. Biophysical characterization of electrofused giant HEK293 cells as a novel electrophysiological expression system. Biochem Biophys Res Commun. 2006;348:673–681. doi: 10.1016/j.bbrc.2006.07.112. [DOI] [PubMed] [Google Scholar]
- 14.DeFelice LJ. Introduction to Membrane Noise. New York: Plenum Press; 1981. [Google Scholar]
- 15.Coronado R, Rosenberg RL, Miller C. Ionic selectivity, saturation, and block in a K+-selective channel from sarcoplasmic reticulum. J Gen Physiol. 1980;76:425–446. doi: 10.1085/jgp.76.4.425. [DOI] [PMC free article] [PubMed] [Google Scholar]
- 16.Ritter E, Stehfest K, Berndt A, Hegemann P, Bartl FJ. Monitoring light-induced structural changes of channelrhodopsin-2 by UV-visible and Fourier transform infrared spectroscopy. J Biol Chem. 2008;283:35033–35041. doi: 10.1074/jbc.M806353200. [DOI] [PMC free article] [PubMed] [Google Scholar]
- 17.Zimmermann D, et al. Effects on capacitance by overexpression of membrane proteins. Biochem Biophys Res Commun. 2008;369:1022–1026. doi: 10.1016/j.bbrc.2008.02.153. [DOI] [PubMed] [Google Scholar]
- 18.Bamberg E, et al. Photocurrents generated by bacteriorhodopsin on planar bilayer membranes. Biophys Struct Mech. 1979;5:277–292. [Google Scholar]
- 19.Berndt A, Yizhar O, Gunaydin LA, Hegemann P, Deisseroth K. Bi-stable neural state switches. Nat Neurosci. 2009;12:229–234. doi: 10.1038/nn.2247. [DOI] [PubMed] [Google Scholar]
- 20.Hille B, Schwarz W. K channels in excitable cells as multi-ion pores. Brain Res Bull. 1979;4:159–162. doi: 10.1016/0361-9230(79)90079-0. [DOI] [PubMed] [Google Scholar]
- 21.Nagel G, et al. Channelrhodopsin-1: A light-gated proton channel in green algae. Science. 2002;296:2395–2398. doi: 10.1126/science.1072068. [DOI] [PubMed] [Google Scholar]