Abstract
This work describes the first application of microchip electrophoresis with chemiluminescence detection (MCE-CL) in single cell analysis. Human red blood cells were assayed to determine intracellular content of glutathione (GSH). Intracellular GSH was first labeled by incubating cells with diazo-luminol, and then individual cells were injected, in-line lysed, and MCE separated. CL detection was based on the oxidation reaction of luminol - labeled GSH with NaBrO. The MCE-CL assay had a linear calibration curve over a range from 0.2~ 90 amol GSH injected with a correlation coefficient of 0.9991 and a detection limit of 50 zmol or 3.6× 10⁻⁹ M (S/N = 3). The average content of GSH in individual human red blood cells was found 64.9 amol (n= 17). Compared with the MCE methods with laser induced fluorescence detection (LIF) reported so far for single cell analysis, the present MCE-CL assay of GSH is simple and about 100 times more sensitive.
Keywords: Microfluidic, Microchip electrophoresis, Chemiluminescence detection, Single cell analysis, Diazo-luminol, Intracellular labeling, Glutathione
Analysis of intracellular contents and characterization of single cell behaviors are essential to gain a better understanding of basic cell functions as well as various biological processes such as cellular communication,1–3 differentiation,4–5 gene expression,6 and metabolism7 at the single cell level. Single cell analysis also enables the detection and identification of rare or abnormal cells in a large population of cells, thus achieving early diagnosis of diseases. These biological and biomedical significances have promoted the development of analytical techniques for single cell analysis. As a result, analytical methods based on chemical cytometry,8–11 open tubular liquid chromatography,12 electrochemical analysis,13 fluorescence microscopy,14 mass spectrometry15 and capillary electrophoresis (CE)5, 16–20 have been developed. CE coupled with ultra-sensitive detection schemes such as laser-induced fluorescence (LIF), in particular, has been proven to be useful for single cell analysis.
Currently, from both the perspective of scientific interest and that of technological validity microfluidic devices attract research attention. This is primarily due to the fact that short chemical /biological reaction time, high reaction efficiency, and small reactant volume can be realized. The dimensions (10–100 µm) of microfluidic channels are highly compatible with the sizes of biological cells, which has made cellular assay a popular application of such micro total analysis systems. Among the microfluidic-based cellular applications, much emphasis has been placed on single cell analysis.21, 22 Single cell analysis offers many advantages over the traditional bulk cellular analysis that often overlooks cellular heterogeneity and does not provide information on cell-to-cell variations, e.g., pattern of cellular response to a given stimulus, 23, 24 or variability in the concentration of second messengers or metabolites among different cells. 3, 25, 26 Recently, separations of intracellular contents of individual cells using microfluidic devices were reported. Ramsey and co-workers used a glass microfluidic device to achieve high throughput analysis of Jurkat cells.27 Klepárník and Horký reported a microfluidic device integrated on a plastic disk for the detection of DNA fragmentation in a single apoptotic cardiomyocyte.28 Fang group developed a microfluidic system for the analysis of single cells with functional integration of cell sampling, single cell loading, docking, lysing, separation and laser induced fluorescence (LIF) detection. Using this system glutathione (GSH) and several reactive oxygen species (ROS) in individual human erythrocytes were determined. 29–31 Zare and his co-corkers reported the determination of amino acids in a single Jurkat cells using an integrated microfluidic device with LIF detection.32
In all of the above-mentioned microfluidic applications in single cell analysis, LIF detection was deployed. Although LIF is the most widely used detection scheme for its high sensitivity, a conventional LIF detector is sophisticated, expensive, and difficult to be miniaturized. Diode laser-based LIF detectors can be small, but only work at a limited number of wavelengths. Furthermore, derivatization of the analytes with a fluorophore is often necessary. Chemiluminescence (CL) detection has been proven to be one of the most sensitive detection schemes and has the advantages including simple instrumental setup, low background noise, and low costs for operation and maintainance.33 Therefore, this detection technique is well suited for on-line detection in microchip electrophoresis (MCE). Several MCE-CL systems were reported.34–37 However, since the microfluidic channels were extremely small, sensitivity of the MCE-CL methods reported was in the range from 10−5 ~ 10−7 M (limit of detection, LOD), which was hardly sufficient for quantifying trace components in single cells. In this work, we report on the development of a pre-assay intracellular CL labeling technique to dramatically improve the sensitivity of single cell analysis by MCE-CL. An MCE-CL system for single-cell analysis was constructed. This system integrated single-cell selection, cell loading, electrical lysing, and electrophoretic separation of the intracellular contents on the microfluidic chip. Human red blood cells were assayed to determine intracellular content of glutathione (GSH). Intracellular GSH was pre-assay labeled by incubating the cells with diazo-luminol, which made GSH CL detectable with a very high sensitivity. For the first time, the use of a microfluidic device with chemiluminescence detection for single cell analysis was demonstrated.
EXPERIMENTAL SECTION
Microfluidic-CL System
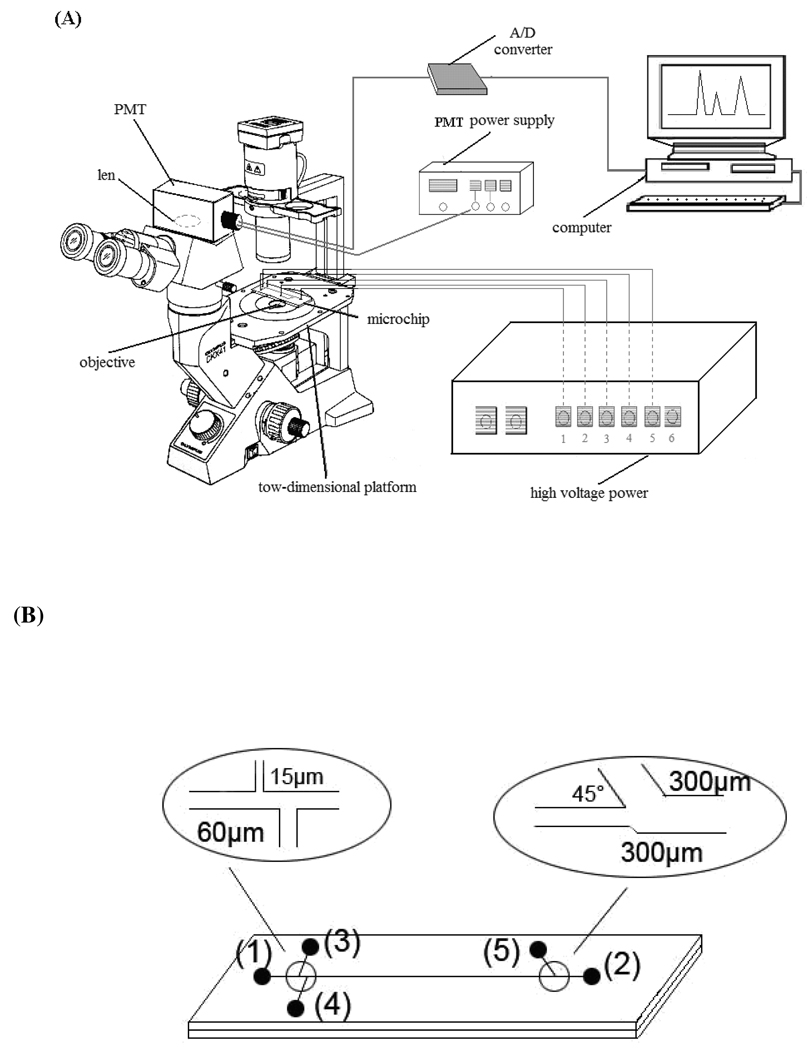
The schematic of the experimental setup is shown in Figure 1A. The glass microchip assembly was mounted on the X–Y translational stage of an inverted microscope (Olympus CKX41) that also served as a platform of CL detection. Use of the X–Y translational stage allowed viewing any point of the microchannel for introducing a cell. CL signal was collected by means of a microscope objective. After passing a dichroic mirror and a lens, CL photons were detected by a photomultiplier (PMT, Hamamatsu R105). The PMT was mounted in an integrated detection module including HV power supply, voltage divider, and amplifier. The output signal of PMT was recorded and processed with a computer using a Chromatography Data System (Zhejiang University Star Information Technology, Hangzhou, China). A multi-terminal high voltage power supply, variable in the range of 0–5000 V (Shandong Normal University, Jinan, China), was used for cell loading, lysing, and MCE separation. A valuable practical aspect of the inverted microscope setup was the possibility of visually checking all field-controlled operations on the device through the eyepiece. The inverted microscope was placed in a black box.
Figure 1.
(A) Schematic of the integrated MCE-CL system for single cell analysis. (B) The layout and dimensions of the glass microchip used in this work: 1) electrophoresis buffer reservoir; 2) electrophoresis buffer waste reservoir; 3) cell suspension sample reservoir; 4) sample waste reservoir; 5) CL reaction buffer solution reservoir. The channel dimensions are shown in insets.
Microchip Fabrication
The layout of the microfluidic glass chip, as shown in Figure 1B, consisted of 3 channels. Reservoir 3 was the cell inlet, reservoirs 2 and 4 were the waste outlet, and reservoirs 1 and 5 were used for reagent delivery. The chips were fabricated using standard wet chemistry etching techniques as previously reported.34 Briefly, microchannel designs were transferred onto the substrates using a positive photoresist, photomask, and UV exposure. The channels were etched into the substrate in a dilute HF/NH4F/HNO3 (1:0.5:0.5) solution with stirring. To form the closed channels, a cover plate is bonded to the substrate over the etched channels by hydrolyzing the surfaces, bringing them into contact with each other, and processing thermally at 600 °C for 2 h. Microchannels measured 15 µm wide by 10 µm deep for cell introduction, 60 µm wide by 10 µm deep for separation and waste delivery, 300 µm wide by 300 µm deep for chemical reaction and oxidizer introduction, respectively. The diameters of all reservoirs were 3.5 mm in diameter and 1.5 mm deep.
Reagents
Luminol, sodium borate, and GSH were obtained from Sigma Chemicals (St. Louis, MO, USA). N-2-Hydroxyethylpiperazine-N'-2-ethanesulfonic acid (HEPES) was obtained from Shanghai Qcbio Science & Technologies Co. Ltd.(Shanghai, China). All other chemicals used in this work were of analytical grade. Water was purified employing a Milli-Q plus 185 equip from Millipore (Bedford, MA, USA), and used throughout the work. All solutions were filtered through a 0.22 µm membrane filter. The PBS solution for storage of red blood cells contained 135 mM NaCl, 5 mM KCl, 2 mM MgCl2, 1 mM NaH2PO4, 10 mM HEPES and 2 mM CaCl2 at pH 7.4 (adjusted with a 1 M NaOH solution). GSH stock solution (1.00 mM) was prepared in PBS solution. The electrophoresis buffer was 10 mM borate solution (pH 9.2, adjusted with 1 M NaOH solution). The CL reaction buffer was 100 mM NaCO3-NaOH solution containing 0.8 mM NaBrO (pH 12.5, adjusted with 1 M NaOH solution). Human blood samples were taken from healthy adult volunteers.
Cell sample pretreatment
About 250 µL of a human blood sample was transferred into a 1.5-mL vial containing 750 µL PBS solution. After gently mixing, the mixture was centrifuged at 1500 rpm for 3 min and the supernatant was removed. PBS solution (750 µL) was added to the vial. Cell washing was repeated for seven times until the supernatant was clear and transparent. PBS solution (1 mL) was added to the vial and the vial was gently shacked to obtain a suspension of red blood cells. Then, the suspension was stored in portions at 4 °C. Before analysis, the cell suspension was diluted 500 times.
Labeling Intracellular GSH
A diazo-luminol labeling solution was first prepared as following. Luminol (2 mg) was dissolved in 5 mL 1 M HCl solution. NaNO2 solution (1 mL, 1.5 mg /mL) was added drop by drop into the luminol solution placed in an ice bath with stirring. At the end, the pH value of the solution was adjusted to 7.4 with a 1 M NaOH solution to obtain the diazo-luminol labeling solution. The solution was effective for at least one week when stored in at 4 °. To label intracellular GSH, the diluted cell suspension (25 µL) was mixed with 1 mL diazo-luminol solution, and the mixture was kept at 4 ° for 8 hrs.
MCE-CL Analysis of Single Cells
The microchannels were rinsed with 1M NaOH for 30 min before the first use. Between two consecutive runs, the microchannels were rinsed sequentially with 0.1 M NaOH, water, and electrophoresis buffer for 1 min each by applying a vacuum of ~50 mmHg generated from an oil vacuum pump. Prior to the MCE separation, reservoirs 1, 3, and 4 were filled with the electrophoresis buffer. In order to fill the separation channel with the electrophoresis buffer a vacuum of ~ 50 mmHg was applied to reservoir 2. Finally, reservoirs 2 and 5 were filled with CL reaction buffer. The electrophoresis buffer solution in reservoir 3 was replaced by diazo-luminol-labeled cell suspension, and reservoir 4 was emptied. Owing to the differences in liquid levels in the reservoirs 3 and 4, the labeled cell suspension flowed from reservoir 3 through the double “T” intersection to reservoir 4. When a single cell moved within the double “T” intersection of the channels as being observed under the microscope, reservoir 4 was filled quickly with the electrophoresis buffer to stop the cell suspension flow. The sampled cell settled within the channel of double “T” intersection adhering to its wall. After the chip was shifted from the double “T” intersection viewing position to the detection point (i.e. the join-point of the reaction solution channel with the separation channel), the docked cell was lysed immediately by a set of electrical shocks (1 s each) with reservoir 1 at 900 V / reservoir 2 at ground or reservoir 1 at ground /reservoir 2 at 950 V as described previously.29 The MCE separation was performed by applying a 2150 V voltage to reservoir 1 with the reservoir 2 held at ground. Separated Luminol-tagged GSH mixed with a NaBO solution stream generated by EOF through applying a 300 V voltage to the reservoir 5.
Calibrating the MCE-CL System
For calibration, reservoirs 1, 3, and 4 were filled with the electrophoresis buffer, reservoir 5 was filled with CL reaction buffer and vacuum was applied to reservoir 2 in order to fill the separation channel with the electrophoresis buffer. Then, the electrophoresis buffer solution in reservoir 3 was replaced by diazo-luminol labeled GSH standard solution. For loading the standard solution, a set of electrical potentials were applied to five the reservoirs: reservoir 1 at 250 V, reservoir 2 at 300 V, reservoir 3 at 450 V, reservoir 4 at grounded, and reservoir 5 at 0 V. The standard solution was transported from reservoir 3 to 4 in pinched mode. After 15 s, potentials were switched to reservoirs 1, 3, 4 and 5 at 2150, 250, 250 and 300 V, respectively, while reservoir 2 was grounded for separation and detection.
RESULT AND DISCUSSION
Labeling Intracellular GSH
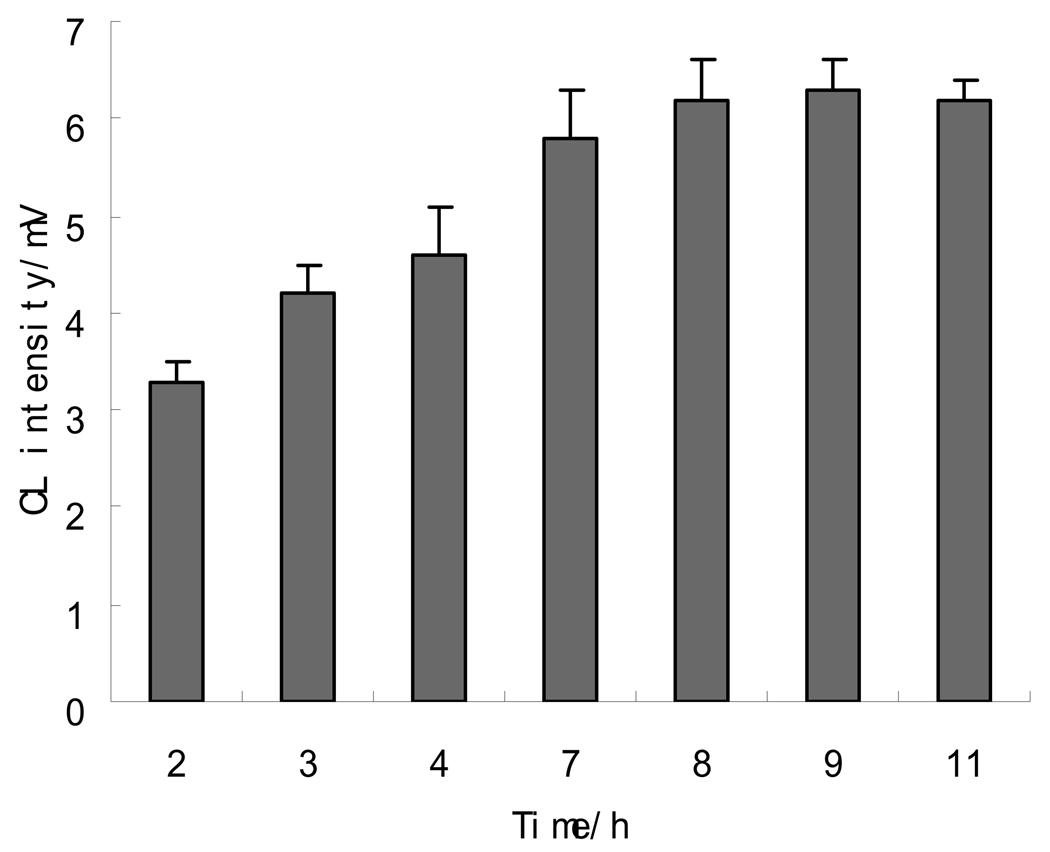
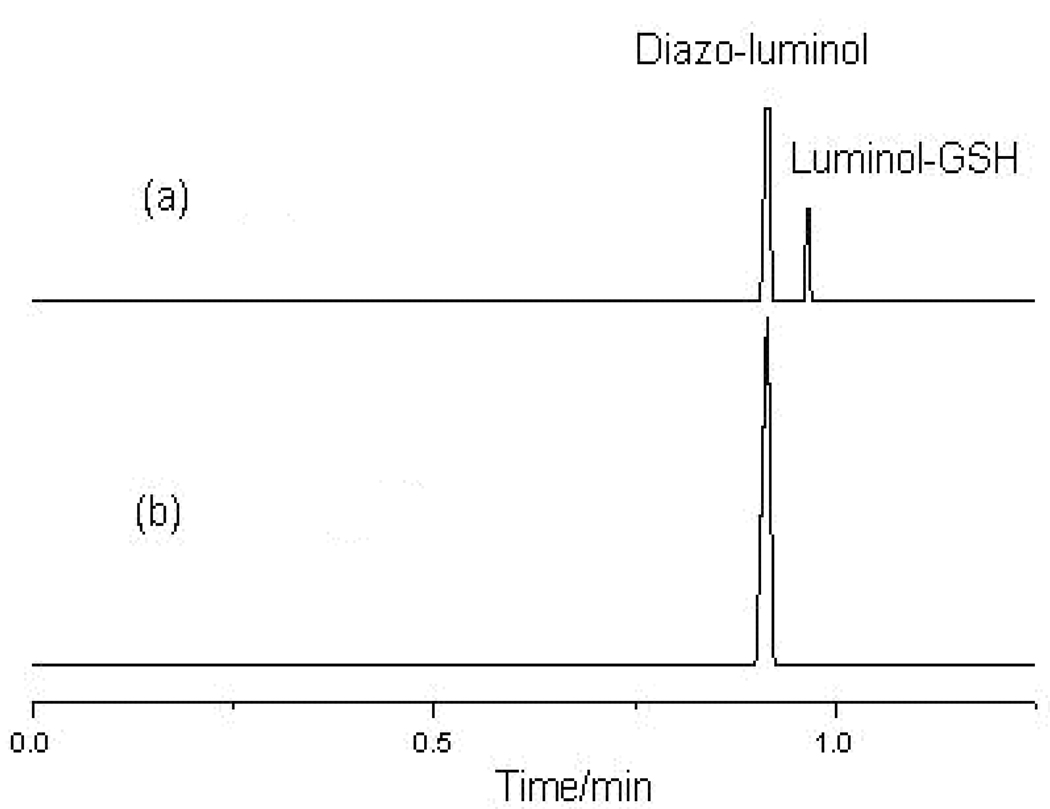
Since the microfluidic channels are extremely small, the detection sensitivity of MCE assays can be very poor. From the works published previously, 34–37 detection limits of MCE-CL methods fell in the range from 10−5 ~ 10−7 M. In these MCE-CL methods, the CL reagent was generally added into the running buffer or reaction medium solution post-column, which resulted in a high CL background, and hence a noisy baseline of the electropherogram. This might be one of the main reasons that impaired the detection sensitivity of MCE-CL methods. The problem can be solved by pre-assay labeling if the analytes can be tagged with a CL reagent, and the labeled analyte and excessive CL reagent can be separated before detection. In this work, luminol, the most widely used CL reagent, was diazotized with NaNO2 to prepare a labeling solution. Diazotized luminol has been used for long to label proteins in immunological assays.38–39 It was found to be reactive towards organic compounds containing thiol functional group such as GSH, and to be able to permeate the cell membrane, tagging intracellular GSH. Because luminol-labeled GSH contained the luminescence moiety of luminol, it reacted with the oxidizing agent, NaBrO, resulting in CL emission. To achieve the optimal labeling yield, effects of the mole ratio of diazo-luminol to GSH, labeling temperature and incubation time were investigated. The results indicated that the maximum CL intensity was obtained when the mole ratio was greater than 30. The labeling temperature should be controlled in the range of 0 to 4 ° because diazo-luminol decomposed at higher temperatures. Incubation time also affected the labeling yield. To determine the optimal intracellular labeling time, cell suspension was mixed with diazo-luminol solution, and kept at 4 ° for different time periods before analysis. Figure 2 shows the effects of labeling time on the MCE-CL signal from intracellular GSH. The results were obtained by analyzing five cells at a certain labeling time and averaging the signals from the five cells. The CL intensity of luminol labeled GSH increased with the increase in incubation time from 0 up to 7 hrs, and then became nearly constant till 10 hrs. After 10 hrs, the cell membrane was damaged and cells busted. Therefore, the incubation time of 8 hrs was selected. To study the present MCE-CL assay sensitivity, a 6.0×10⁻⁷ M GSH standard solution was treated with the diazo-luminol labeling solution and then analyzed. The electropherograms obtained are shown in Figure 3. As can be seen, a very low CL background was observed and the baseline of the electropherogram appeared noiseless. These results confirm that pre-assay CL labeling is an effective way to improve the assay sensitivity of MEC-CL methods.
Figure 2.
Effects of labeling time on CL intensity from intracellular GSH.
Figure 3.
Electropherograms obtained from the separation of a 6.0 × 10⁻⁷ M GSH solution treated with the diazo-luminol labeling solution (a), and the diazo-luminol labeling solution (b). MCE conditions: electrophoresis electrolyte was 10 m M borate solution (pH 9.2); CL reaction buffer was 100 mM NaCO3-NaOH solution containing 0.8 mM NaBrO (pH 12.5).
Microchip Electrophoretic Separation
In order to separate luminol labeled GSH from diazo-luminol, the MCE conditions were studied. Two kinds of buffers (i.e., phosphate and borate buffers) were tested. It was found that a better separation was obtained with the use of a borate buffer at pH 9.2. Further, borate buffer concentration in the range of 5 to 25 mM was tested. It was noted that the resolution (R = (t2 – t1) × 2 / (w1 + w2)) between luminol-tagged GSH and diazo-luminol increased from 2.2 to 2.8 with the increase in borate buffer concentration. However, the migration times were also increased and MCE peaks were broaden at high borate buffer concentrations. Therefore, 10 mM borate buffer at pH 9.2 was selected to achieve an optimal separation. Separation of luminol-labeled GSH from diazo-luminol allowed highly sensitive CL detection of GSH thanks to the lack of CL background.
CL Detection of Luminol-labeled GSH
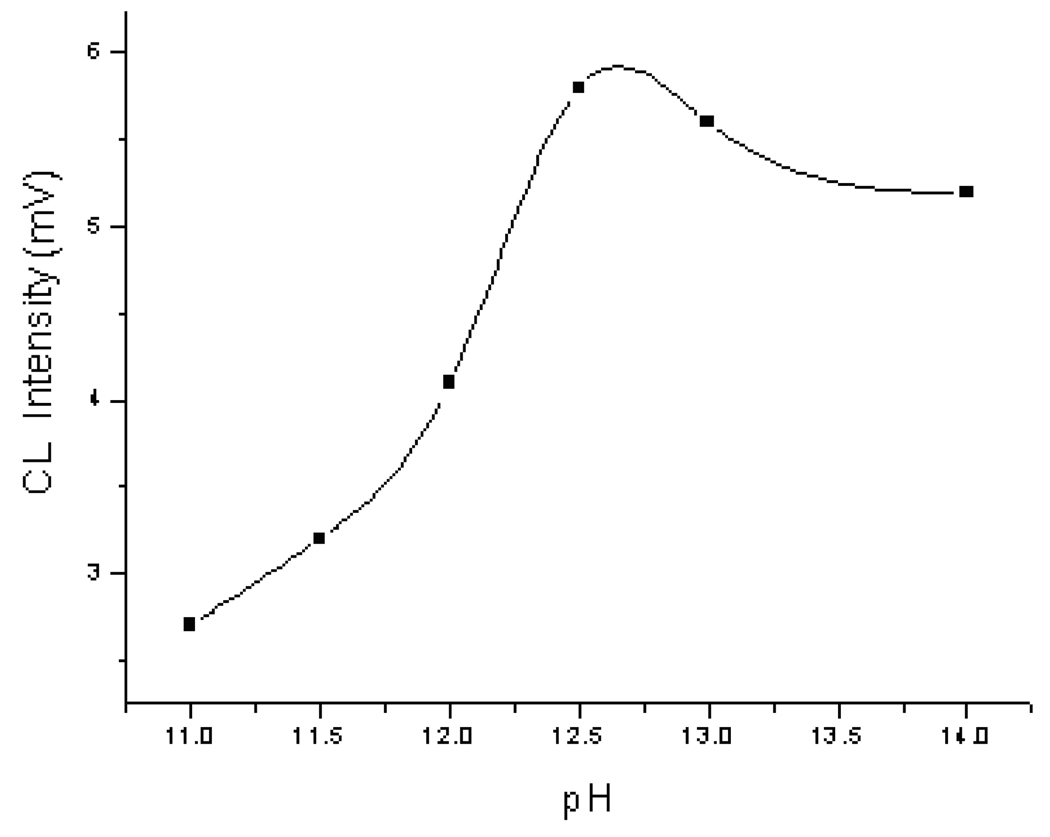
Effects of NaBrO concentration, pH of the CL reaction buffer, and the potential applied at reservoir 5 were studied to achieve the best detection sensitivity. A luminol-labeled GSH standard solution was analyzed under various CL conditions. Since luminol reacted with NaBrO in alkaline condition, a 0.1 M NaCO3-NaOH solution was used as the reaction medium. The effects of NaBrO concentration on CL intensity was studied. NaBrO solutions of different concentrations ranging from 0.5 to 1.1 mM NaBrO were tested. MCE-CL signal from analyzing a luminol-labeled GSH standard solution was measured. The signal increased first from 1.5 to 6.5 mV and then decreased gradually to 0.5 mV with the increase in NaBrO concentration. The maximum CL signal (6.5 mV) was obtained when NaBrO concentration was 0.8 mM. The effects of the reaction medium pH were examined. The results are shown in Figure 4. As can be seen, the pH had a significant influence on CL intensity. The optimal pH was found to be 12.5. The voltage applied at reservoir 5 for introducing the oxidizer solution affected directly the flow rate of the oxidizer solution, and hence the CL intensity. It was noted that the voltage applied at reservoir 1 for separation had little influence on the CL intensity. Therefore, the voltage applied at reservoir 5 was examined over a range from 200 to 450 V. It was found that good peak shapes and high CL intensity were obtained with a voltage of 300 V applied at reservoir 5.
Figure 4.
Effects of the CL reaction buffer pH. MCE conditions were as in Figure 3.
Quantification of intracellular GSH in individual cells
Six-point calibration curves were prepared with standard GSH solutions with concentrations ranging from 2.0 × 10⁻⁸ to 9.0 × 10⁻⁶ M GSH. Electrokinetic pinched sampling operations were used for injection. The standard GSH solutions were first treated with the diazo-luminol labeling solution as for cell suspension samples. Considering the difference in volume for each cell, the mass of GSH was determined instead of the concentration. A regression equation of H = 0.1355 N - 0.003 (where N was GSH mass in amol and H was peak height in mV, r 2= 0.9991) was obtained. The calibration mass range tested was from 0.2 amol to 90 amol. From this calibration curve, the detection limit was estimated to be 50 zmol (or 3.6×10⁻⁹ M) GSH (signal / noise = 3). This detection limit was much lower than that of the MCE-CL methods previously reported, which was above 10−7 M.34–37 Compared with the MCE-LIF methods reported for GSH analysis, the sensitivity of the present assay was still much better. Gao et al 29 reported an MCE-LIF LOD of 2.5×10⁻⁷ M (or 3.5 amol) GSH. Ling et al 31 reported another MCE-LIF LOD of 6.9 amol GSH. The assay reproducibility was also studied by analyzing a GSH standard solution at 6.0 × 10⁻⁷ M eight times. The peak heights and migration times were measured. The results are summarized in Table 1. The RSDs of peak height and migration time were 3.8% and 4.3%, respectively.
Table 1.
Reproducibility of the assay
| Run # | 1 | 2 | 3 | 4 | 5 | 6 | 7 | 8 | RSD% |
|---|---|---|---|---|---|---|---|---|---|
| Peak height (mV) | 1.14 | 1.12 | 1.08 | 1.10 | 1.17 | 1.20 | 1.18 | 1.10 | 3.8 |
| Migration time (s) | 54.5 | 59.1 | 59.2 | 52.4 | 57.7 | 55.8 | 56.5 | 58.8 | 4.3 |
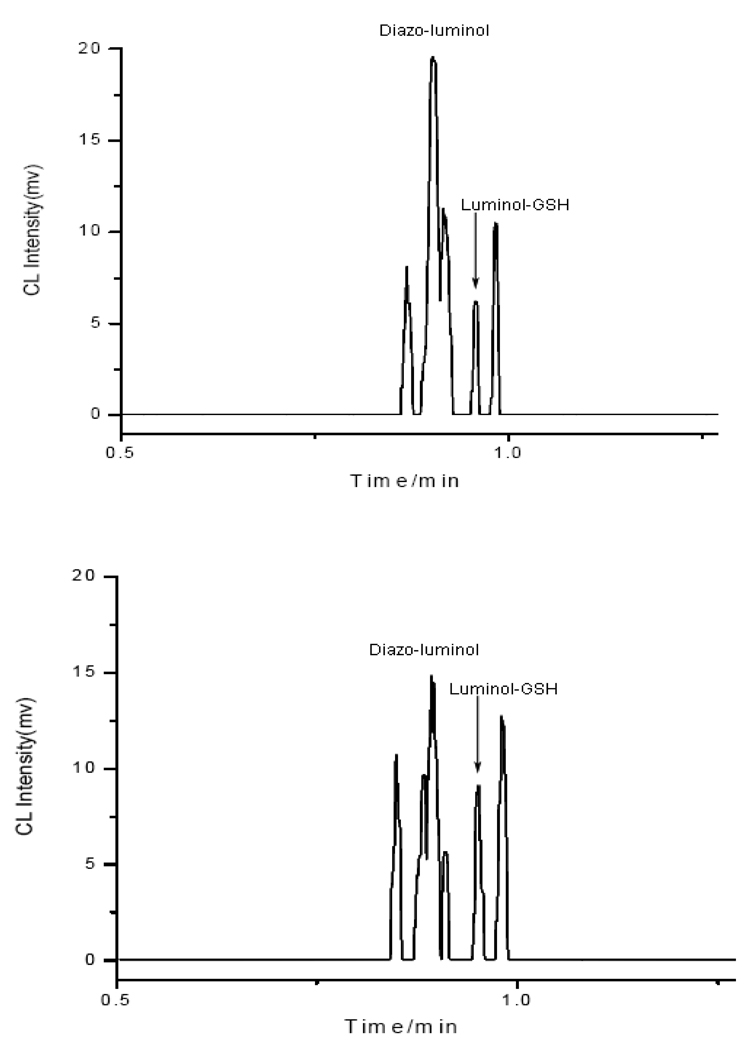
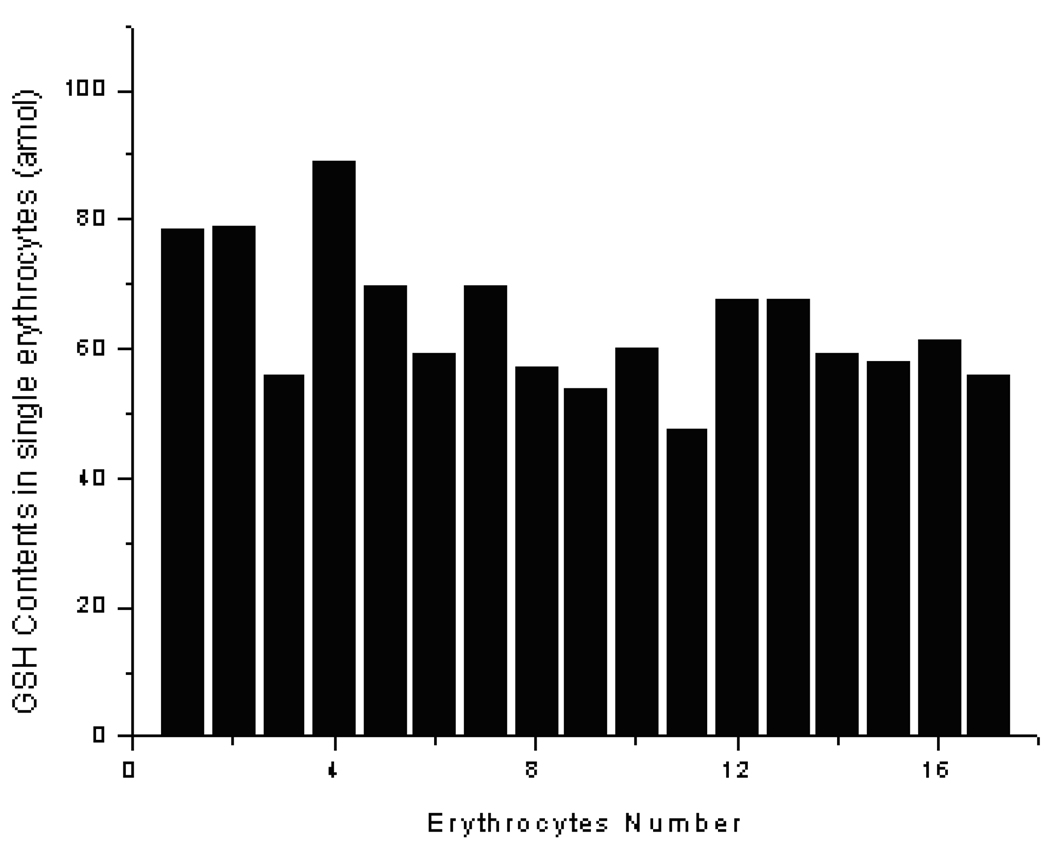
Individual human red blood cells obtained from a blood sample were analyzed. Two typical electropherograms from such analyses are shown in Figure 5. As can be seen by comparing the traces in Figure 5 with those in Figure 3, the GSH peak at 57.5 s in the electropherograms from individual cells can be well identified. The analytical results for intracellular GSH content in individual human red blood cells are summarized in Figure 6. The GSH content varied from 50 to 90 amol /cell (n = 17) with an average of 64.9 amol / cell. The result was very similar to that reported in literature (68 amol /cell for GSH), which was obtained by a CE-LIF method.40
Figure 5.
Electropherograms from analysis of two individual human red blood cells. MCE conditions were as in Figure 3.
Figure 6.
Intracellular contents of GSH in individual human red blood cells.
CONCLUSION
A novel MCE-CL method for single cell analysis has been developed and used for the quantitative measurement of GSH in individual human red blood cells. The method deployed a microfluidic chip for convenient single loading, trapping, lysing, and separation. CL detection was facilitated by use of a converted microscope for accurate detection positioning and effectively collecting the CL emission. To improve the assay sensitivity, intracellular CL labeling with diazo-luminol as the tagging reagent was performed. Pre-assay labeling of the analytes avoided adding the CL reagent into the system, which greatly diminished the CL background and hence the baseline noise in electropherograms. Compared with other MCE-CL methods reported so far, the present method is at least 100 times more sensitive. To the best of our knowledge, this is the first report on MCE-CL application in single cell analysis.
ACKNOWLEDGMENT
Financial support from the National Natural Science Foundations of China (NSFC, Grant No. 20665002 and 20875019 to SZ) and US National Institutes of Health (S06GM08047 to YML) is gratefully acknowledged.
REFERENCES
- 1.Cooper BR, Jankowski JA, Leszczyszyn DJ, Wightman RM, Jorgenson JW. Anal. Chem. 1992;64:691–694. doi: 10.1021/ac00030a022. [DOI] [PubMed] [Google Scholar]
- 2.Ewing AG, Strein TG, Lau YY. Acc. Chem. Res. 1992;25:440–447. [Google Scholar]
- 3.Kennedy RT, Oates MD, Cooper BR, Nickerson B, Jorgenson JW. Science. 1989;246:57–63. doi: 10.1126/science.2675314. [DOI] [PubMed] [Google Scholar]
- 4.Jankowski JA, Schroeder TJ, Ciolkowski EL, Wightman RM. J. Biol. Chem. 1993;268:14694–14700. [PubMed] [Google Scholar]
- 5.Zhi Q, Xie C, Huang X, Ren J. Anal. Chim. Acta. 2007;583:217–222. doi: 10.1016/j.aca.2006.09.068. [DOI] [PubMed] [Google Scholar]
- 6.Zabzdyr JL, Lillard SJ. Anal. Chem. 2001;73:5771–5775. doi: 10.1021/ac0155714. [DOI] [PubMed] [Google Scholar]
- 7.Anderson AB, Gergen J, Arriaga EA. J. Chromatogr. B. 2002;769:97–106. doi: 10.1016/s1570-0232(01)00633-x. [DOI] [PubMed] [Google Scholar]
- 8.Kruth HS. Anal. Biochem. 1982;125:225–242. doi: 10.1016/0003-2697(82)90001-x. [DOI] [PubMed] [Google Scholar]
- 9.Naill MC, Roberts SC. Biotechnol. Prog. 2005;21:978–983. doi: 10.1021/bp049544l. [DOI] [PubMed] [Google Scholar]
- 10.Marc PJ, Sims CE, Allbritton NL. Anal. Chem. 2007;79:9054–9059. doi: 10.1021/ac7017519. [DOI] [PMC free article] [PubMed] [Google Scholar]
- 11.Wang HY, Lu C. Chem. Commun. 2006;33:3528–3530. doi: 10.1039/b605722e. [DOI] [PubMed] [Google Scholar]
- 12.Oates MD, Cooper BR, Jorgenson JW. Anal. Chem. 1990;62:1573–1577. doi: 10.1021/ac00214a006. [DOI] [PubMed] [Google Scholar]
- 13.Troyer KP, Wightman RM. Anal. Chem. 2002;74:5370–5375. doi: 10.1021/ac0203903. [DOI] [PubMed] [Google Scholar]
- 14.Ishijima A, Yanagida T. Trends Biochem. Sci. 2001;26:438–444. doi: 10.1016/s0968-0004(01)01860-6. [DOI] [PubMed] [Google Scholar]
- 15.Li L, Golding RE, Whittal RM. J. Am. Chem. Soc. 1996;118:11662–11663. [Google Scholar]
- 16.Hogan BL, Yeung ES. Anal. Chem. 1992;64:2841–2845. doi: 10.1021/ac00046a031. [DOI] [PubMed] [Google Scholar]
- 17.Han FT, Lillard SJ. Anal. Biochem. 2002;302:136–143. doi: 10.1006/abio.2001.5519. [DOI] [PubMed] [Google Scholar]
- 18.Hu S, Zhang L, Cook LM, Dovichi NJ. Electrophoresis. 2001;22:3677. doi: 10.1002/1522-2683(200109)22:17<3677::AID-ELPS3677>3.0.CO;2-Q. [DOI] [PubMed] [Google Scholar]
- 19.Zhang H, Jin WR. Electrophoresis. 2004;25:480–486. doi: 10.1002/elps.200305642. [DOI] [PubMed] [Google Scholar]
- 20.Fuller KM, Arriaga EA. Anal. Chem. 2003;75:2123–2130. doi: 10.1021/ac026476d. [DOI] [PubMed] [Google Scholar]
- 21.Sims CE, Allbritton NL. Lab Chip. 2007;7:423–440. doi: 10.1039/b615235j. [DOI] [PubMed] [Google Scholar]
- 22.Carlo DD, Lee LP. Anal. Chem. 2006;78:7918–7925. doi: 10.1021/ac069490p. [DOI] [PubMed] [Google Scholar]
- 23.Teruel MN, Meyer T. Science. 2002;295:1910–1912. doi: 10.1126/science.1065028. [DOI] [PubMed] [Google Scholar]
- 24.Wheeler AR, Throndset WR, Whelan RJ, Leach AM, Zare RN, Liao YH, Farrell K, Manger ID, Daridon A. Anal. Chem. 2003;75:3581–3586. doi: 10.1021/ac0340758. [DOI] [PubMed] [Google Scholar]
- 25.Negulescu PA, Shastri N, Cahalan MD. Proc. Natl. Acad. Sci. U.S.A. 1994;91:2873–2877. doi: 10.1073/pnas.91.7.2873. [DOI] [PMC free article] [PubMed] [Google Scholar]
- 26.Jin W, Li X, Gao N. Anal. Chem. 2003;75:3859–3864. doi: 10.1021/ac0207022. [DOI] [PubMed] [Google Scholar]
- 27.McClain MA, Culbertson CT, Jacobson SC, Allbritton NL, Sims CE, Ramsey JM. Anal. Chem. 2003;75:5646–5655. doi: 10.1021/ac0346510. [DOI] [PubMed] [Google Scholar]
- 28.Klep´arn´ik K, Hork´y M. Electrophoresis. 2003;24:3778–3783. doi: 10.1002/elps.200305667. [DOI] [PubMed] [Google Scholar]
- 29.Gao J, Yin XF, Fang ZL. Lab. Chip. 2004;4:47–52. doi: 10.1039/b310552k. [DOI] [PubMed] [Google Scholar]
- 30.Sun Y, Yin XF, Ling YY, Fang ZL. Anal. Bioanal. Chem. 2005;382:1472–1476. doi: 10.1007/s00216-005-3352-8. [DOI] [PubMed] [Google Scholar]
- 31.Ling YY, Yin XF, Fang ZL. Electrophoresis. 2005;26:4759–4677. doi: 10.1002/elps.200500232. [DOI] [PubMed] [Google Scholar]
- 32.Wu H, Wheeler A, Zare RN. Proc. Natl. Acad. Sci. U.S.A. 2004;101:12809–12813. doi: 10.1073/pnas.0405299101. [DOI] [PMC free article] [PubMed] [Google Scholar]
- 33.Tsukagoshi K, Jinno N, Nakajima R. Anal. Chem. 2005;77:1684–1688. doi: 10.1021/ac040133t. [DOI] [PubMed] [Google Scholar]
- 34.Jacobson SC, Ramsey JM. Anal. Chem. 1997;69:3212–3217. doi: 10.1021/ac970192p. [DOI] [PubMed] [Google Scholar]
- 35.Hashimoto M, Tsukagoshi K, Nakajima R, Kondo K, Arai A. J. Chromatogr. A. 2000;867:271–279. doi: 10.1016/s0021-9673(99)01169-3. [DOI] [PubMed] [Google Scholar]
- 36.Su R, Lin J-M, Uchiyama K, Yamada M. Talanta. 2004;64:1024–1029. doi: 10.1016/j.talanta.2004.04.024. [DOI] [PubMed] [Google Scholar]
- 37.Tsukagoshi K, Saito T, Nakajima R. Talanta. 2008;77:514–517. [Google Scholar]
- 38.Simpson JS, Campbell AK, Ryall ME, Woodhead JS. Nature. 1979;279:646–647. doi: 10.1038/279646a0. [DOI] [PubMed] [Google Scholar]
- 39.Seitz WR. Clin. Biochem. 1984;17:120–125. doi: 10.1016/s0009-9120(84)90318-7. [DOI] [PubMed] [Google Scholar]
- 40.Hogan BL, Yeung ES. Anal Chem. 1992;64:2841–2845. doi: 10.1021/ac00046a031. [DOI] [PubMed] [Google Scholar]


