

Abstract
Motivation: Microbial phenotypes are typically due to the concerted action of multiple gene functions, yet the presence of each gene may have only a weak correlation with the observed phenotype. Hence, it may be more appropriate to examine co-occurrence between sets of genes and a phenotype (multiple-to-one) instead of pairwise relations between a single gene and the phenotype. Here, we propose an efficient class association rule mining algorithm, netCAR, in order to extract sets of COGs (clusters of orthologous groups of proteins) associated with a phenotype from COG phylogenetic profiles and a phenotype profile. netCAR takes into account the phylogenetic co-occurrence graph between COGs to restrict hypothesis space, and uses mutual information to evaluate the biconditional relation.
Results: We examined the mining capability of pairwise and multiple-to-one association by using netCAR to extract COGs relevant to six microbial phenotypes (aerobic, anaerobic, facultative, endospore, motility and Gram negative) from 11 969 unique COG profiles across 155 prokaryotic organisms. With the same level of false discovery rate, multiple-to-one association can extract about 10 times more relevant COGs than one-to-one association. We also reveal various topologies of association networks among COGs (modules) from extracted multiple-to-one correlation rules relevant with the six phenotypes; including a well-connected network for motility, a star-shaped network for aerobic and intermediate topologies for the other phenotypes. netCAR outperforms a standard CAR mining algorithm, CARapriori, while requiring several orders of magnitude less computational time for extracting 3-COG sets.
Availability: Source code of the Java implementation is available as Supplementary Material at the Bioinformatics online website, or upon request to the author.
Contact: makio323@gmail.com
Supplementary information: Supplementary data are available at Bioinformatics online.
1 INTRODUCTION
The causal relationship between microbial genotype and phenotype can be extrapolated from co-occurrence of genes and phenotypes across a wide range of genomes. A phylogenetic profile (Eisen, 1998; Pellegrini et al., 1999) is a vector encoding the presence and absence of a gene across sequenced genomes. We can likewise construct a phenotype profile (Jim et al., 2004) (Table 1), indicating as to which organisms exhibit the phenotypic trait. Systematic comparison (Goh et al., 2006; Jim et al., 2004; Korbel et al., 2005) can provide us with genotype–phenotype relationships and clues to understand the underlying biological mechanisms. Slonim et al., (2006) proposed a method to extract preferentially co-inherited generic modules, clusters of genes that have significant pairwise association with the phenotype observation.
Table 1.
An example phenotype profile and phylogenetic profiles for three COGs (COGA–COGC) across six organisms (O1–O6)
| Organism | O1 | O2 | O3 | O4 | O5 | O6 | |||||||
|---|---|---|---|---|---|---|---|---|---|---|---|---|---|
| Phenotype | 0 | 0 | 1 | 1 | 0 | 0 | |||||||
| COGA | 1 | 1 | 1 | 1 | 0 | 0 | |||||||
| COGB | 0 | 0 | 1 | 1 | 1 | 1 | |||||||
| COGC | 1 | 1 | 1 | 1 | 1 | 0 |
Clusters of orthologous groups (COGs) of proteins (Tatusov et al., 1997, 2003) provide a mapping between genes and their orthologs across sequenced genomes, and are an informative abstraction of genes for the construction of phylogenetic profiles. In this research, we compile 11 969 unique phylogenetic profiles of COGs for 155 prokaryotes from the STRING (Von Mering et al., 2007) database. Individual COG phylogenetic profiles may only show a relatively weak correlation with a phenotype profile, even when the corresponding gene is essential for the phenotype. As an example, in Table 1, the profiles of COGA COGB, and COGC have a weak pairwise relationship with the phenotype profile. However, when all of these COGs are present, the phenotype is always observed. Such an association between a set of genes to a phenotype (multiple-to-one) may suggest the importance of co-occurrence of these genes for the phenotype, potentially indicating an epistatic genetic interaction between them (Moore and Williams, 2005).
Class association rule (CAR) mining is a data mining technique to extract sets of items relevant with a class of interest. A standard CAR mining algorithm, CARAPRIORI (Agrawal and Srikant, 1994; Liu, 2006), finds if–then rules: Set of items⇒class; here, the rule may represent a hypothesis relating co-occurrence of a set of COGs and the presence of a phenotype. Bowers et al. (2004) suggested a method to derive more general logical rules by exhaustive enumeration, an approach that is computationally intractable for combinations of more than two COGs. Rule induction algorithms such as sequential covering by CN2 (Clark and Boswell, 1991) or simultaneous covering by decision tree algorithms (Quinlan, 1986) can also mine if–then rules, but they only discover small numbers of rules for efficient prediction or classification purposes, while CAR mining comprehensively searches for all rules satisfying some criterion. Here, we present a new CAR mining algorithm NETCAR to extract sets of COGs associated with a target phenotype.
2 PROBLEM
Conventionally, a CAR mining algorithm uses Confidence and Support where Confidence is the conditional probability of observation of the class (phenotype) given the set of items (COGs), and Support is the fraction of samples (genomes) in which the rule is valid in the data. When we have a rule such as COGA and COGB⇒phenotypeC with 100% Confidence, phenotypeC is observed whenever COGA and COBB are present in a genome. However, this rule may not have much biological relevance unless the converse relation holds as well, i.e. whenever phenotypeC is observed, COGA and COGB tend to be present. In order to measure how well the set of COGs approximate a necessary and sufficient condition for the presence of the phenotype: Set of COGs ⇔ phenotype, we use mutual information (MI) (Cover and Thomas, 1991) to evaluate the association between the COG combination profile (see Section 4) and phenotype profile (Slonim et al., 2006).
The main problem with CAR mining is how to narrow down the hypothesis space. The space of all possible sets of s COGs is O(ms) where m is the total number of COGs, hence brute-force search becomes intractable for large m or s. In our case, there are more than 285 billion possible 3-COG sets out of 11 969 unique COG profiles, so we need to use heuristics to focus on a subset of the most promising candidate sets. CARAPRIORI uses the downward closure property based on minimum Support (Agrawal and Srikant, 1994), and it guarantees to exhaust all candidate sets that satisfy the minimum Support. However, when we use small minimum Support to avoid missing interesting rules, the size of hypothesis space can become exponential in the size of the set, making it very expensive to extract sets of 3 or more COGs by CARAPRIORI. What is worse, our dataset has many more items (COGs) than samples (genomes), contrary to the type of market basket data for which CARAPIORI was originally developed, and CARAPRIORI may tend to generate many irrelevant rules (Liu et al., 2006).
Instead of the exhaustive selection, we propose a new algorithm to narrow down hypothesis space restricted by a COG connectivity graph (Butte and Kohane, 2000; Klus et al., 2001; Moriyama et al., 2003). where each node is a COG and edges are assigned between COGs for which the mutual information between their phylogenetic profiles exceeds a certain threshold value. This has a 2-fold benefit: to reduce computation time, and to generate rules consisting of genes which are more likely to have some biologically relevant functional association with each other. COGs which have similar phylogenetic profile are likely to be functionally associated (Overbeek et al., 1999; Pellegrini et al., 1999). Supplementary Figure S1 in supporting information shows the distribution of mutual information between pairs of phylogenetic profiles of COGs corresponding to enzymes that are connected via a compound in a KEGG pathway map (Kanehisa and Goto, 2000; Ogata et al., 1999), compared to those of randomly selected COG pairs. The figure illustrates that a pair of COGs with a high mutual information is likely to have some functional connection (Von Mering et al., 2003).
3 ALGORITHM
The basic algorithm is as follows: (1) select Parent COGs whose profile shows strong pairwise association with a phenotype profile of interest and Child COGs that are no more than s−1 steps away from a Parent on the COG connectivity graph (where s is the size of the rules we want to construct); (2) generate candidate COG sets containing at least one Parent, which form a connected subgraph on the COG connectivity graph; and (3) evaluate mutual information between the combined phylogenetic profile of each set with the phenotype profile.
Algorithm 1 shows pseudocode of an implementation of the NETCAR algorithm. It takes a profile matrix M, a phenotype profile phe, the size of the set in a rule s and three mutual information thresholds, mMIp, mMIc and mMIr. GETCONNECTIVITYGRAPH at line 11 constructs a connectivity graph G of COGs, where an edge is assigned if the mutual information between two COG profiles exceeds the threshold value mMIc. SELECTPARENT at line 12 returns a list of indexes of Parents, pa, whose mutual information with the phenotype phe exceeds the user-defined threshold value mMIp. SELECTCHILD at line 13 returns a list of Children, ch, which are within s−1 steps from a Parent on the connectivity graph G. pa and ch are combined into one target COG index array t: p1, p2, … , psize(pa), c1, c2, …, csize(ch) (at line 14). For sets up to size 4, we can check that the COG set forms a connected subgraph by requiring that the sum of pairwise distances between COGs be smaller than or equal to maxPL (line 15), the sum of distances for a linear s-node path (for s≥5, this heuristic may yield some unconnected subgraphs). The all-to-all shortest distance matrix D is precomputed by the FLOYD-WARSHALL algorithm at line 16. Starting from a single Parent, successively larger sets up to size s are generated by adding additional Parents or Children, inside the while loop (line 23 onwards). Intermediate sets that would exceed a valid sum of distances, maxPL, are pruned early (line 28); otherwise, they are pushed back onto the stack for further expansion. When the size of a set reaches s (at line 32), a combined vector v is constructed by taking the intersection (AND rule) of the phylogenetic profiles of all the COGs in the set (line 33), and the mutual information between v and the phenotype profile phe is computed. If the value is larger than the user-defined mMIr, then the set is added to the collection of rules rules (lines 36–39).
4 MATERIALS AND METHODS
4.1 Data
We constructed the phylogenetic profile matrix M from the STRING version 7.0 database (Von Mering et al., 2007), an extension of the original COG database (Tatusov et al., 2003). The mapping table contains presence/absence of 4873 COGs, plus an extended set of 33 858 non- supervised orthologous groups (NOGs) to cover genes that are not included in the original COG database. Here we use only the 155 representative core prokaryotic organisms (out of 337 prokaryotes in STRING 7.0), in order to mitigate the sequencing bias among lineages. There are only 11 969 unique phylogenetic profiles out of original 38 731 COG and NOG profiles (for the remainder, we ignore the distinction between COG and NOGs). We used the dataset generated by Slonim et al., (2006) for six binary phenotype profiles, combined with additional data from NCBI's GenomeProject database, the Joint Genome Institute's Integrated Microbial Genomics (IMG) system (Markowitz et al., 2006), the Genomes Online Database (Kyrpides, 1999) and literature. There are 62 aerobic, 31 anaerobic, 42 facultative, 11 endospore forming, 76 motile and 95 Gram-negative organisms in our dataset. The enzyme connections used in the COG pair analysis is extracted from the KEGG LIGAND database as of July 9, 2007.
 |
4.2 Phylogenetic profile and phenotype profile
The phylogenetic profiles is represented by a binary matrix M∈[0,1] m × n, and a phenotype profile is represented by a binary vector phe∈[0,1] 1 × n where m is the total number of COGs and n is the number of genomes. The i-th row vector of M represents the phylogenetic profile of the i-th COG, where the j-th element indicates presence or absence of this COG in the j-th genome. Likewise, the j-th element of phe shows presence or absence of a phenotype in the j-th organism.
Multiple phylogenetic profiles are combined into a single vector v∈[0, 1] 1 × n where the j-th element is equal to 1 only if the j-th elements of all the COG profiles are equal to 1 (i.e. the combined profile vector is the AND function of the individual COG phylogenetic profiles).
4.3 Mutual information
Mutual information MI(Cover and Thomas, 1991) between two binary vectors u, v∈[0, 1]1×n is calculated as follows; MI(u; v)=∑y∈[0,1]∑x∈[0,1]P(x, y)logP(x, y)/P(x)P(y) where x and y are the values of u and v, respectively, and P() is the probability function.
4.4 Connectivity graph for a phylogenetic profile
For the phylogenetic profiles M∈[0,1]m×n where m is the total number of COGs and n is the number of genomes, the i-th row vector mi represents the phylogenetic profile of the i-th COG. We can construct an adjacency matrix of the connectivity graph  as follows: gi,j=1 if MIi,j≥mMIc or otherwise 0, where MIi,j is mutual information between mi and mj, and mMIc is a threshold value.
4.5 FDR
We used a random permutation method proposed by Zhang and Padmanabhan, (2004) to measure an FDR. If No and Nr are the number of rules that have a mutual information MI or higher with respect to the original and randomly permutated phenotype profile, respectively, then No/Nr is a simple estimated positive FDR (Storey and Tibshirani, 2003), for the given mutual information MI. We calculated the median value of No/Nr from 200 random permutation experiments. We can scan all pairwise associations, but it takes too much time to scan all 2-COG and 3-COG associations. Therefore, we randomly selected as many 2- and 3-COG sets from the COG phylogenetic profile as possible within 15 min computational time; 3.6 × 10⁵ (0.5% of all possible 2-COG combinations) and 5.7 × 10⁵ (0.0002% of all 3-COG combinations), respectively. This process is repeated 500 times, and FDR for the mutual information MI is calculated as an average of the median value. Supplementary Figure S11 of supporting information shows the relationships between mutual information and FDR for pairwise, 2-COG and 3-COG rules for all six phenotypes.
4.6 Experimental parameters
Experiments were performed under version 1.6 Java runtime environment on a 64 bit Linux machine with 7.0 Gb memory and 3.00 GHz CPU power. For rule mining by NETCAR, the mutual information to select Parent COGs, mMIp, is adjusted to FDR level of 0.1% The threshold mutual information, mMIc, is set to 1.1 × average mutual information among Parents for 2- and 3-COG rule mining.
5 RESULTS AND DISCUSSION
5.1 Controlling for multiple hypothesis testing using false discovery rate
Because of the large number of rules evaluated by CAR mining; we controlled the statistical significance of the resulting rules by false discovery rate (FDR) (Benjamini and Hochberg, 1995; Storey and Tibshirani, 2003; Zhang and Padmanabhan, 2004). FDR is the expected proportion of true null hypotheses among all rejected hypotheses in a multiple hypotheses evaluation, i.e. the expected proportion of false positives among our results, and we can compare the efficiency of different approaches by the number of relevant rules and COGs they are able to extract at the same FDR level. Previous work on pairwise genotype–phenotype associations (Goh et al., 2006; Jim et al., 2004) estimated significance based on a conservative Bonferroni correction on P-values derived from a hypergeometric distribution. A traditional family-wise error rate (FWER) (Shaffer, 1995) approach such as Bonferroni essentially calculates the probability of making even a single error (or more) among all of the evaluated rules under the null hypothesis. In cases where a very large number of hypotheses are to be tested, and multiple positive results are expected, FWER is far too conservative, and correcting for FDR is more appropriate. For this same reason, FDR is also the method of choice for extracting multiple significantly expressed genes out of the thousands represented on a gene expression microarray (Pounds, 2006; Storey and Tibshirani, 2003). We adjusted threshold mutual information by FDR level for each rule mining, and compare the pairwise and multiple-to-one association rule mining by using NETCAR. The detailed experimental procedure to measure FDR is given earlier in Section 4.
For 2- and 3-COG rule generation from our dataset, NETCAR starts with Parents of 0.1% FDR level. In the case of 3-COG rule mining, the NETCAR algorithm eventually evaluates about 105–109 candidate sets when we set the final rule threshold mutual information (mMIr) of 0.1% FDR level. Overall, NETCAR takes less than 5 min to mine 3-COG rules for one phenotype, the majority of which is taken up by precomputing the COG connectivity graph and distance matrix. In comparison, it takes at least 10 h to explore all 3-COG sets with 0.1% FDR level of Parents and the same size of Children. Hence, the selection strategy using the connectivity graph significantly reduces the amount of computational time. We estimate that it would take more than 1 month to mine 3-COG rules by CARAPRIORI to extract rules with the same level of FDR.
5.2 Multiple-to-one association rules and genetic module
Figure 1a shows the number of unique COGs found in pairwise, 2-COG and 3-COG association rules within various FDR levels where broken line corresponds to the number of uncharacterized COGs. The number of unique COGs is roughly linear to the number of extracted rules (Supplementary Fig. S2) and up to around 15% are uncharacterized COGs by any associations. With the same FDR, the multiple-to-one association reveals substantially larger number of relevant COGs than pairwise association does, except for motility. Figure 1b shows the number of COGs that are extracted by multiple-to-one association with FDR of 0.1% , but are not covered by pairwise association with much relaxed FDR level. Except for motility and endospore, the pairwise method fails to capture a large number of COGs, including many uncharacterized ones, even when the FDR level is relaxed up to 10%. We find 38 uncharacterized COGs that are mined in 3-COG association rules for the aerobic phenotype with a FDR level<0.1%, but are not covered by pairwise association with very relaxed FDR level of 10%. With the same condition, we also find 52, 55, 2, 52 uncharacterized COGs for anaerobic, facultative, endospore and Gram-negativity phenotype. A list of these COGs in 3-COG association rules, but are not covered by pairwise association with relaxed FDR level of 10%, are also available in supporting information.
Fig. 1.
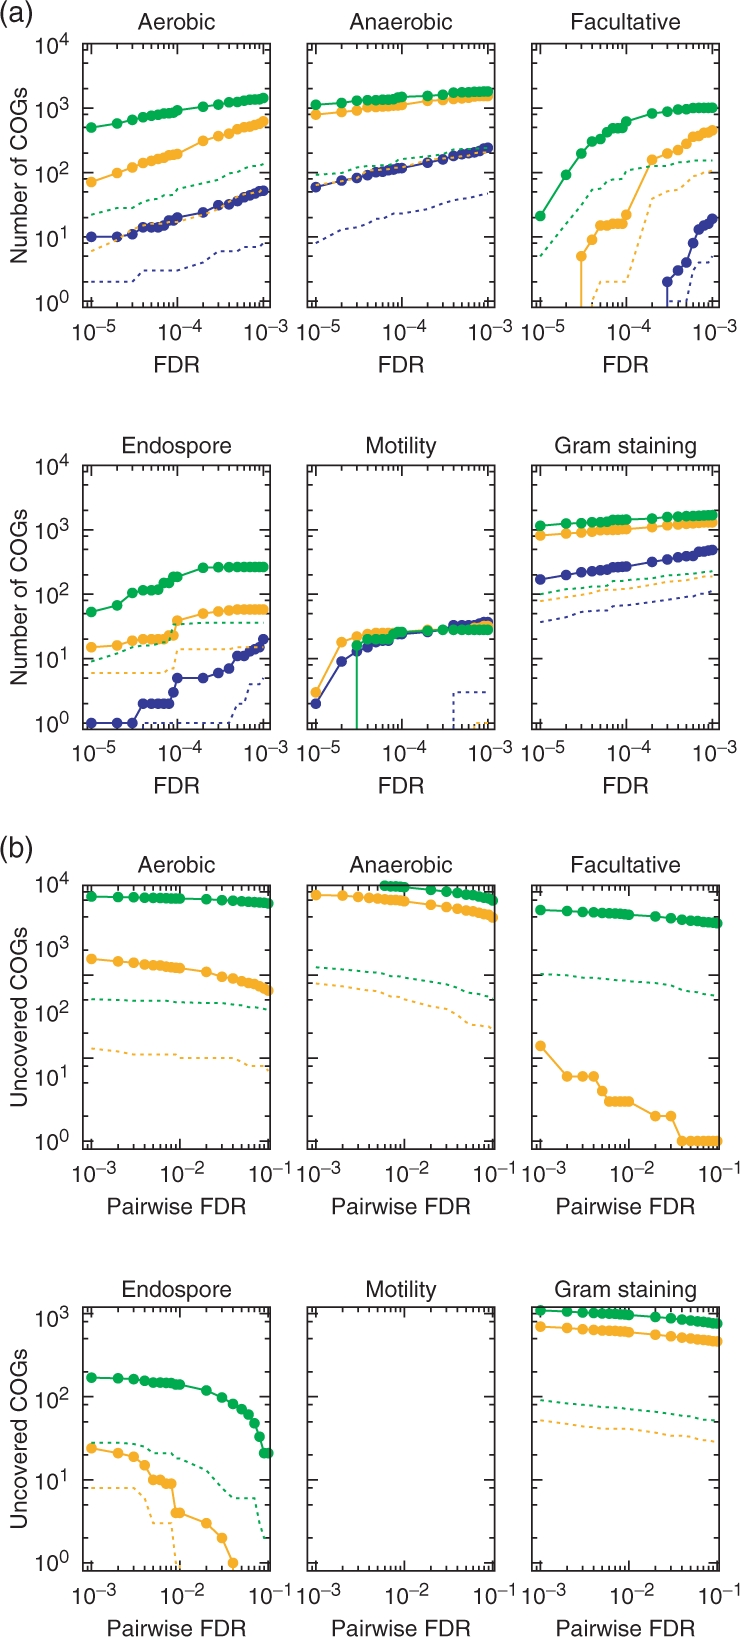
(a) Number of unique COGs in extracted rule within FDR levels. Blue, orange and green lines are 1-COG, 2-COG and 3-COG rules, respectively, and broken lines are number of uncharacterized COGs in the same colored association rules. (b) Number of unique COGs that are in 2- and 3-COG association rules with FDR of 1.0 × 10⁻⁴ but are not in pairwise association rules with much relaxed FDR level ranging between 1.0 × 10⁻³ and 1.0 × 10⁻¹. (Values for motility are 0, hence the missing curves for that phenotype.)
We compile association networks from 3-COG positively associated rules with a stringent FDR level (Fig. 2), indicating which COGs occur in the top rules, how frequently and in which combination. The list of these COGs are available in supporting information. We observed two distinctive types of association network topology: (1) Clique type networks, such as the motility module, where genes are well associated with each other and (2) Star type networks, typified by the aerobic module, where a few COGs have links to many other COGs in a star-like topology. It is interesting to note that even with a relaxed FDR, there are many green nodes that have a weak association with the target phenotype, with the exception of the motility phenotype, for which pairwise association may be appropriate to extract associated COGs. What is more, pairs of COGs with similar profiles (darker blue edge) do not always form the most frequently observed COG combinations (wider edges) in these networks. This type of COG association can be considered as a functional module, even though the individual phylogenetic profiles may be quite divergent. This concept is complementary to the concept of a module used by Slonim et al., (2006), in which each COG profile has a significant pairwise correlation to a phenotype profile, and profiles in the same module are similar to each other. Indeed, the well-connected components in the Clique-type networks are similar to the modules defined by Slonim et al.; however, for the other phenotypes, the relevant COGs do not always have a strong pairwise association, but the module can be understood by a Star or mixed-type network. Previous work (Ravasz et al., 2002) suggests that the metabolic network is more consistent with a fractal structure model, a mixture of a scale-free (Jeong et al., 2000) and modular network. The pairwise method may have an intrinsic problem discovering relevant genes in such a structure. In contrast, the multiple-to-one method can explore the associated genes with weak pairwise associations. The biological reason behind the presence of individual COGs in the rule will require further investigation, but a brief overview of the resulting networks is given subsequently.
Fig. 2.

(a–f) COG association graphs for the six phenotypes. The nodes are COGs involved in the rules within FDR level of 1.5 × 10⁻⁵, 5.0 × 10⁻⁸, 1.5 × 10⁻⁵, 1.0 × 10⁻⁵, 5.0 × 10⁻⁵ and 5.0 × 10⁻¹⁴ for aerobic, anaerobic, facultative, endospore, motility and Gram negativity phenotypes, and edges show that the linked COGs are used in the same rule. The orange nodes are COG covered by pairwise association with 100 times relaxed FDR except for anaerobic and Gram negativity with FDR of 0.01, while the green nodes represent the other COGs with a weaker pairwise correlation. The size of each node and the width of each edge are proportional to the frequencies of the corresponding COG and link in the extracted rules, respectively. Darker edges indicate a closer profile similarity between the linked COGs.
5.3 Genetic module and COG functions
5.3.1 Aerobic
Both the aerobic and anaerobic networks contain redox-active proteins. Mutual information captures both positive and negative correlations. The aerobic phenotype is the only one we tested for which the negatively correlated rules are dominant. We found many oxygen-sensitive enzymes in these negatively associated rules, while enzymes that detoxify active oxygen derivatives occur in positively associated rules. The capability to extract both positive and negative association is one of the advantages of CARAPRIORI, compared to the standard CAR mining algorithm, CARAPRIORI, which can only extract positively correlated rules. Oxidase complex and dehydrogenase enzymes are frequent strong pairwise association COGs (orange node) while Dinucleotide (FAD)/ flavin mononucleotide (FMN)-containing dehydrogenase, oxidoreductases, the pyruvate dehydrogenase complex, catalyzing oxidative decarboxylation of pyruvate to form acetyl-CoA, and peroxiredoxin, a family of multifunctional antioxidant enzymes, are dominant COGs with a weak pairwise association (green node) in the aerobic network. Citrate synthase, one of the major green nodes, catalyzes the reaction to produce citrate from acetyl-CoA and oxyalacetate at the first step of the citric acid cycle in aerobic respiration.
5.3.2 Anaerobic
Oxygen toxicity in anaerobes was thought to be due to the absence of superoxide dismutase, although recent genomic studies suggest that this may not be the discriminative factor, and that the mechanisms behind microbial sensitivity to oxygen may as yet be unknown (Madigan et al., 2000). Oxygen-sensitive and redox-related proteins, such as 6Fe–6S cluster proteins, activator of 2-hydroxyglutaryl-CoA dehydratase, cobalamin biosynthesis protein CbiD or pyruvate-formate lyase-activating enzyme, etc., including many weak pairwise association proteins, appear in the anaerobic network, but many of these proteins may be also found in aerobes.
5.3.3 Facultative
Enzymes in the fermentation pathway such as the phosphotransferase system IIA, IIB and IIC components, form a connected component in the facultative network, in combination with COG3091, an uncharacterized protein conserved primarily within the Bacilli. A second major uncharacterized protein, COG3094, is conserved mainly within the betaproteobacteria, and is associated with several other membrane-associated COGs. Facultative microbes may contain both genes of aerobic respiration and genes for fermentation or anaerobic respiration, as well as genes for detoxifying active oxygen derivatives.
5.3.4 Endospore
A regulator of polyketide synthase expression, an AT-rich DNA-binding protein, cell division initiation protein, transcription regulator and uncharacterized COG1799 and COG1302 are the main COGs. It has been reported that more than 200 genes may be involved in the endospore formation process (Madigan et al., 2000), but the large population of weak pairwise association COGs in the extracted rules suggest that many of endospore-relevant proteins may be used in other biological functions as well.
5.3.5 Motility
Flagellar apparatus proteins form a well-connected graph. This network forms a genetic module with a clear boundary, in which each gene has a strong pairwise association with the phenotype observation. Therefore, the number of extracted COGs both in the pairwise and multiple-to-one association are the same, and its upper bound is well limited within a certain number, about 20–30 COGs for the motility phenotype. However, only motility phenotype has this shape in our six phenotypes. Figure 2 only shows flagellar apparatus COGs. Another well-connected network is formed by chemotaxis-related COGs.
5.3.6 Gram negative
The biological relationship of Gram negativity with cell wall structure is well understood; a membrane with a thick peptidoglycan layer stains Gram positive while organisms with a periplasm with thin peptidoglycan and outer membrane stain Gram negative. Indeed, outer-membrane proteins and various transport system proteins that may be used for the membrane proteins (Jedrzejas and Huang, 2003) form a graph in the Gram-negative network. However, both pairwise and multiple-to-one association extracted relatively large number of COGs with Gram-negative bacteria, but may not relevant with the Gram-stain mechanism.
6 CONCLUSION
We developed a new class association rule mining algorithm, NETCAR that extracts multiple-to-one relationships between COGs and a phenotype of interest, from a COG phylogenetic and the phenotype profile. NETCAR is much more efficient than a standard CAR mining algorithm, CARAPRIORI in computational time. The multiple-to-one association rules with stringent FDR level for aerobic, anaerobic, facultative, endospore and Gram-negative phenotype contain significantly larger numbers of COGs than those by pairwise methods. We compiled association network from extracted 3-COG rules and revealed that the network cannot only have a Clique structure, as implicitly assumed by previous pairwise methods, but also a Star-type topology that contains large number of COGs whose occurrence is only weakly correlated with a phenotype observation. These results indicate that a gene module can be a combination of genes that span some depth in a biological network, from a layer where we can see strong pairwise association. The NETCAR algorithm is a powerful CAR mining algorithm that can be used to extract relevant genes (COGs) associated with a phenotype observation, that cannot be elucidated by simple pairwise comparisons. We also discuss the phenotype prediction capability of extracted rules in the supporting material. It is often the case that the dimensionality of large-scale biological data (in our case, number of COGs) is much larger than the number of samples (genomes), and the NETCAR algorithm may be appropriate to extract associations from other such data types. For example, NETCAR may be able to mine co-regulatory gene network modules relevant with a target physiological observation, from microarray data with many more genes than expression arrays.
Supplementary Material
ACKNOWLEDGEMENTS
The authors would like to thank Bing Liu for many helpful discussions and Yiming Ma for allowing us to use their CBA system (Liu et al., 1998). We also thank Eivind Almaas and Cheol-Min Ghim for many productive discussions about the network analysis, and Yongqin Jiao for valuable suggestions about the functional explanation of COGs.
Funding: This work was performed under the auspices of the US Department of Energy by Lawrence Livermore National Laboratory (LLNL) in part under Contract No. W-7405-Eng-48 and in part under Contract DE-AC52-07NA27344. The project (05-ERD-065) was funded by the Laboratory Directed Research and Development Program at LLNL.
Conflict of Interest: none declared.
REFERENCES
- Agrawal R, Srikant R. Proceedings of the 20th International Conference on Very Large Data Bases. 1994. Fast algorithms for mining association rules in large databases; pp. 487–499. [Google Scholar]
- Benjamini Y, Hochberg Y. Controlling the false discovery rate: a practical and powerful approach to multiple testing. J. Roy. Stat. Soc. B Met. 1995;57:289–300. [Google Scholar]
- Bowers P, et al. Use of logic relationships to decipher protein network organization. Science. 2004;306:2246–2249. doi: 10.1126/science.1103330. [DOI] [PubMed] [Google Scholar]
- Butte A, Kohane I. Mutual information relevance networks: functional genomic clustering using pairwise entropy measurements. Pac. Symp. Biocomput. 2000;5:427–439. doi: 10.1142/9789814447331_0040. [DOI] [PubMed] [Google Scholar]
- Clark P, Boswell R. Rule induction with CN2: some recent improvements. Proceedings of the Fifth European Working Session on Learning. 1991;482:151–163. [Google Scholar]
- Cover T, Thomas J. Elements of Information Theory. New York: Wiley; 1991. [Google Scholar]
- Eisen J. Phylogenomics: improving functional predictions for uncharacterized genes by evolutionary analysis. Genome Res. 1998;8:163–167. doi: 10.1101/gr.8.3.163. [DOI] [PubMed] [Google Scholar]
- Goh C-S, et al. Integration of curated databases to identify genotype-phenotype associations. BMC Genomics. 2006;7:257–257. doi: 10.1186/1471-2164-7-257. [DOI] [PMC free article] [PubMed] [Google Scholar]
- Jedrzejas M, Huang W. Bacillus species proteins involved in spore formation and degradation: from identification in the genome, to sequence analysis, and determination of function and structure. Crit. Rev. Biochem. Mol. Biol. 2003;38:173–198. doi: 10.1080/713609234. [DOI] [PubMed] [Google Scholar]
- Jeong H, et al. The large-scale organization of metabolic networks. Nature. 2000;407:651–654. doi: 10.1038/35036627. [DOI] [PubMed] [Google Scholar]
- Jim K, et al. A cross-genomic approach for systematic mapping of phenotypic traits to genes. Genome Res. 2004;14:109–115. doi: 10.1101/gr.1586704. [DOI] [PMC free article] [PubMed] [Google Scholar]
- Kanehisa M, Goto S. KEGG: kyoto encyclopedia of genes and genomes. Nucleic Acids Res. 2000;28:27–30. doi: 10.1093/nar/28.1.27. [DOI] [PMC free article] [PubMed] [Google Scholar]
- Klus G, et al. Mutual information analysis as a tool to assess the role of aneuploidy in the generation of cancer-associated differential gene expression patterns. Pac. Symp. Biocomput. 2001;42:51. doi: 10.1142/9789814447362_0005. [DOI] [PubMed] [Google Scholar]
- Korbel J, et al. Systematic association of genes to phenotypes by genome and literature mining. PLoS Biol. 2005;3:134–134. doi: 10.1371/journal.pbio.0030134. [DOI] [PMC free article] [PubMed] [Google Scholar]
- Kyrpides N. Genomes online database (Gold 1.0): a monitor of complete and ongoing genome projects world-wide. Bioinformatics. 1999;15:773–774. doi: 10.1093/bioinformatics/15.9.773. [DOI] [PubMed] [Google Scholar]
- Liu B. Web Data Mining Exploring Hyperlinks, Contents, and Usage Data. Berlin, Heidelberg, New York: Springer; 2006. [Google Scholar]
- Liu B, et al. Proceedings of the Fourth International Conference on Knowledge Discovery and Data Mining. New York: ACM SIGKDD; 1998. Integrating classification and association rule mining; pp. 80–86. [Google Scholar]
- Liu B, et al. Proceedings of the 12th ACM SIGKDD International Conference on Knowledge discovery and Data Mining. 2006. Rule interestingness analysis using OLAP operations; pp. 297–306. [Google Scholar]
- Madigan M, et al. Brock Biology of Microorganisms. Upper Saddle River, NJ: Prentice Hall; 2000. [Google Scholar]
- Markowitz V, et al. The integrated microbial genomes (IMG) system. Nucleic Acids Res. 2006;34:344–348. doi: 10.1093/nar/gkj024. [DOI] [PMC free article] [PubMed] [Google Scholar]
- Moore J, Williams S. Traversing the conceptual divide between biological and statistical epistasis: systems biology and a more modern synthesis. BioEssays. 2005;27:637–646. doi: 10.1002/bies.20236. [DOI] [PubMed] [Google Scholar]
- Moriyama M, et al. Relevance network between chemosensitivity and transcriptome in human hepatoma cells 1. Mol. Cancer Ther. 2003;2:199–205. [PubMed] [Google Scholar]
- Ogata H, et al. KEGG: Kyoto encyclopedia of genes and genomes. Nucleic Acids Res. 1999;27:29–34. doi: 10.1093/nar/27.1.29. [DOI] [PMC free article] [PubMed] [Google Scholar]
- Overbeek R, et al. The use of gene clusters to infer functional coupling. Proc. Natl Acad. Sci. USA. 1999;96:2896–2901. doi: 10.1073/pnas.96.6.2896. [DOI] [PMC free article] [PubMed] [Google Scholar]
- Pellegrini M, et al. Assigning protein functions by comparative genome analysis: protein phylogenetic profiles. Proc. Natl Acad. Sci. USA. 1999;96:4285–4288. doi: 10.1073/pnas.96.8.4285. [DOI] [PMC free article] [PubMed] [Google Scholar]
- Pounds S. Estimation and control of multiple testing error rates for microarray studies. Brief. Bioinform. 2006;7:25–36. doi: 10.1093/bib/bbk002. [DOI] [PubMed] [Google Scholar]
- Quinlan J. Induction of decision trees. Mach. Learn. 1986;1:81–106. [Google Scholar]
- Ravasz E, et al. Hierarchical organization of modularity in metabolic networks. Science. 2002;297:1551–1555. doi: 10.1126/science.1073374. [DOI] [PubMed] [Google Scholar]
- Shaffer J. Multiple hypothesis testing. Ann. Rev. Psychol. 1995;46:561–584. [Google Scholar]
- Slonim N, et al. Ab initio genotype-phenotype association reveals intrinsic modularity in genetic networks. Mol. Syst. Biol. 2006;2 doi: 10.1038/msb4100047. [DOI] [PMC free article] [PubMed] [Google Scholar]
- Storey J, Tibshirani R. Statistical significance for genomewide studies. Proc. Natl Acad. Sci. USA. 2003;100:9440. doi: 10.1073/pnas.1530509100. [DOI] [PMC free article] [PubMed] [Google Scholar]
- Tatusov R, et al. A genomic perspective on protein families. Science. 1997;278:631–637. doi: 10.1126/science.278.5338.631. [DOI] [PubMed] [Google Scholar]
- Tatusov R, et al. The COG database: an updated version includes eukaryotes. BMC Bioinformatics [electronic resource] 2003;4:41–41. doi: 10.1186/1471-2105-4-41. [DOI] [PMC free article] [PubMed] [Google Scholar]
- Von Mering C, et al. STRING: a database of predicted functional associations between proteins. Nucleic Acids Res. 2003;31:258–261. doi: 10.1093/nar/gkg034. [DOI] [PMC free article] [PubMed] [Google Scholar]
- Von Mering C, et al. STRING 7–recent developments in the integration and prediction of protein interactions. Nucleic Acids Res. 2007;35:358–362. doi: 10.1093/nar/gkl825. [DOI] [PMC free article] [PubMed] [Google Scholar]
- Zhang H, Padmanabhan B. Using randomization to determine a false discovery rate for rule discovery; Proceedings of the Fourteenth Workshop On Information Technologies And Systems;; December 11–12, 2004; WITS, Washington, DC. 2004. pp. 140–145. [Google Scholar]
Associated Data
This section collects any data citations, data availability statements, or supplementary materials included in this article.