

Abstract
Motivation: Within a homologous protein family, proteins may be grouped into subtypes that share specific functions that are not common to the entire family. Often, the amino acids present in a small number of sequence positions determine each protein's particular function-al specificity. Knowledge of these specificity determining positions (SDPs) aids in protein function prediction, drug design and experimental analysis. A number of sequence-based computational methods have been introduced for identifying SDPs; however, their further development and evaluation have been hindered by the limited number of known experimentally determined SDPs.
Results: We combine several bioinformatics resources to automate a process, typically undertaken manually, to build a dataset of SDPs. The resulting large dataset, which consists of SDPs in enzymes, enables us to characterize SDPs in terms of their physicochemical and evolution-ary properties. It also facilitates the large-scale evaluation of sequence-based SDP prediction methods. We present a simple sequence-based SDP prediction method, GroupSim, and show that, surprisingly, it is competitive with a representative set of current methods. We also describe ConsWin, a heuristic that considers sequence conservation of neighboring amino acids, and demonstrate that it improves the performance of all methods tested on our large dataset of enzyme SDPs.
Availability: Datasets and GroupSim code are available online at http://compbio.cs.princeton.edu/specificity/
Contact: msingh@cs.princeton.edu
Supplementary information: Supplementary data are available at Bioinformatics online.
1 INTRODUCTION
Proteins can be classified into thousands of families on the basis of similar sequence patterns, shared structural motifs, experimentally determined common functions or combinations thereof. The proteins within a single family usually share a common general function, but can exhibit a range of more specific functions. The enzymes provide many examples of this sort of family organization. For example, all members of the nucleotidyl cyclase family transform nucleotide triphosphates into cyclic monophosphates, but some act on ATP while others act on GTP. Similar behavior is seen among DNA-binding proteins, proteins mediating protein–protein interactions and membrane proteins.
A set of proteins within a family that, as described above, share a specific function that is not common to the entire family have been called specificity groups (Mirny and Gelfand, 2002). Specificity groups within a protein family can be determined in a number of ways; for example, within a homologous protein family, the sets of orthologs can each comprise a specificity group. In many families, the amino acids present in a small number of sequence positions determine the particular functional specificity of member proteins. Identification of these specificity-determining positions (SDPs) for a protein family is important not only because it provides insight into the mechanisms by which nature achieves its astonishing functional diversity, but also because it enables the assignment of specific functions to uncharacterized proteins (Hannenhalli and Russell, 2000). In addition, since SDPs are usually involved in the identification and binding of substrate molecules, knowledge of SDPs can be relevant to drug design, protein engineering and pathway analysis.
Nearly all computational methods for identifying SDPs attempt to identify columns in multiple sequence alignments (MSAs) whose amino acid composition is related to the division of the sequences into functional specificity groups. Several early computational methods apply a range of statistical and phylogenetic techniques to the problem (Casari et al., 1995; Lichtarge et al., 1996; Livingstone and Barton, 1993). More recently, a number of information-theoretic methods have been developed (Donald and Shakhnovich, 2005; Hannenhalli and Russell, 2000; Kalinina et al., 2003; Mayer et al., 2005; Mirny and Gelfand, 2002; Pirovano et al., 2006; Ye et al., 2006). Other statistical, evolutionary and structural approaches have also been applied to the problem Chakrabarti et al., (2007; del Sol Mesa et al., 2003; Kristensen et al., 2008; Manning et al., 2008; Mihalek et al., 2004; Pazos et al., 2006; Wallace and Higgins, 2007; Yu et al., 2005). Several methods address the more difficult problem of additionally identifying family subgroup definitions (Brown et al., 2007; Casari et al., 1995; Marttinen et al., 2006; Pei et al., 2006; Reva et al., 2007).
While there are many SDP prediction methods, their further development has been hindered by the small number of proteins for which exhaustive site-directed mutagenesis experiments have identified residue substitutions that switch functional specificity. Previous computational studies and evaluations have used from 2 to 13 alignments (Chakrabarti et al., 2007; Hannenhalli and Russell, 2000; Kalinina et al., 2003; Pazos et al., 2006; Pei et al., 2006; Pirovano et al., 2006; Wallace and Higgins, 2007; Yu et al., 2005). Perhaps as a result, different existing methods encode different assumptions about the column patterns in MSAs that are indicative of specificity: some reward columns showing amino acid conservation within specificity groups, and others reward columns with little amino acid overlap between groups. Overall, it is not clear what types of amino acid column patterns in MSAs typify SDPs, what physicochemical properties of SDPs should be exploited for prediction, or how well existing approaches perform relative to each other.
This article addresses these problems by automating a process often undertaken by hand to recognize SDPs in the absence of mutation studies (Hannenhalli and Russell, 2000; Kalinina et al., 2003). We build a dataset consisting of hundreds of enzyme protein families annotated with specificity groupings and putative SDPs. Using this large dataset, we make the following contributions to the analysis and prediction of SDPs. First, we find that putative SDP columns in MSAs are distinct from the residue background with respect to their amino acid distribution, secondary structure distribution and relative solvent accessibility. In addition, the observed column patterns indicate that amino acid properties such as polarity and size are less conserved between specificity groups in SDP columns than in all columns, suggesting that these properties are used to distinguish among similar ligands. Second, we demonstrate that alignment columns in which at least one specificity group displays both amino acid conservation and low overlap in amino acid usage with other groups are likely important for indicating specificity. This result from our large-scale column pattern analysis is consistent with the recent findings of Chakrabarti et al. (2007) on a diverse experimentally verified set of SDPs from 13 families. Third, we test a representative set of current sequence-based methods that use MSAs and known specificity groupings to identify SDPs (Hannenhalli and Russell, 2000; Kalinina et al., 2003; Pazos et al., 2006; Pirovano et al., 2006) and show that they provide surprisingly little improvement over GroupSim, a simple method introduced here that uses the same information. Finally, we present a prediction heuristic that considers the conservation of neighboring positions and demonstrate that it improves the performance of all tested SDP prediction methods on our dataset. In particular, GroupSim combined with the conservation window heuristic outperforms all previous methods tested in predicting SDPs on our large dataset of enzyme families. Our main findings regarding performance do not change when considering the smaller set of experimentally verified set of SDPs in Chakrabarti et al. (2007), though the size of our dataset allows us to better distinguish between methods.
Overall, our dataset and testing methodology provide a framework for gaining an understanding of SDPs and SDP prediction methods, and have allowed us to show that even the simple GroupSim method introduced here exhibits state-of-the art performance. This suggests ample opportunities for further method development and performance improvement, and our framework provides the necessary foundation upon which this progress can be built.
2 METHODS AND DATA
2.1 Dataset
Here we describe the computational pipeline used to build a dataset of over 400 alignments of homologous enzyme domains each consisting of two specificity groups with columns likely important for specificity, as well as specificity groupings, identified. We refer to this dataset as the EC-Pfam dataset. While we only apply our procedure to enzymes here, it can be easily adapted to other protein types in the presence of a reliable classification of functional specificity.
We integrate data from several bioinformatics resources: protein sequences downloaded from SwissProt (Bairoch et al., 2005) on January 23, 2007, 3D structures from the PDB (Berman et al., 2000), domain families from release 21.0 of Pfam (Finn et al., 2006), enzyme function classification from release 23 of the Enzyme (EC) database (Bairoch, 2000) and experimentally determined catalytic sites from release 2.2.1 of the Catalytic Site Atlas (Porter et al., 2003). By defining families and specificity using a combination of Pfam, EC numbers and sequence similarity, we avoid problems inherent in each approach. Pei et al., (2006) attempted a large scale comparative analysis of SDP-prediction methods, in which specificity groups were built by sequence similarity and all positions near ligands were considered positives. This previous approach has two problems. First, specificity does not always follow sequence similarity (Brown et al., 2006; Pazos et al., 2006), and thus specificity groupings cannot reliably be obtained in this manner. Second, most residues near ligands are not important for specificity; in particular, many of these residues are well conserved and so a method that selects conserved residues would not identify any SDPs but would perform very well in their evaluation. We describe subsequently how we address these problems.
2.1.1 Alignment building
We build alignments for families of homologous domains for which we have a reliable way to divide the sequences into groups according to their functional specificity. We start by combining domain data from Pfam and enzyme data from EC. The Enzyme database provides a hierarchical classification of enzymes based on the reactions they catalyze. An enzyme is assigned four numbers each representing a more specific classification. The first three numbers taken together usually identify the type of reaction catalyzed (e.g. 1.1.1.* identifies an oxidoreductase acting on the CH–OH group of donors with NAD(+) or NADP(+) as an acceptor). The fourth number identifies the particular substrate (e.g. 1.1.1.27 acts on L-lactate and 1.1.1.37 acts on malate). These classifications are based mainly on experimental evidence and do not correspond to sequence identity. By combining EC classifications with Pfam sequence motifs and the sequence similarity cutoffs described subsequently, we ensure that our homologous family and subgroup assignments are supported by both experimental and sequence evidence.
For each Pfam domain, we find the EC assignments (if any) for each member sequence. We consider all pairs of EC numbers present in the Pfam family that overlap through the third position, e.g. 1.1.1.27 and 1.1.1.37; these represent enzymes with similar functions that are acting upon different substrates. We then use BLASTCLUST (Altschul et al., 1990) to cluster all sequences found in the EC group pair by pairwise sequence identity; we require 30% sequence identity over at least 85% of the domain sequence to be a member of a cluster. Now, each cluster contains domain sequences from the same domain family with significant sequence identity and EC numbers that overlap through the third position. Sequences in a cluster are assigned to specificity groups according to their fourth-level EC number, which corresponds to their specific substrate. For each specificity group, i.e. set of sequences in a cluster with matching full EC numbers, we remove very similar sequences (those with 95% sequence identity over 85% of both sequences). Any chains from the PDB that contain the domain, EC assignment and relevant bound ligand or an experimentally identified catalytic site (Porter et al., 2003) are included in the specificity group regardless of their sequence similarity to one another. A bound ligand is considered relevant if it is at least 40% similar, as computed by the graph-match algorithm used in PDBSum (Laskowski et al., 2005), to the ligand specified by the EC number. We keep clusters in which both specificity groups contain at least four sequences. As some of the methods tested become very slow on large alignments, we also limit each specificity group to 50 sequences (selecting sequences uniformly at random if necessary). Finally, the cluster sequences are are aligned using ProbCons (Do et al., 2005).
2.1.2 Selection of residues near ligands
In enzymes, SDPs are usually found around the active site near ligands. When evaluating SDP predictions in the absence of experimental data, many researchers have used nearness to relevant ligands as a proxy for importance for specificity (see Hannenhalli and Russell, 2000; Kalinina et al., 2003). We extend and improve this previous small-scale approach by developing an automated procedure that uses structural information and sequence-based criteria to identify positions likely important for specificity.
Each alignment described in the previous section includes chains from the PDB that contain the relevant domain, EC assignment and bound ligand or catalytic site. We select residues near ligands in two ways. For each chain, if a relevant ligand is present, we find all chain residues with an atom within 5Å of a relevant ligand atom and add these to the set of ‘near ligand’ residues. Since many enzymes do not have 3D structures in complex with their substrate, we also use catalytic sites as a proxy for the location of ligands and include all residues within 5Å of a catalytic site. When we refer to the set of residues ‘near ligands’, we also include those found near catalytic sites unless we explicitly state otherwise.
2.1.3 Sequence-based filtering of columns near ligands
The set of residues near ligands and catalytic sites includes many sites that are not important for specificity—for example, sites that are of functional importance to the whole family and thus are conserved across the specificity groups. To remove columns that are unlikely to have an effect on specificity from the set of likely SDPs, we consider three sequence alignment-based filters. Each filter corresponds to a column pattern that has been suggested to indicate importance for specificity.
The low-overlap filter (ℒ) seeks to remove all columns for which there is significant amino acid overlap between the specificity groups. For the two group case, the specificity group with higher Shannon entropy (lower conservation) is selected, and the fraction of sequences in the group whose amino acids appear in the other group is found. If it is greater than 0.1, then the column is removed from the putative SDP set. To better handle improperly annotated and poorly aligned sequences, an amino acid must account for more than 5% of the more conserved group to count as a match. Columns that are conserved across the groups are removed by this filter, as are columns which are not conserved but have similar amino acid distributions within the groups. It can be extended to columns with more than two groups by averaging the overlap for each pair of specificity groups. The one-group-conserved filter (𝒪) imposes an additional constraint. A column passes this filter if it passes the low-overlap filter and at least one of its specificity groups is conserved. Here we define conservation as Shannon entropy less than 2/3 of a bit. Shannon entropy of a column has a range of 0 for complete conservation to ≈log2(20) bits when each amino acid is equally likely. A column passes the all-groups-conserved filter (𝒜) if it passes the low-overlap filter and all of its groups are conserved as defined above. This is the strictest filter. Each filter is a stricter version of the previous (e.g. all columns passing the all-groups-conserved filter also pass the one-group-conserved filter). Table 1 illustrates how the filters treat several example columns.
Table 1.
Alignment column filter behavior on five example columns
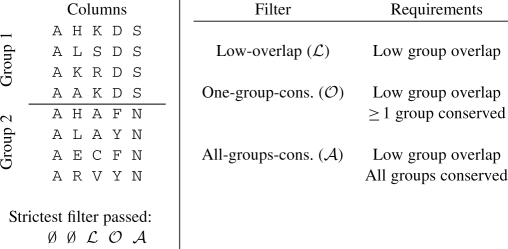 |
The five example columns contain two specificity groups. The empty set symbol, ∅, indicates that the first two columns do not pass any filters. The strictest filters that the third, fourth and fifth columns pass are (respectively) the low-overlap, one-group-conserved and all-groups-conserved filters.
The following analysis requires the distinction of ‘positive’ and ‘negative’ positions. We use each of the filters along with structural evidence to define sets of columns that are likely to be enriched with SDP. The set of positions within 5Å of a relevant ligand passing filter 𝒳 is referred to as SDP𝒳. Each filter leads to a different set, but our results are robust to the filter used (see Supplementary Material). Section 3.1.1 provides evidence that SDP𝒪, corresponding to the one-group-conserved filter, should be used as the positive set. The set of all columns that do not pass any of the filters is used as the negative set.
2.1.4 Dataset statistics
The raw dataset consists of 435 alignments. To avoid biasing the dataset to larger families with many specific functions, we filter it so that each EC–Pfam pairing is included in no more than one alignment; the full dataset is available online. After filtering the 435 alignments, 106 with at least one column in SDP𝒪 remain. Since the observed column patterns depend on the diversity of the alignments, we now provide some summary statistics. These alignments have an average length of 279 positions and contain an average of 41 sequences with a minimum of 11 and a maximum of 100. The average pairwise sequence identities range from 27.2% to 66.2% with a mean of 42.5% and an SD of 8.5%. The average pairwise sequence identities within specificity groups vary from 25.5% to 88.9% with a mean of 55.2% and an SD of 14.2%. The filtered dataset contains 489 putative SDPs.
2.1.5 Experimental support for EC–Pfam dataset
The lactate/malate dehydrogenase family has experimentally determined SDPs and is also found in the EC–Pfam dataset. It thus provides an opportunity to compare our dataset with experimentally determined results. A mutation of one residue from Gln to Arg is known to switch the specificity from lactate to malate (Hannenhalli and Russell, 2000). Two positions in the alignment (Q117R and E123M) are placed in SDP𝒪 by our automated framework, and the known SDP (Q117R) is in this set.
In addition, several statistical properties of our dataset are similar to those of the largest available dataset of experimentally determined SDPs (Chakrabarti et al., 2007). The percent of alignment columns identified as putative SDPs is 1.2 in the EC–Pfam dataset and 1.7 in the experimental dataset. In addition, Section 3.1.1 shows that the same two SDP column patterns are over-represented in both datasets. Though neither set of SDPs (computational or experimental) can be thought of as complete, the similarity of these properties between them lends support to our automated approach for building a dataset of SDPs.
2.2 SDP property definitions
In the following analysis, we use amino acid property definitions from several sources. Secondary structure and solvent accessibility (of all chains, ignoring ligands) are taken from DSSP (Kabasch and Sander, 1983). The eight DSSP states are reduced to helix (H, G, I), sheet (E, B) and loop/other (S, T, C). Amino acid property partitions are adapted from the following sources: charge [(R, H, K), (D, E), (A, N, C, Q, G, I, L, M, F, P, S, T, W, Y, V)] (Valdar, 2002), hydrophobicity [(I, L, V, C, A, M, F), (G, Y, W, H, K, T, R, E, Q, D, N, S, P)] (Kyte and Doolittle, 1982), size [(A, G, C, S), (V, T, N, P, D), (Q, E, H, K, R, F, Y, W, M, I, L)] (Valdar, 2002) and polarity [(H, R, K, E, D), (Q, T, S, N, C, Y, W), (A, G, V, L, I, P, F, M)] (Bartlett et al., 2002).
2.3 Evaluation procedures
SDP prediction methods are compared by analyzing how well they rank the set of positive columns, SDP𝒪. Since different performance measures can yield different relative results, we use both box plots and precision–recall (PR) curves. To create the box plots, for each of the positives, we compute its rank by counting how many of the positive and negative columns score better than it. We find the minimum, maximum, median and quartile ranks of the positive columns for each method in each alignment. We then average each of these statistics over all the alignments and present the results as a box plot. For the PR curves, precision (TP/TP+FP) is plotted on the y-axis, and recall (TP/TP+FN) is plotted on the x-axis. In our PR analysis, a PR curve is constructed for each method on each alignment, and all the PR curves for a method are averaged across all alignments to obtain its overall curve. We use the method and code of Davis and Goadrich (2006) for calculating the area under the curve (AUC). Higher AUC corresponds to better performance. Columns with more than 10% gaps overall or with a specificity group containing more than 30% gaps are not considered.
2.4 SDP prediction methods
We evaluate the performance of a representative set of existing methods for predicting SDPs from a MSA divided into specificity groups against a simple, baseline method. We do not include methods that predict specificity groups as well as SDPs in the evaluation, though such an evaluation would be possible with our dataset.
2.4.1 Existing SDP prediction methods
Information theoretic methods are frequently used to predict SDPs, so we include several such methods in our evaluation. Relative entropy (RE) (Hannenhalli and Russell, 2000) was one of the first fully automated information theoretic approaches suggested. Our implementation calculates the average relative entropy between all pairs of group amino acid distributions in a column.
SDPpred (Kalinina et al., 2003) has been shown to perform well in previous small-scale evaluations. It calculates column scores by measuring the mutual information (MI) between specificity groups and amino acids and comparing it to the MI of columns with shuffled amino acid compositions. We evaluate both SDPpred and the use of MI without shuffling.
Sequence Harmony (SH) (Pirovano et al., 2006) scores columns using a linear combination of entropies that rewards difference between the specificity groups without requiring conservation within each of the groups. We include SH because it was one of the first methods to explicitly focus on group difference. Columns with tie scores are differentiated by their nearness to other high-scoring columns.
The Xdet method (Pazos et al., 2006) is selected to represent a set of non-information theoretic methods with similar motivations. It calculates, for each column, the correlation between the similarity of all observed amino acid pairs and the functional similarity of the proteins they represent. Columns in which proteins with similar amino acids have similar functions receive high scores. We use a zero-one functional similarity matrix with all pairs of proteins in the same specificity group receiving a one. We use the identity matrix as the amino acid similarity matrix, because we found that it works better than other similarity matrices (see Supplementary Material).
For SDPpred, the publicly accessible web server was used to score alignments. Source code for Xdet and SH was obtained from the authors. Default parameters were used for all methods. In our implementations of RE and MI, a pseudocount of one when estimating amino acid distributions was found to yield the best performance.
2.4.2 GroupSim
As a baseline for comparison, we implemented a simple method that considers all pairs of amino acids within and between groups. The average similarity between each pair of amino acids in a group is calculated according to a similarity matrix for each specificity group in the alignment. To reward difference between specificity groups, we compute for each group the average similarity (according to the matrix) of all amino acid pairs containing one amino acid in the group and one not in the group. This per group average is then averaged. The column score is the average within-group similarity minus the average between-group similarity. Higher scores indicate a greater likelihood to be a SDP. We tried a range of similarity matrices from the BLOSUM series (Henikoff and Henikoff, 1992), but as with Xdet, using the identity matrix provided the best results. A simple gap penalty, multiplying the column score by the fraction of non-gap positions in the column, is applied to the scores.
2.4.3 Conservation window heuristic
Positions important for determining specificity are often found near the active/interaction site. The residues in enzyme active sites are known to be more conserved than average (Bartlett et al., 2002). If two columns have the same SDP score (according to any method), we might think that the one in the area of greater conservation is likely to be of greater importance for specificity. In order to test this idea, we developed a heuristic that incorporates the conservation of sequentially adjacent positions into the SDP score:
| (1) |
where SDP(C) is an SDP score for column C, win is a set containing the indices of all columns in a window around, but not including, column C. The second term is the average conservation of the window; we use the Jensen–Shannon divergence (Capra and Singh, 2007) to estimate conservation. We find λ=0.7 and a window size of three residues on either side of C work well. Though the best parameters vary from method to method, the results are robust across choices of λ. When discussing a method to which this heuristic has been applied, we will append ‘+ConsWin’ to the method name.
3 RESULTS
The size of the EC–Pfam dataset allows us to describe properties of positions that are likely important for specificity. In addition, it enables the comparison of SDP prediction methods on a much larger scale than was possible previously.
3.1 Analysis of positions important for specificity
In this section, we characterize a set of residues enriched with SDPs in terms of column amino acid pattern, secondary structure, relative solvent accessibility (RSA), and amino acid property differences observed between specificity groups in the same column. These observations should be useful in future SDP prediction method development.
3.1.1 Two SDP column patterns are over-represented near ligands
Columns that exhibit amino acid conservation within specificity groups and difference between them have often been sought by SDP prediction methods. However, it has recently been argued that a lack of overlap in amino acid distribution between specificity groups is sufficient to indicate that a column is important for determining specificity (Pirovano et al., 2006).
Since there are too few experimentally verified specificity determining positions to perform a reliable analysis of observed column patterns, we instead use our EC–Pfam dataset to address the question. We assume that the set of residues within 5Å of the relevant ligand is enriched with specificity determining residues relative to alignment columns more than 5Å from the ligand. We then count the occurrence of each column pattern described in Table 1 in these two sets of positions. If we see significantly more columns of a given pattern near ligands, we attribute this difference to specificity-based pressures. Before performing this analysis, we removed all very conserved columns (Shannon entropy ≤1/3 bit) from each set, because these columns are not important for determining specificity and are overrepresented near ligands (35.6% ≤5Å from ligand and 11.2% >5Å from ligand).
Table 2 compares the distribution of column patterns in positions near ligands to the distribution over positions not near ligands; each column is assigned to the strictest filter (pattern) it passes and significance is calculated using the hypergeometric distribution. Two column patterns, one-group-conserved and all-groups-conserved, are significantly enriched in columns near ligands (P-values of 5.577e−8 and 8.814e−47, respectively). This likely reflects pressure from specificity-based constraints. In contrast, columns with the low-overlap pattern are significantly (P=0.012) more common outside of regions likely important for specificity (8.8%) than in them (6.6%). This suggests that the low-overlap pattern alone is insufficient to indicate importance for specificity; a method that rewards this column pattern is likely to select columns that are far from relevant ligands. These results are consistent with a recent study of SDP in 13 experimentally characterized families (Chakrabarti et al., 2007) that found Type II (all-groups-conserved) and Type I (one-group-conserved) columns to be overrepresented in SDPs as compared to non-SDPs.
Table 2.
Enrichment of column amino acid patterns near ligands
| Filter | ≤ 5Å from | > 5Å from | P-value |
|---|---|---|---|
| ligand |
ligand |
||
| Low-overlap (ℒ) | 0.066 (106) | 0.088 (1550) | 0.012 |
| One-group-conserved (𝒪) | 0.174 (278) | 0.125 (2196) | 5.577e−8 |
| All-groups-conserved (𝒜) | 0.132 (211) | 0.034 (669) | 8.814e−47 |
Each row gives the fraction of positions ≤ 5Å and >5Å from ligands having the given pattern. The raw count of each pattern is given in parentheses. Conserved positions were removed prior to the enrichment analysis, and each position is counted only for the most specific filter it passes. P-values were calculated from the hypergeometric distribution. Positions passing the one-group-conserved and all-groups-conserved filters are significantly enriched near ligands. Significant enrichment is shown in bold.
Based on this enrichment, we use the SDP𝒪 set—all columns within 5Å of a relevant ligand passing at least the one-conserved-filter—as positives in the following analysis and method evaluation and refer to positions in this set as ‘putative SDPs’.
3.1.2 The amino acid distribution of putative SDPs is more polar than the background
Catalytic sites are known to have an amino acid distribution with more charged residues than the background distribution (Bartlett et al., 2002). The amino acid distribution of putative SDPs is also quite different from the background distribution observed in the alignments (χ2-test P-value=4e−4 using the distribution over all positions as the expected distribution). Table 3 gives these distributions relative to a partition of the amino acids into charged (H, R, K, E, D), non-charged polar (Q, T, S, N, C, Y, W) and all others.
Table 3.
Comparison of amino acid distributions
| Charged AA | Non-charged Polar AA | Other AA | |
|---|---|---|---|
| All positions | 0.24 | 0.24 | 0.52 |
| Catalytic sites | 0.66 | 0.25 | 0.09 |
| Putative SDPs | 0.24 | 0.31 | 0.45 |
Putative SDPs are more likely to be a non-charged polar residues than a residue chosen at random. Catalytic sites do not exhibit this bias; instead they are more charged.
In contrast to catalytic sites, the percentage of charged residues in putative SDPs is similar to the background. However, putative SDPs exhibit more non-charged polar residues than either catalytic sites or the background. This suggests that the sites that determine specificity are rarely involved in catalytic processes such as proton exchange, and are more likely to take part in the weak non-covalent bonds that often mediate the interactions between enzymes and small molecules.
3.1.3 Putative SDPs are most likely to be found in loop regions
Table 4 shows that the secondary structure distribution of columns likely important for specificity in the EC–Pfam dataset is also quite different from the background distribution observed in the alignments. Putative SDPs are significantly more likely to be found in loops, i.e., not in α-helices or β-sheets, than would be expected by chance (χ2-test P-value=3.44e−12 using the distribution over all positions as the expected distribution). Catalytic sites have a similar distribution. This suggests that considering secondary structure predictions could help identify SDPs, but unlike amino acid distribution, might not help distinguish between SDPs and catalytic sites.
Table 4.
Comparison of secondary structure distributions
| α-helix | β-sheet | Loop | |
|---|---|---|---|
| All positions | 0.41 | 0.22 | 0.37 |
| Catalytic sites | 0.28 | 0.22 | 0.50 |
| Putative SDPs | 0.27 | 0.21 | 0.52 |
Putative SDPs are much more likely to be in loop regions than would be expected by chance. Catalytic sites show a similar secondary structure bias.
3.1.4 The relative solvent accessibility profile of putative SDPs is different from that of all residues
The distribution of observed relative solvent accessibilities is markedly different between putative SDPs and all residues in the dataset; see Supplementary Material for a histogram. Compared to all residues, SDPs are less likely to be extremely buried (30% in the 0–5% RSA range compared to 36% for all positions) or extremely exposed (only 12% at RSA ≥ 40% compared to 23% for all). However, the percentage of SDPs with 5–40% RSA is significantly greater for putative SDP than for all columns. The majority of putative SDPs have relatively low solvent exposure. A similar pattern was observed for catalytic sites (Bartlett et al., 2002), and similar forces may explain this somewhat counter-intuitive result. SDPs often require precise positioning and are likely found in large clefts on the protein that are important for binding substrates.
3.1.5 Some amino acid physiochemical properties are less conserved between specificity groups in putative SDPs than expected
Since SDPs distinguish between possible ligands, they often exhibit conservation of certain amino acid properties within specificity groups and difference—relative to those properties—between them. To identify what properties may be used to distinguish ligands, we analyzed the amino acid changes observed between specificity groups in putative SDPs.
Each row in Table 5 represents a partition of the amino acids that corresponds to a property that nature could use to distinguish between ligands. If the property is relevant, we would expect to see amino acid differences that are not conservative, relative to the property partition, between groups in putative SDPs. For each partition, the fraction of all amino acid pairs across specificity groups in putative SDPs that do not conserve the property is reported. The ‘All Positions’ column gives the percentage of non-conservative pairs relative to each property partition over all alignment positions and serves as the background reference point for each partition and the significance calculation.
Table 5.
Average fraction of non-conservative (relative to each partition) amino acid differences between specificity groups by position type
| Amino acid partition | Different between groups |
|
|---|---|---|
| Putative SDPs | All positions | |
| Polarity | 0.656 | 0.418 |
| Size | 0.642 | 0.450 |
| Hydrophobicity | 0.376 | 0.279 |
| Charge | 0.369 | 0.274 |
Each row gives the fraction of all amino acid pairs between specificity groups that differ under the given amino acid property partition. All properties are significantly less conserved between specificity groups in putative SDPs than over all positions.
Polarity, size, hydrophobicity and charge are all significantly less conserved between groups in putative SDPs than in the background. The binomial P-values for the observed differences are infinitesimal. The difference is largest for polarity and size. This suggests that these residue properties are commonly used to establish different specificity in similar proteins.
3.2 SDP prediction method evaluation
In this section, we evaluate a representative set of recent methods—relative entropy (RE), mutual information (MI), SDPpred, Sequence Harmony (SH) and Xdet—against our simple method, GroupSim.
3.2.1 GroupSim performs competitively with existing methods
The performance of each method is judged via two complementary techniques. Figure 1 gives box plots for each method and Figure 2 shows their PR curves. In general, PR analysis rewards accuracy in the first few predictions whereas the average rank analysis rewards performance equally across all positives. All results reported here are over SDP𝒪, but our main conclusions are not sensitive to the filters used to select the positives. See the Supplementary Material for results on SDPℒ and SDP𝒜.
Fig. 1.

Box plots for the SDP prediction methods on the putative SDPs in the EC–Pfam dataset ordered by average minimum. Each box shows the average over all alignments of the five-number summary (the minimum, lower quartile, median, upper quartile and maximum) for a method. Lower averages indicate better performance. The simple GroupSim outperforms the previous methods in this evaluation, and GroupSim+ConsWin improves on it.
Fig. 2.

PR curves for representative SDP prediction methods on the putative SDPs from the EC–Pfam dataset. The simple GroupSim is competitive with the other methods; SDPpred is the only method that substantially outperforms it. GroupSim+ConsWin outperforms all methods. All methods improve when the conservation window heuristic is applied (see Supplementary Material).
The box plots shown in Figure 1 demonstrate that when considering the ranks of SDPs, GroupSim has lower average minimum, median, quartiles and maximum than existing methods. For example, the average rank over all alignments of the first positive found is 3.8 for GroupSim and 9.7 for SH. Similarly, the low average maximum of GroupSim implies that, compared to other methods, it gives fewer positives very poor scores. In PR analysis (Fig. 2), GroupSim's AUC (0.368) is competitive with MI (0.377) and RE (0.369), and markedly better than Xdet (0.328) and SH (0.243). Only SDPpred has a much greater AUC (0.400).
The results in these two evaluations suggest that none of GroupSim, RE, MI and SDPpred clearly performs best in predicting SDPs in all contexts, but that these four methods perform better than Xdet and SH. GroupSim gives the best performance in the average rank analysis while SDPpred achieves the highest PR-AUC. Since the PR-AUC focuses on accuracy on the first few positives, this indicates that if a few SDPs are sought SDPpred might be better, while if all are sought, GroupSim could be better.
3.2.2 The conservation window heuristic significantly improves method performance
Figures 1 and 2 include the GroupSim+ConsWin method, which is our basic GroupSim method along with a heuristic that incorporates the conservation of neighboring amino acids. This heuristic provides significant improvement over GroupSim (P-value 4.2e−7 using Friedman test on PR-AUC) and outperforms all other methods in terms of AUC (0.428) and average ranks. When applied to each of the existing methods, ConsWin provides improved performance in all cases. SDPpred, RE and MI with ConsWin become competitive with GroupSim+ConsWin, but not better. See the Supplementary Material for the results of applying ConsWin to all methods.
ConsWin works well on our enzyme dataset, because residues in enzyme active sites are significantly more conserved than the background. Thus, the assumption that SDPs are near ligands may boost the performance of ConsWin on our enzyme dataset; however, this assumption is supported in the literature, and is commonly made in small-scale SDP studies. Overall, we believe that the heuristic will be useful in a variety of contexts, but that the conservation signal may not be as strong for all types of interaction. We find that ConsWin improves predictions of GroupSim on five out of eight non-enzyme families in the experimentally determined dataset of Chakrabarti et al., (2007), and 10 out of 13 families overall. See the Supplementary Material for these results and more discussion.
3.2.3 Our dataset provides a platform for better understanding prediction methods
We now give three examples of how our dataset can be used to analyze performance tradeoffs between aspects of SDP prediction methods. First, our evaluation reveals that SDPpred performs better than MI in the PR evaluation; this is interesting, as the only difference between the two is the column shuffling significance procedure applied by SDPpred to adjust the MI score. We find that shuffling provides similar PR-AUC improvement for RE and GroupSim, but does not improve the average ranks (see Supplementary Material for data supporting this result and others discussed in this paragraph). Second, it is surprising how sensitive MI and RE are to the magnitude of the pseudocount used; for example, a pseudocount of 1e−6 results in a PR-AUC of 0.259 for MI compared to 0.377 obtained using 1. Third, we observe that GroupSim's performance is stable with respect to subgroup sequence diversity; it performs slightly better than SDPpred on alignments with very diverse subgroups (data not shown). These observations illustrate the utility of our dataset in designing SDP prediction methods.
4 DISCUSSION AND CONCLUSION
The lack of experimentally identified SDPs with supporting MSAs has impaired the development and evaluation of computational methods for predicting SDPs. We address this problem by automating an approach that researchers often carry out by hand to identify putative SDPs in the absence of mutation studies. The generated dataset contains several hundred alignments of enzymes with putative SDPs identified, and has enabled us to characterize properties of SDPs and evaluate the performance of MSA-based SDP prediction methods. Our main findings on this dataset hold as well on the diverse set of 13 families with experimentally determined SDPs of (Chakrabarti et al., 2007). Our large dataset allows us to better compare methods, and the consistency of our results on the smaller dataset lends support to our methodology.
In our analysis, we find that putative SDPs are quite different from average protein residues in terms of amino acid distribution, secondary structure and solvent accessibility. Our data suggest that SDPs are often found in environments similar to catalytic sites, but that SDPs' amino acid distributions contain many fewer charged residues and more non-charged polar residues. This suggests that, in enzymes, SDPs are more likely to be involved in the recognition and binding of the substrate than in the catalytic mechanism. We also find evidence that amino acid polarity, hydrophobicity, size and charge are used to distinguish between similar ligands.
Analysis of our dataset suggests that columns in which at least one specificity group is conserved and different from the others are significantly overrepresented in regions likely to contain SDPs. This does not imply that columns with other amino acid patterns are never important for specificity, but merely that such patterns more often occur in regions that are unlikely to directly influence interactions with the ligand.
The comprehensive dataset and evaluation presented here provide a foundation upon which further progress in predicting SDPs can be built. Improved identification of SDPs will aid protein engineering, pathway analysis and function prediction. The recent work of George et al., (2005) using known catalytic sites to transfer annotations could likely be extended to include SDPs to attain even more specific function predictions. However, the observation that most current SDP prediction methods perform similarly to a simple method, GroupSim, suggests that there is much room for improvement. This improvement may come from integrating knowledge about properties of SDPs into the development of sequence-based methods; for example, here we show that by exploiting the conservation signal from neighboring amino acids, GroupSim+ConsWin outperforms all earlier methods tested on our dataset of enzyme SDPs. The new SPEER method (Chakrabarti et al., 2007) provides another step in this direction, and the recent work by Fischer et al., (2008) on predicting functional residues may provide a framework for integration. Ultimately, improved understanding of the properties and mechanisms of SDPs, via experimental work as well as large-scale analysis and evaluation like we present here, should lead to improved SDP prediction.
Supplementary Material
ACKNOWLEDGEMENTS
The authors would like to thank members of the Singh group for helpful discussions.
Funding: J.A.C. has been supported by the Quantitative and Computational Biology Program NIH grant T32 HG003284. M.S. thanks the NSF for grants IIS-0612231 and PECASE MCB-0093399, and the NIH for grant GM076275. This research has also been supported by the NIH Center of Excellence grant P50 GM071508 and NIH grant CA041086.
Conflict of Interest: none declared.
REFERENCES
- Altschul S, et al. Basic local alignment search tool. J. Mol. Biol. 1990;215:403–410. doi: 10.1016/S0022-2836(05)80360-2. [DOI] [PubMed] [Google Scholar]
- Bairoch A. The enyzme database in 2000. Nucleic Acids Res. 2000;28:304–305. doi: 10.1093/nar/28.1.304. [DOI] [PMC free article] [PubMed] [Google Scholar]
- Bairoch A, et al. The universal protein resource (UniProt) Nucleic Acids Res. 2005;33:D154–D159. doi: 10.1093/nar/gki070. [DOI] [PMC free article] [PubMed] [Google Scholar]
- Bartlett G, et al. Analysis of catalytic residues in enzyme active sites. J. Mol. Biol. 2002;324:105–121. doi: 10.1016/s0022-2836(02)01036-7. [DOI] [PubMed] [Google Scholar]
- Berman H, et al. The Protein Data Bank. Nucleic Acids Res. 2000;28:235–242. doi: 10.1093/nar/28.1.235. [DOI] [PMC free article] [PubMed] [Google Scholar]
- Brown D, et al. Automated protein subfamily identification and classification. PLoS Comput. Biol. 2007;3:e160. doi: 10.1371/journal.pcbi.0030160. [DOI] [PMC free article] [PubMed] [Google Scholar]
- Brown S, et al. A gold standard set of mechanistically diverse enzyme superfamilies. Genome Biol. 2006;7:R8. doi: 10.1186/gb-2006-7-1-r8. [DOI] [PMC free article] [PubMed] [Google Scholar]
- Capra J, Singh M. Predicting functionally important residues from sequence conservation. Bioinformatics. 2007;23:1875–1882. doi: 10.1093/bioinformatics/btm270. [DOI] [PubMed] [Google Scholar]
- Casari G, et al. A method to predict functional residues in proteins. Nat. Stuct. Biol. 1995;2:171–178. doi: 10.1038/nsb0295-171. [DOI] [PubMed] [Google Scholar]
- Chakrabarti S, et al. Functional specificity lies within the properties and evolutionary changes of amino acids. J. Mol. Biol. 2007;373:801–810. doi: 10.1016/j.jmb.2007.08.036. [DOI] [PMC free article] [PubMed] [Google Scholar]
- Davis J, Goadrich M. The relationship between precision-recall and ROC curves. Proceedings of 23rd International Conference on Machine Learning. 2006;23:233–240. [Google Scholar]
- del Sol Mesa A, et al. Automatic methods for predicting functionally important residues. J. Mol. Biol. 2003;326:1289–1302. doi: 10.1016/s0022-2836(02)01451-1. [DOI] [PubMed] [Google Scholar]
- Do C, et al. Probabilistic consistency-based multiple sequence alignment. Genome Res. 2005;15:330–340. doi: 10.1101/gr.2821705. [DOI] [PMC free article] [PubMed] [Google Scholar]
- Donald J, Shakhnovich E. Determining functional specificity from protein sequences. Bioinformatics. 2005;21:2629–2635. doi: 10.1093/bioinformatics/bti396. [DOI] [PubMed] [Google Scholar]
- Finn R, et al. Pfam: clans, web tools, and services. Nucleic Acids Res. 2006;34:D247–D251. doi: 10.1093/nar/gkj149. [DOI] [PMC free article] [PubMed] [Google Scholar]
- Fischer J, et al. Prediction of protein functional residues from sequence by probability density estimation. Bioinformatics. 2008;24:613–620. doi: 10.1093/bioinformatics/btm626. [DOI] [PubMed] [Google Scholar]
- George R, et al. Effective function annotation through catalytic residue conservation. Proc. Natl Acad. Sci. USA. 2005;102:12299–12304. doi: 10.1073/pnas.0504833102. [DOI] [PMC free article] [PubMed] [Google Scholar]
- Hannenhalli S, Russell R. Analysis and prediction of functional sub-types from protein sequence alignments. J. Mol. Biol. 2000;303:61–76. doi: 10.1006/jmbi.2000.4036. [DOI] [PubMed] [Google Scholar]
- Henikoff S, Henikoff J. Amino acid substitution matrices from protein blocks. Proc. Natl Acad. Sci. USA. 1992;89:10915–10919. doi: 10.1073/pnas.89.22.10915. [DOI] [PMC free article] [PubMed] [Google Scholar]
- Kabasch W, Sander C. Dictionary of protein secondary structure: pattern recognition of hydrogen-bonded and geometrical features. Biopolymers. 1983;22:2577–2637. doi: 10.1002/bip.360221211. [DOI] [PubMed] [Google Scholar]
- Kalinina O, et al. Automated selection of positions determining functional specificity of proteins by comparative analysis of orthologous gropus in protein families. Prot. Sci. 2003;13:443–456. doi: 10.1110/ps.03191704. [DOI] [PMC free article] [PubMed] [Google Scholar]
- Kristensen D, et al. Prediction of enzyme function based on 3D templates of evolutionarily important amino acids. BMC Bioinformatics. 2008;9:17. doi: 10.1186/1471-2105-9-17. [DOI] [PMC free article] [PubMed] [Google Scholar]
- Kyte J, Doolittle R. A simple method for displaying the hydropathic character of a protein. J. Mol. Biol. 1982;157:105–132. doi: 10.1016/0022-2836(82)90515-0. [DOI] [PubMed] [Google Scholar]
- Laskowski R, et al. PDBsum more: new summaries and analyses of the known 3D structures of proteins and nucleic acids. Nucleic Acids Res. 2005;33:D266–D268. doi: 10.1093/nar/gki001. [DOI] [PMC free article] [PubMed] [Google Scholar]
- Lichtarge O, et al. An evolutionary trace method defines binding surfaces common to protein families. J. Mol. Biol. 1996;257:342–358. doi: 10.1006/jmbi.1996.0167. [DOI] [PubMed] [Google Scholar]
- Livingstone C, Barton G. Protein sequence alignments: a strategy for the hierarchical analysis of residue conservation. Comput. Appl. Biosci. 1993;9:745–756. doi: 10.1093/bioinformatics/9.6.745. [DOI] [PubMed] [Google Scholar]
- Manning J, et al. The contrasting properties of conservation and correlated phylogeny in protein functional residue prediction. BMC Bioinformatics. 2008;9:51. doi: 10.1186/1471-2105-9-51. [DOI] [PMC free article] [PubMed] [Google Scholar]
- Marttinen P, et al. Bayesian search of functionally divergent protein subgroups and their function specific residues. Bioinformatics. 2006;22:2466–2474. doi: 10.1093/bioinformatics/btl411. [DOI] [PubMed] [Google Scholar]
- Mayer K, et al. Linking enzyme sequence to function using conserved property difference locator to identify and annotate positions likely to control specific functionality. BMC Bioinformatics. 2005;6:284. doi: 10.1186/1471-2105-6-284. [DOI] [PMC free article] [PubMed] [Google Scholar]
- Mihalek I, et al. A family of evolution-entropy methods for ranking protein residues by importance. J. Mol. Biol. 2004;336:1265–1282. doi: 10.1016/j.jmb.2003.12.078. [DOI] [PubMed] [Google Scholar]
- Mirny L, Gelfand M. Using orthologous and paralogous proteins to identify specificity-determining residues in bacterial transcription factors. J. Mol. Biol. 2002;321:7–20. doi: 10.1016/s0022-2836(02)00587-9. [DOI] [PubMed] [Google Scholar]
- Pazos F, et al. Phylogeny-independent detection of functional residues. Bioinformatics. 2006;22:1440–1448. doi: 10.1093/bioinformatics/btl104. [DOI] [PubMed] [Google Scholar]
- Pei J, et al. Prediction of functional specificity determinants from protein sequences using log-likelihood ratios. Bioinformatics. 2006;22:164–171. doi: 10.1093/bioinformatics/bti766. [DOI] [PubMed] [Google Scholar]
- Pirovano W, et al. Sequence comparison by sequence harmony identifies subtype-specific functional sites. Nucleic Acids Res. 2006;34:6540–6548. doi: 10.1093/nar/gkl901. [DOI] [PMC free article] [PubMed] [Google Scholar]
- Porter C, et al. The Catalytic Site Atlas: a resource of catalytic sites and residues identified in enzymes using structural data. Nucleic Acids Res. 2003;32:D129–D133. doi: 10.1093/nar/gkh028. [DOI] [PMC free article] [PubMed] [Google Scholar]
- Reva B, et al. Determinants of protein function revealed by combinatorial entropy optimization. Genome Biol. 2007;8:R232. doi: 10.1186/gb-2007-8-11-r232. [DOI] [PMC free article] [PubMed] [Google Scholar]
- Valdar W. Scoring residue conservation. Proteins. 2002;48:227–241. doi: 10.1002/prot.10146. [DOI] [PubMed] [Google Scholar]
- Wallace I, Higgins D. Supervised multivariate analysis of sequence groups to identify specificity determining residues. BMC Bioinformatics. 2007;8:135. doi: 10.1186/1471-2105-8-135. [DOI] [PMC free article] [PubMed] [Google Scholar]
- Ye K, et al. A two-entropies analysis to identify functional positions in the transmembrane region of class A G protein-couples receptors. Prot. Struct. Funct. Bioinfo. 2006;63:1018–1030. doi: 10.1002/prot.20899. [DOI] [PubMed] [Google Scholar]
- Yu G, et al. In silico discovery of enzyme-substrate specificity-determining residue clusters. J. Mol. Biol. 2005;352:1105–1117. doi: 10.1016/j.jmb.2005.08.008. [DOI] [PubMed] [Google Scholar]
Associated Data
This section collects any data citations, data availability statements, or supplementary materials included in this article.