Abstract
We have successfully imaged the retinal tumor in a mouse model using an ultra-high resolution spectral-domain optical coherence tomography (SD-OCT) designed for small animal retinal imaging. For segmentation of the tumor boundaries and calculation of the tumor volume, we developed a novel segmentation algorithm. The algorithm is based on parametric deformable models (active contours) and is driven by machine learning-based region classification, namely a Conditional Random Field. With this algorithm we are able to obtain the tumor boundaries automatically, while the user can specify additional constraints (points on the boundary) to correct the segmentation result, if needed. The system and algorithm were successfully applied to studies on retinal tumor progression and monitoring treatment effects quantitatively in a mouse model of retinoblastoma.
1. Introduction
Retinoblastoma is the most common ocular malignancy in children, which occurs approximately in one of every 15,000 birth. [1,2] It is a cancer that affects the light-sensitive retinal cells that enables sight. Although significant advances have been achieved in the screening and treatment of the primary cancer, serious concerns still exist regarding the significant morbidity and potential mortality associated with current therapies, therefore new therapeutic modalities are investigated. Mouse model of retinoblastoma serves as an important platform for the investigation of the progression of the disease and tests of new therapies.
In vivo noninvasive imaging and quantitative assessment of the tumor volume at different stages of the disease is essential in monitoring its progression and response to treatments. However, histology is at present the standard method for quantitative examination of the retina of small animal models. As a result, not only a large number of animals must be used but also each animal contributes to just a single data point for a study. As a novel noninvasive imaging modality, optical coherence tomography (OCT) [3–11] offers an opportunity to significantly reduce the number of animals in studies of ophthalmic diseases by monitoring of the disease progression through its entire course in individual animals. It will also help provide a better understanding of the pathophysiology of the diseases.
There are several challenges in the quantitative imaging of retinal tumor in mouse model. First, the small size of the mouse eye makes the alignment for light delivery into the eye formidable. Second, in longitudinal studies the same area of the retina needs to be imaged repeatedly over time and the lesions (areas of interest) need to be searched at the beginning of a study cycle. For example, there may be multiple tumors in the retina of a LHβTag mouse (a model of retinoblastoma), usually originating at the edge of the retina, and frequently a single raster OCT scan can not capture all of them. To capture the tumors the eye must be tilted at a large angle so that the incident sample light can reach the edge of the retina, and the entire retina needs to be screened with multiple partially overlapped raster scans. Third, an anesthetized rodent can easily develop cataract due to dehydration of the cornea, [12,13] which seriously limits the time window for retinal imaging. Fourth, segmentation of the tumor boundary is more challenging than segmenting the ILM (inner limiting membrane) and RPE (retinal pigment epithelium) because of the lower contrast of the tumor image.
In this paper, we describe our work on the imaging and segmentation of retinal tumor in longitudinal studies of retinoblastoma in mouse model with high resolution SD-OCT.
2. Materials and methods
2.1 OCT system
A single mode optical fiber based SD-OCT system was built for small animal retinal imaging. A three-module superluminescent diode (SLD) (Broadlighter, T840-HP, Superlumdiodes Ltd, Moscow, Russia) with a center wavelength of 840 nm and a FWHM (full width at half maximum) bandwidth of 100 nm was used as the low coherence light source. The low coherence light was coupled into a fiber based Michelson interferometer that consist of a 2×2 3dB fiber coupler, which split the light into the reference and sample arms. The sample arm consists of a delivery system designed for small animal imaging, which consisted of a X-Y galvanometer optical scanner and the optics for delivering the sample light into the rodent retina and collecting the backreflected sample light. A double-aspheric 90D Volk lens (Volk Optics Inc., OH) was used as the objective lens. The power of the sample light was lowered to 750µW by adjusting the source power with a fiber-based attenuator to ensure that the light intensity delivered to the eye was safe to the retina. In the detection arm, a spectrometer consisting of a collimating lens (f = 50 mm), a 1200 line/mm transmission grating, an achromatic imaging lens (f = 180 mm), and a line scan CCD camera (Aviiva-M2-CL-2014, 2048 pixels with 14 micron pixel size operating in 12-bit mode) was used to detect the combined reference and sample light. The calculated spectral resolution was 0.055 nm, which corresponds to a detectable depth range of 3.1 mm in air. An image acquisition board acquired the image captured by the CCD camera and transferred it to a computer workstation (IBM IntelliStation Z Pro, dual 3.6 GHz processor, 3 GB memory) for signal processing and image display. A complete raster scan consisting of 65536 scanning steps took about 2.7 seconds when the A-line (depth scan) rate of the OCT system was set to be 24 kHz. At this operating condition, the measured sensitivity was about 95dB. The calibrated axial resolution of the system was ~3.8µm in the air corresponding to ~3µm in the tissue. To calculate the scanning range of the OCT image we assumed the dioptric power of the mouse lens at wavelength of 840 nm to be 550D. This value was obtained by extrapolation from the published data of Remtulla et al. [14] The scan range was set to 6°, which allowed to image an estimated area of 1 × 1 mm2 on the mouse fundus.
2.2 Animal positioning system
To meet the challenges for retinal tumor imaging in a mouse model, an multiple axis animal positioning and aligning system that can help locate the tumor quickly is the key. In a conventional animal positioning system, the axes for the rotations of the subject may not intersect and coincide with the pupil of the animal eye. As a result, a generic rotation of the animal may correspond to a change of the eye position in all directions and make the OCT image of the retina easily out of the field of view. It makes the alignment process even more formidable and time consuming when the area of interest is far away from the optic disc, which is at the center of the retina in rodents, as in the case of imaging the mouse model of retinoblastoma. We have developed an animal positioning system using the concept of gimbal in which the two orthogonal rotation axes intersect at the pupil of the animal eye. The system features five degrees of freedom: two rotational and three translational. The intersection of the two rotational axes is fixed in the space. By adjusting the animal using the three translational movements, the position of the pupil can be set at the intersection of the rotational axes. A removable animal restraint tube was built, which allows easy insertion of the animal into the positioning system.
The so designed animal aligning system made possible continuous OCT image monitoring during rotation of the subject. It allows the operator to search the retina by rotating the subject and using the real-time OCT images as guidance. It allows the operator to rapidly locate the area of interest (retinal tumor in the current study) at each imaging session. It also makes possible high throughput OCT animal imaging. For example, the aligning system allowed imaging a mouse retina within 2 minutes.
2.3 Animal model of retinoblastoma
LHβTag mouse models of retinoblastoma [15] between weeks 10 and 13 were used for the experiments. In this model, tumor appears at 4 weeks of age and fills the available orbit volume by 16 weeks of age. Two groups of LHβTag mice were imaged. One group served as control. The other group (test group) was treated with SU1498,16 which is a drug that inhibits the vascular endothelial growth factor receptor (VEGFR). The test group was treated with 6 periocular injections (given in a 10 µl volume twice weekly for 3 weeks) of SU1498 (50 mg/Kg, LC labs). The dose of SU1498 (50 mg/Kg) was based on previous studies. [16,17] The two groups were imaged once a week during the course of the experiment, and their tumor were followed.
Animals were anesthetized before the experiments with a cocktail of Ketamine (80 mg/kg body weight) and Xylazine (10 mg/kg body weight) administered intramuscularly. In the meantime, the pupils were dilated with 10% Phenylephrine solution. Drops of balanced saline solution were applied to the eyes around every 2 minutes to avoid dehydration of the cornea.
Three OCT images at the upper, middle and bottom of the scanned area were displayed simultaneously in the real-time display for assisting the alignment. By monitoring the real-time OCT images and adjusting the gimbal animal positioning system, the scanning area can be adjusted to cover the area of interest. In longitudinal studies, the scanning area was verified by comparing the OCT fundus images generated from the measured raw OCT data [18] taken at different time points. At the end of the study, the animals were humanely sacrificed with CO2 fumes and both eyes were enucleated and immediately immersion-fixed in 10% formalin. Eyes were embedded in paraffin, sectioned serially in 5µm sections, and processed for standard hematoxylin-eosin (H&E) analysis. Microscopic images of sections were obtained with a digital camera at a magnification of 400×.
2.4 Retinal tumor segmentation
To calculate the tumor volume segmentation of the tumor boundary is the first step. Although there is a lack of clear edges that can be used to determine the boundaries of different regions in the OCT images (in our case tumor vs. normal retinal tissue), texture is a feature that can be used for the discrimination. However, the texture difference between tumor and its surrounding regions, also called background, cannot be easily captured.
We adapted a previously developed approach [19–22] to the specific segmentation problem. The approach uses a geometric deformable model driven by a collaborative Conditional Random Field (CoCRF), [23] in a simple graphical probabilistic scheme. The tumor segmentation problem is solved as a topology independent maximum a posteriori probability (MAP) problem. [20] The main advantage of our approach is that it can capture local texture variations, since it updates the tumor statistics (intensity distribution) during the model evolution—in each iteration of the MAP estimation procedure, the newly detected tumor pixels/regions contribute with new information about the tumor texture. Our recent work [19–22] has shown that this approach can provide the desired robustness and accuracy for the segmentation of different type of images, including medical images of different modalities (e.g., Ultrasound, MR, OCT etc.). We also integrated in the method a user interaction option. Thus we can correct the estimated boundaries in cases where there is increased ambiguity in the intensity information. In the following paragraph we briefly describe some key-features of the segmentation method.
The deformable model shape
Many deformable model-based methods have been used in image segmentation. They use parametric curves (for 2D data) or surfaces (for 3D data) to represent the model shape in 2D or 3D, respectively. They start from an initial estimate for the boundary of the region of interest and use image-driven (external) forces/energies to move towards the desired boundaries, while internal (smoothness) forces/energies preserve the models’ smoothness along the arc-length. During the evolution, their deformations are determined by geometry, kinematics, dynamics, as well as other constraints (if available), such as material properties. Here, we use a special case of deformable modes, namely a snake, [24] which is parametric contour C defined by,
| (1) |
where s is the parametric domain; x and y are the Cartesian coordinate (on the image plane) functions. During the evolution, the function that describes and controls the contour geometric properties, namely its smoothness in terms of the elasticity (C1 smoothness) and rigidity (C2 smoothness), is defined as,
| (2) |
The minimization of this energy term forces the curve to a smoother form during the evolution, while data driven energy terms force the curve towards the desired boundaries. Here, instead of using the traditional edge-based energy term, we use region-based criteria, namely the intensity distribution, as described below.
The model dynamics
We formulate the deformable model evolution as a joint MAP estimation problem for the model position and the image label field, in a similar way as in [19–22]:
| (3) |
where L is the pixel label, i.e., L = {−1,1}; −1 and 1 denote background and tumor respectively; M is the examined image. For the posterior probability P(C, L | M) we adopt the decomposition used in [19–22],
| (4) |
where P(C) = (1/zint)exp{−Eint (C)} is the model prior defined in terms of the internal energy defined above (zint is a normalization constant), is a likelihood term that introduces uncertainty between the classification and the deformable model position, and depends on the distance dist(x,C) of each image pixel x from the evolving curve C. The image prior P(M) is calculated using nonparametric intensity distribution of the model interior in every instance of the evolution process. Finally, P(L | M) represents the pixel learning-based classification, and to estimate this probability field we use Collaborative Conditional Random Field (CoCRF) described in. [22,23]
The algorithm in steps
The overall algorithm for the model evolution consists of the following steps:
Model initialization and learning of the tumor texture using the model interior: discriminative estimation of P(L | M), assuming conditional independence between the pixels.
Estimation of the probability P(L | M) using the Collaborative CRF 22,23 update the probability field calculated in (1), capturing local pixel dependencies, and to assist the weak classification of ambiguous pixels/regions.
Evolution of the model within a band around it, based on eq. (3) and eq. (4); we solve the optimization problem with the Expectation-Maximization algorithm.
For the new position of the model, update the model interior (tumor) statistics and repeat the steps (2)–(4).
Visualize the segmentation results and correct the boundaries if needed.
We adopt a parametric deformable model for computational efficiency, and we use our novel Collaborative formulation of the CRF (CoCRF), [22,23] with the main goal to tackle the region contrast ambiguities. The key-feature of CoCRF is to assist the classification of weakly classified image pixels and regions (due to intensity ambiguities), using the confidently (strongly) classified neighboring regions in the spatial domain.
The segmentation is done on each OCT cross sectional image first by selecting a rectangular region containing the tumor. The algorithm then gives the segmentation result with lines delineating the tumor boundaries. Manual adjustment is allowed when the segmentation is not satisfactory.
3. Results and discussion
3.1 Imaging normal mouse retina
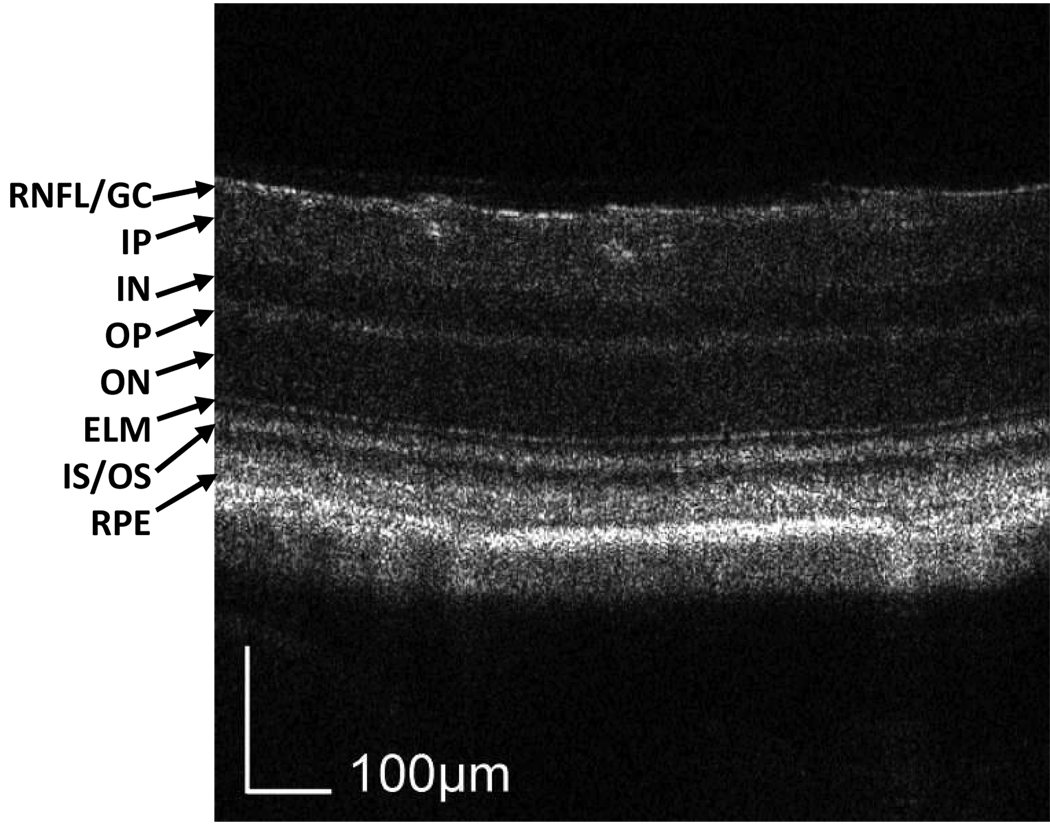
We first tested the OCT system by imaging a Balb/c mouse with normal retina. The result is shown in Fig. 1. The image consists of 512 axial scans. The displayed depth is 0.56 mm after corrected with the refractive index of the retina. The 3D data were acquired using a raster scan pattern where the fast scan is in the X direction, the slow scan is in the Z direction, and the depth is displayed in the Y direction. The displayed cross-section is located distal to the optic disc. The image is displayed in grayscale where darker reading corresponds to lower backscattering and higher reading to higher backscattering. The quality of the OCT image is high enough to recognize all the intraretinal layers, which are labeled in the figure.
Fig. 1.
Cross-sectional (X-Y view) OCT image of a normal Balb/c mouse retina. The spatial location of the image is distal to the optic disc. All the intraretinal layers can be recognized and labeled in the image. The 3D data (View 1) consist of 512 (X) × 500 (Y) × 128 (Z) pixels, covering a volume of 1 × 0.56 × 1 mm3. RNFL/GC: retinal nerve fiber layer/ganglion cell layer; IP: inner plexiform layer; IN: inner nuclear layer; OP: outer plexiform layer; ON: outer nuclear layer; ELM: external limiting membrane; RPE: retinal pigment epithelium.
3.2 Imaging retinal tumor
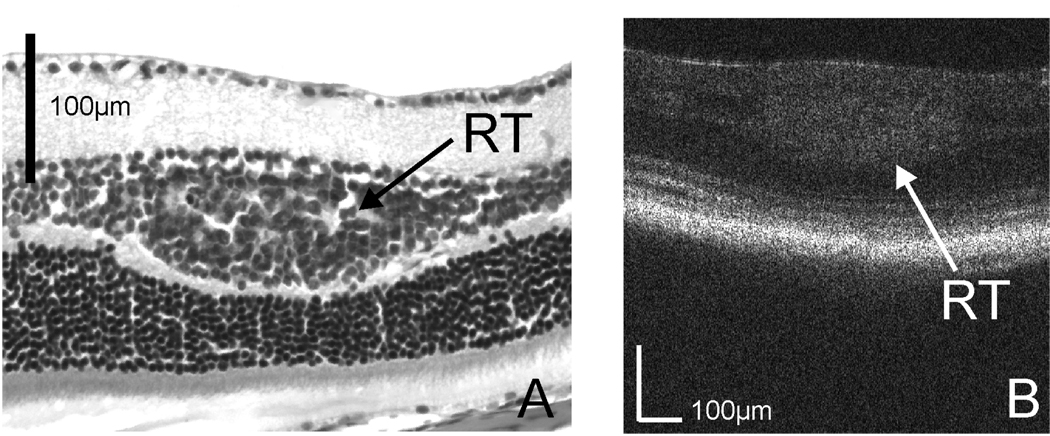
To assess the capability of the OCT system in imaging retinal tumor, we first tested the system on a 10 week-old LHβTag transgenic mouse. Raster scan patterns consisting of 512 × 128 depth scans corresponding to a 1 × 1 mm2 area on the retina was used for the imaging. Histologic images were obtained for comparison with OCT images. The histologic image in Fig. 2A shows that the tumor (RT) is in the retinal inner nuclear layer (IN). [15] Fig. 2B shows an OCT cross-sectional image of the same retina. The tumor can be recognized in the OCT image as a high backscattering region, and the location is in the inner nuclear layer. The OCT image agrees with the histology.
Fig. 2.
(a) Histologic image of the retinal tumor (RT) in the inner nuclear layer of an LHβTag transgenic mouse; (b) Cross-sectional OCT image crossing the tumor.
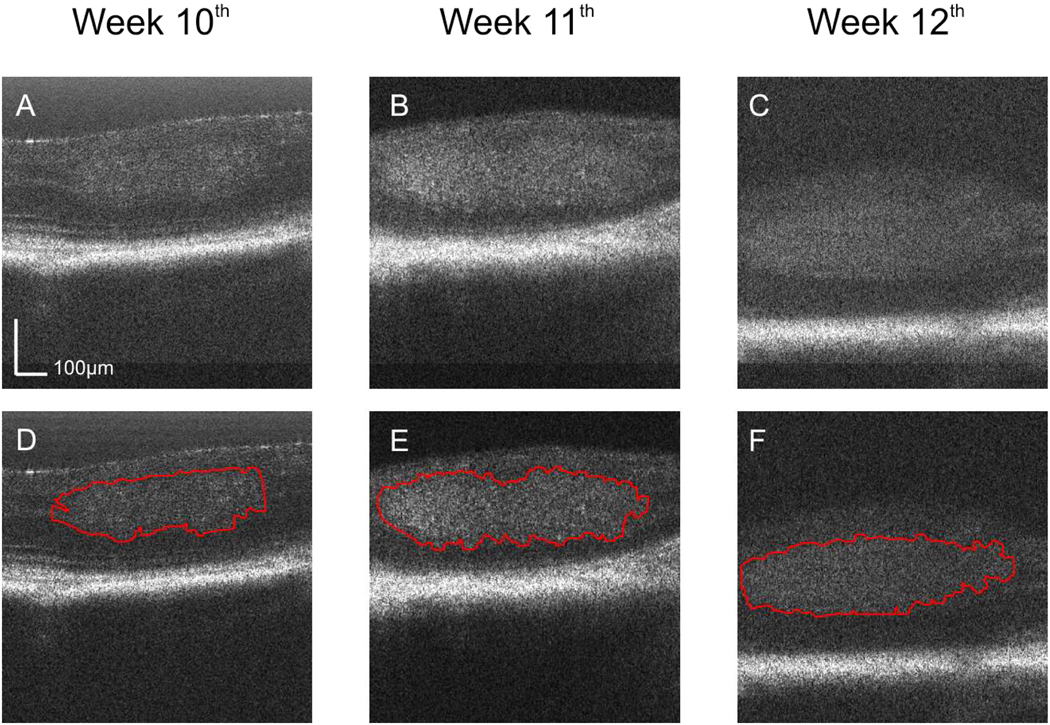
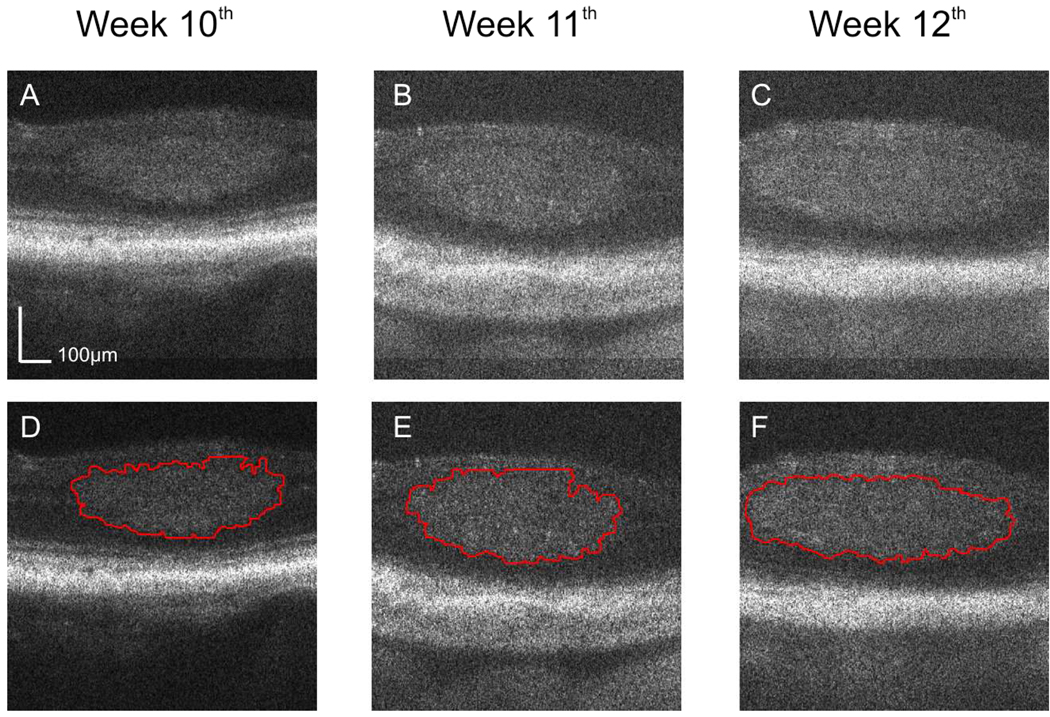
We found that for the LHβTag transgenic mouse the quality of OCT image is not as good as that of the normal Balb/c mouse. We believe the degradation of the image quality is caused by the deformation the tumor induced in the mouse eye. In fact, as shown in our longitudinal studies (Fig. 3 and Fig. 4) the quality of the images progressively deteriorates along the different stages of the tumor growth.
Fig. 3.
OCT images of the retina of a LHβTag transgenic mouse as control in the longitudinal study. The images are located at the same position on the registered fundus and were acquired at the 10th (a, View 2), 11th (b, View 3), and 12th (c, View 4) week of age. The estimated tumor boundaries of the OCT images (a), (b), and (c) by using our segmentation method are shown in (d), (e), and (f), respectively.
Fig. 4.
OCT cross-sectional images of the retina of a LHβTag transgenic mouse treated with SU1498 in the longitudinal study. The images are located at the same position on the registered fundus and acquired at the 10th (a, View 5), 11th (b, View 6), and 12th (c, View 7) week. The estimated tumor boundaries in (a), (b), and (c) by using our segmentation method are shown in (d), (e), and (f), respectively.
3.3 Tumor volume in longitudinal studies
In longitudinal studies, we monitored the retinal tumor growth in a 10 month-old LHβTag mouse that was used as a background control, and in a 10 month-old LHβTag mouse treated with SU1498. For both animals the same tumor was imaged weekly at the 10th, 11th, and 12th week. For each animal, with the guidance of the real-time OCT display and by adjusting the animal positioning system, the same tumor was rapidly located at each time point. Since the tumor located in the superior region of the retina distant to the optic disc, at each time point, two partially overlapped areas of the retina were scanned. One of the scanned areas covered the tumor while the other was close to the optic disc. The two scanned areas were registered according to the blood vessel patterns in the OCT fundus images. With this imaging strategy, it was assured that the same tumor was covered and compared among different time points.
Figure 3(a), (b), and (c) show three OCT cross-sectional images located at the same position on the registered fundus images acquired at the 10th, 11th and 12th week in the control mouse. Figure 3D, E, and F show the tumor segmentation results using our method for each cross-sectional image displayed in Figure 3(a), (b), and (c), respectively. Figure 4(a), (b), and (c) show the cross sectional images for the SU1498 treated eye at the same location on the retina for week 10, 11 and 12. Figure 4(d), (e), and (f) show the corresponding segmentation results. The displayed depth for the images is 500 pixels, corresponding to 0.56 mm.
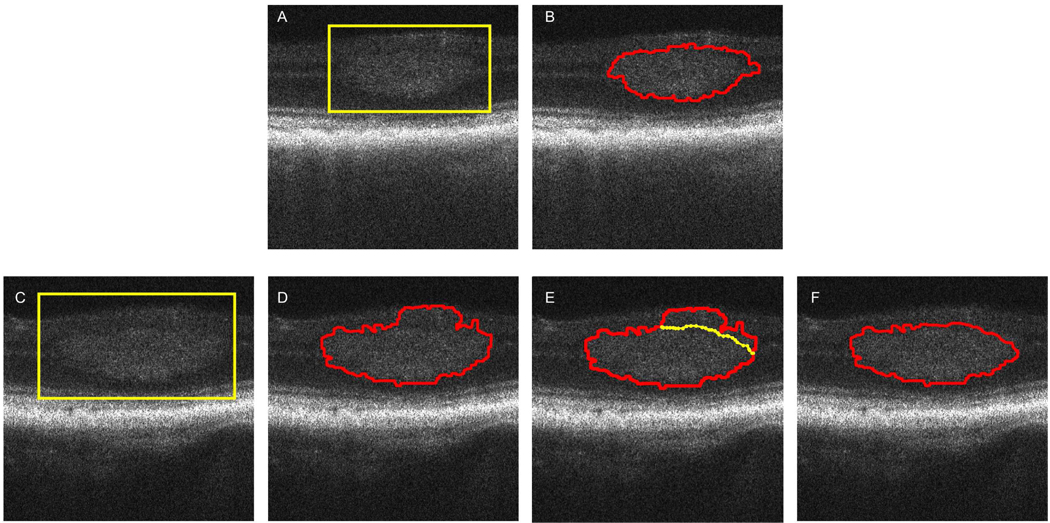
The segmentation method delineated the tumor boundaries accurately in about 60% of the images. Fig. 5(a) and (b) show an example where the tumor boundary was segmented accurately. The region of the tumor is first selected and highlighted by a yellow box. The result of the segmentation is displayed and no correction to the estimated boundary was needed.
Fig. 5.
(a) The region of the tumor is selected and highlighted by a yellow box; (b) The result of the segmentation is displayed and no corrections to the estimated boundary were needed. (C) – (F) Example when the tumor was not segmented 100% satisfactorily. (c) The tumor region is selected by a yellow box on the OCT image; (d) The estimated boundary in the upper right region of the tumor is not accurate due to missing contrast between the tumor and the surrounding region; (e) Manual adjustment (yellow line) allowed to correct the estimated boundary and the final result is displayed in (f).
There were about 40% cases where the segmentation was not 100% satisfactory. In most of these unsatisfied cases, usually parts of the upper boundary were not segmented well, which is due to the lower contrast between the tumor and the surrounding upper retina region. Fig. 5(c), (d), and (e) show an example of tumor segmentation with inaccurate estimation of the boundaries and the manual correction.
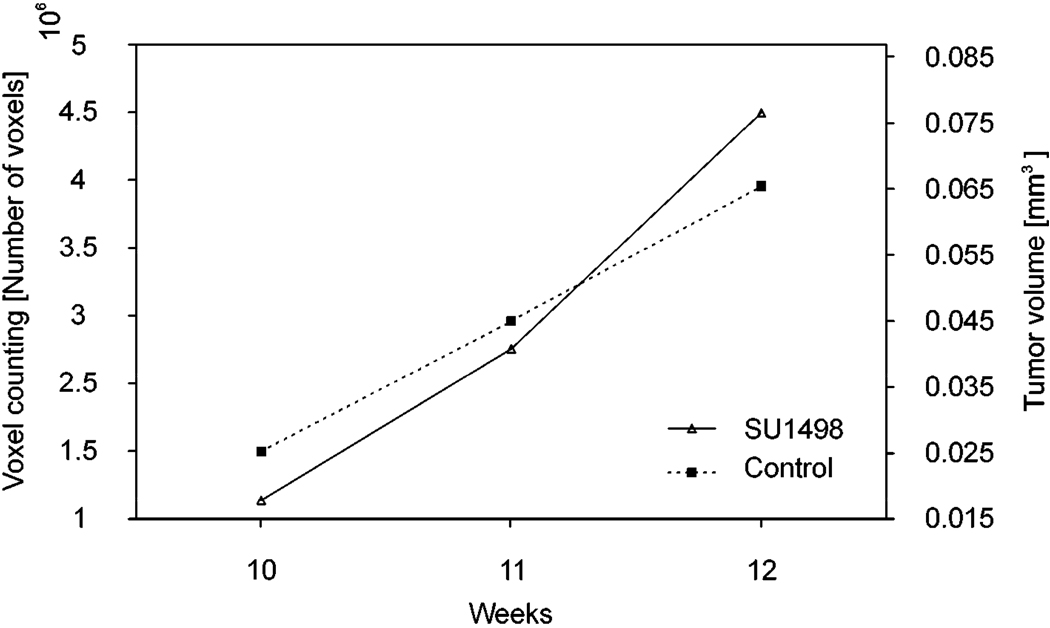
After the tumor boundary was segmented in each OCT B-scan image, the volume of the tumor at each time point was calculated by counting the number of voxels enclosed in the boundary. The original 3D OCT image covers a retinal volume of 1 × 1 × 1.15 (horizontal × vertical × depth) mm3 consisting of 512 × 128 × 1024 voxels, where the imaging depth has been corrected by the refractive index of the mouse retina. The volume for each voxel of the image was 17.1 µm3. Tumor volumes were calculated for all the three stages of the disease in the control and treated mice. The calculated values are shown in Table 1 and plotted in Fig. 6. It is important to note that during 3 weeks of observation the measured tumor volumes increased over time for both the control and the treated animal. The growth of tumor volume in the treated mouse agrees with our previous histological study, which showed that the drug has little treatment effect. [17]
Table 1.
Tumor volumes calculated from the OCT images for control and treated mice.
| Control mouse | Treated mouse (SU1498) | |||
|---|---|---|---|---|
| Time point [Week] | Voxel Count | Tumor Volume [mm3] | Voxel Count | Tumor Volume [mm3] |
| 10 | 1137563 | 0.019 | 1495833 | 0.026 |
| 11 | 2253951 | 0.039 | 2458593 | 0.042 |
| 12 | 3995817 | 0.068 | 3454842 | 0.059 |
Fig. 6.
Progressive growth of the tumor size in the retina of the control mouse and the mouse treated with SU1498. Tumor volume was measured at three different stages of the disease: the 10th, 11th and 12th week of age.
4. Conclusions
The results presented in this study demonstrated the capability of our OCT system to image retinal tumor in longitudinal studies in mouse models. The reported OCT system was combined with an advanced positioning system that allows the operator to rapidly locate and shift the area of interest on the retina. The advanced animal positioning system played a key role in high throughput longitudinal studies. We developed a novel method for segmenting the tumor boundaries. The method is based on parametric deformable models and is driven by machine learning-based region classification, namely a Conditional Random Field. With this method we were able to automatically obtain the tumor boundaries with good accuracy in most images, while users could specify additional constraints (points on the boundary) to correct the segmentation result, if needed. The segmentation tool was used in quantitative monitoring the tumor growth in transgenic mouse of retinoblastoma. Our OCT system was tested in a longitudinal study of one matched pair and demonstrated comparable growth of the tumor despite treatment with SU1498, which agrees with our previous histological study.
Acknowledgments
This project was sponsored in part by the National Institutes of Health grant 1R21 EB008800-01, R01 CA092415 and NEI P30 Core Grant Ey014801. The authors thank Robert Knighton and Philip J. Rosenfeld from Bascom Palmer Eye Institute for their support of the project.
Footnotes
OCIS codes: (170.4500) Optical Coherence Tomography; (170.3880) Medical and biological imaging; (170.4580) Optical diagnostics for medicine; (100.2960) Image analysis
Datasets associated with this article are available at http://hdl.handle.net/10376/1248.
References and Links
- 1.Pendergrass TW, Davis S. Incidence of retinoblastoma in the United States. Archives Ophthalmology. 1980;98:1204–1210. doi: 10.1001/archopht.1980.01020040056003. [DOI] [PubMed] [Google Scholar]
- 2.Tamboli M, Podgor J, Horm JW. The incidence of retinoblastoma in the United States: 1974 through 1985. Archives Ophthalmology. 1990;108:128–132. doi: 10.1001/archopht.1990.01070030134045. [DOI] [PubMed] [Google Scholar]
- 3.Huang D, Swanson EA, Lin CP, Schuman JS, Stinson WG, Chang W, Hee MR, Flotte T, Gregory K, Puliafito CA, Fujimoto JG. Optical coherence tomography. Science. 1991;254:1178–1181. doi: 10.1126/science.1957169. [DOI] [PMC free article] [PubMed] [Google Scholar]
- 4.Fercher F, Hitzenberger CK, Kamp G, El-Zaiat SY. Measurement of intraocular distances by backscattering spectral interferometry. Opt. Commun. 1995;117:43–48. [Google Scholar]
- 5.Li Q, Timmers AM, Hunter K, Gonzalez-Pola C, Lewin AS, Reitze DH, Hauswirth WW. Noninvasive imaging by optical coherence tomography to monitor Retinal Degeneration in the mouse. Investigative Ophthal. Visual Scie. 2001;42:2981–2989. [PubMed] [Google Scholar]
- 6.Horio N, Kachi S, Hori K, Okamoto Y, Yamamoto E, Terasaki H, Miyake Y. Progressive change of optical coherence tomography scans in retinal degeneration slow mice. Archives Ophthalmology. 2001;119:1329–1332. doi: 10.1001/archopht.119.9.1329. [DOI] [PubMed] [Google Scholar]
- 7.Hartl, Ko T, Ghanta RK, Drexler W, Clermont A, Bursell SE, Fujimoto JG. In vivo ultrahigh resolution optical coherence tomography for the quantification of retinal structure in normal and transgenic mice. Invest. Ophthalmol. Visual Sci. 2001;42:S793. (ARVO Abstract #4252) [Google Scholar]
- 8.Shah SM, e Silva EL, Salshin Y, Hackett SF, Woreta F, Campochiaro PA. Comparison of retinal thickness of mice retina with stratus OCT and histology. ARVO Abstract #2375, Fort Lauderdale. 2004 [Google Scholar]
- 9.Kim K, Maguluri GN, Puorishaag M, Umino Y, Barlow RB, De Boer JF. Optical coherence tomography for mouse retinal imaging. ARVO Abstract #2923, Fort Lauderdale. 2006 [Google Scholar]
- 10.Srinivasan VJ, Ko TH, Wojtkowski M, Carvalho M, Clermont A, Bursell SE, Song QH, Lem J, Duker JS, Schuman JS, Fujimoto JG. Noninvasive volumetric Imaging and morphometry of the rodent retina with high-speed, ultra high-resolution optical coherence tomography. Invest. Ophthalmol. Visual Sci. 2006;47:5522–5528. doi: 10.1167/iovs.06-0195. [DOI] [PMC free article] [PubMed] [Google Scholar]
- 11.Ruggeri M, Wehbe H, Jiao S, Gregori G, Jockovich ME, Hackam A, Duan Y, Puliafito CA. In Vivo Three-Dimensional High-Resolution Imaging of Rodent Retina with Spectral-Domain Optical Coherence Tomography. Invest. Ophthalmol. Visual Sci. 2007;48:1808–1814. doi: 10.1167/iovs.06-0815. [DOI] [PubMed] [Google Scholar]
- 12.Hawes NL, Smith RS, Chang B, Davisson M, Heckenlively JR, John SWM. Mouse fundus photography and angiography: a catalogue of normal and mutant phenotypes. Mol Vis. 1999;5:22–29. [PubMed] [Google Scholar]
- 13.Cohan E, Pearch AC, Jokelainen PT, Bohr DF. Optic disc imaging in conscious rats and mice. Invest. Ophthalmol. Visual Scie. 2003;44:2560–2562. doi: 10.1167/iovs.02-0105. [DOI] [PubMed] [Google Scholar]
- 14.Remtulla S, Hallett PE. A schematic eye for the mouse, and comparisons with the rat. Vision Research. 1985;25:21–31. doi: 10.1016/0042-6989(85)90076-8. [DOI] [PubMed] [Google Scholar]
- 15.Windle JJ, Albert DM, O'Brien JM. Retinoblastoma in transgenic mice. Nature. 1990;343:665–669. doi: 10.1038/343665a0. [DOI] [PubMed] [Google Scholar]
- 16.Saishin Y, Saishin Y, Takahashi K, Melia M, Vinores SA, Campochiaro PA. Inhibition of protein kinase c decreases prostaglandin-induced breakdown of the bloodretinal barrier. J. Cell. Physiol. 2003;195:210–219. doi: 10.1002/jcp.10238. [DOI] [PubMed] [Google Scholar]
- 17.Cebulla CM, Jockovich ME, Boutrid H, Piña Y, Ruggeri M, Jiao S, Bhattacharya SK, Feuer WJ, Murray TG. Lack of Effect of SU1498, an Inhibitor of Vascular Endothelial Growth Factor Receptor-2, in a Transgenic Murine Model of Retinoblastoma. The Open Ophthalmology Journal. 2008;2:65–70. doi: 10.2174/1874364100802010062. [DOI] [PMC free article] [PubMed] [Google Scholar]
- 18.Jiao S, Knighton R, Huang X, Gregori G, Puliafito C. Simultaneous acquisition of sectional and fundus ophthalmic images with spectral-domain optical coherence tomography. Opt. Express. 2005;13:444–452. doi: 10.1364/opex.13.000444. http://www.opticsinfobase.org/abstract.cfm?URI=oe-13-2-444. [DOI] [PubMed]
- 19.Tsechpenakis G, Wang J. CRF-based Segmentation of Human Tear Meniscus Obtained with Optical Coherence Tomography. Proc. IEEE Int’l Conf. on Image Processing; San Antonio, TX. 2007. Sep, [Google Scholar]
- 20.Tsechpenakis G, Metaxas D. CRF-driven Implicit Deformable Model. Proc. IEEE Conf. on Computer Vision and Pattern Recognition; Minneapolis, MN. 2007. Jun, [Google Scholar]
- 21.Tsechpenakis G, Wang J, Mayer B, Metaxas D. Coupling CRFs and Deformable Models for 3D Medical Image Segmentation. Proc. IEEE Mathematical Methods in Biomedical Image Analysis, IEEE Int’l Conf. on Computer Vision; Rio de Janeiro, Brazil. 2007. Oct, [Google Scholar]
- 22.Tsechpenakis G, Lujan B, Martinez O, Gregori G, Rosenfeld PJ. Geometric Deformable Model Driven by CoCRFs: Application to Optical Coherence Tomography. Proc. 11th Int'l Conf. on Medical Image Computing and Computer Assisted Intervention; New York City, NY. 2008. Sept, [DOI] [PubMed] [Google Scholar]
- 23.Martinez O, Tsechpenakis G. Integration of Active Learning in a Collaborative CRF. Proc. IEEE Online Learning for Classification, IEEE Conf. on Computer Vision and Pattern Recognition; Anchorage, AK. 2008. Jun, [Google Scholar]
- 24.Kass M, Witkin A, Terzopoulos D. Snakes: Active contour models. International Journal of Computer Vision. 1987;1:321–331. [Google Scholar]


