Abstract
The pancreatic acinar cell produces powerful digestive enzymes packaged in zymogen granules in the apical pole. Ca2+ signals elicited by acetylcholine or cholecystokinin (CCK) initiate enzyme secretion by exocytosis through the apical membrane. Intracellular enzyme activation is normally kept to a minimum, but in the often-fatal human disease acute pancreatitis, autodigestion occurs. How the enzymes become inappropriately activated is unknown. We monitored the cytosolic Ca2+ concentration ([Ca2+]i), intracellular trypsin activation, and its localization in isolated living cells with specific fluorescent probes and studied intracellular vacuole formation by electron microscopy as well as quantitative image analysis (light microscopy). A physiological CCK level (10 pM) eliciting regular Ca2+ spiking did not evoke intracellular trypsin activation or vacuole formation. However, stimulation with 10 nM CCK, evoking a sustained rise in [Ca2+]i, induced pronounced trypsin activation and extensive vacuole formation, both localized in the apical pole. Both processes were abolished by preventing abnormal [Ca2+]i elevation, either by preincubation with the specific Ca2+ chelator 1,2-bis(O-aminophenoxy)ethane-N,N-N′,N′-tetraacetic acid (BAPTA) or by removal of external Ca2+. CCK hyperstimulation evokes intracellular trypsin activation and vacuole formation in the apical granular pole. Both of these processes are mediated by an abnormal sustained rise in [Ca2+]i.
The pancreatic acinar cell has the potential to destroy the pancreas and other tissues because of its high protease content, but important protective features have evolved. Digestive enzymes are packaged as inactive proenzymes inside the membrane-bounded zymogen granules (ZGs), and physiological stimulation elicits exocytosis exclusively through the apical (luminal) membrane (1). The simultaneously occurring fluid secretion carries the proenzymes through the ducts into the gut, where they become activated (2, 3). Nevertheless, pancreatic autodigestion occurs in the human disease acute pancreatitis, which is often fatal (4).
The [Ca2+]i signals initiating exocytosis (5) occur in the apical granule-containing pole where Ca2+ is released from endoplasmic reticulum (ER) terminals penetrating into this region via specific Ca2+ release channels (6–11). This may in turn cause Ca2+-induced Ca2+ release via similar Ca2+ channels in the ZGs (6, 12). During stimulus-secretion coupling, changes in Ca2+ concentration may therefore occur in the cytosol, inside the ER and inside the ZGs.
Intracellular trypsin activation is an important and early event in acute pancreatitis, but the exact activation site and mechanism involved are unclear (4). Because Ca2+ normally couples stimulus to secretion (10), we have tested the hypothesis that Ca2+ also plays a crucial role in the abnormal trypsin activation that occurs during prolonged hyperstimulation of pancreatic acinar cells, a condition that represents many features of acute pancreatitis (13–16). We show that, whereas a physiological cholecystokinin (CCK) concentration (10 pM) does not cause intracellular trypsin activation, continued exposure to 10 nM CCK does have such an effect. This activation depends on a rise in [Ca2+]i and can also be induced by selective blockade of the ER Ca2+ pumps with thapsigargin. Ca2+-mediated trypsin activation occurs selectively in the apical granule-containing region and is associated with extensive vacuole formation in the apical area. We have quantified this process and demonstrated its dependence on an elevated [Ca2+]i. We conclude that during CCK hyperstimulation, the apical pole undergoes a dramatic Ca2+-dependent change characterized by local trypsin activation and replacement of the normal ZGs by vacuoles.
Materials and Methods
Cell Isolation and Solution.
Isolated pancreatic acinar cells and small clusters of acinar cells (two or three cells) were obtained from isolated mouse pancreata by treatment with collagenase (Worthington, Lorne Laboratories, Reading, U.K.) as described (8, 17). The extracellular NaHepes solution contained (in mM): NaCl 140, KCl 4.7, CaCl2 1.1, MgCl2 1.13, glucose 10, and Hepes 10, adjusted to pH 7.4 with NaOH (all chemicals from Sigma).
Cytosolic Ca2+ Measurements.
Cells were loaded with fura-2 by incubation with 1 μM fura-2-AM (Sigma) for 35 min at room temperature, followed by washing and incubation for a further 30 min to enable intracellular esterases to deesterify the dye. In relevant preparations, cells were simultaneously loaded with the specific Ca2+ chelator 1,2-bis(O-aminophenoxy)ethane-N,N-N′,N′-tetraacetic acid (BAPTA) by incubation with 5 μM BAPTA-AM (Molecular Probes) for the same length of time. Cells were placed in a perifusion chamber on a Nikon Diaphot inverted microscope (Nikon) and continuously perifused with NaHepes. Fluorescence images were sent via an intensified charge couple device (Photonic Science, Robertsbridge, U.K.) to a dedicated digital image analysis system (tardis, Applied Imaging, Gateshead, U.K.) running on magical computer hardware (Applied Imaging). Interference filters on a rotational filter wheel allowed selection of alternate excitation wavelengths of 340 nm and 380 nm from a Xenon light source. Background subtraction was carried out independently at each of the two wavelengths and ratios (340 nm/380 nm), which are proportional to [Ca2+]i, were calculated for each image. Calibration was done by exposing cells loaded with the dye to 5 mM EGTA or 10 mM Ca2+ in the presence of 20 μM ionomycin (Sigma) (18), by using a dissociation constant for Ca2+-fura at room temperature of 150 nM.
Measurement of Trypsin Activity.
After fura-2 loading, the acinar cells were also loaded with a 60-second pulse of 5 μM rhodamine 110, bis-(CBZ-l-isoleucyl-l-prolyl-l-arginine amide) dihydrochloride (BZiPAR) (Molecular Probes) (19). This is a specific substrate for the serine protease trypsin, which becomes fluorescent after cleavage of the two oligopeptide side chains. Activation may be observed by fluorescence of rhodamine 110 by using an excitation wavelength of 485 nm (19, 20). In this way it was possible to measure both [Ca2+]i and trypsin activity simultaneously. To ensure that tryptic activity observed was from intracellular enzymes only and not from trypsin released into the extracellular fluid, cells for these experiments were prepared in NaHepes containing 5 μM soybean trypsin inhibitor (SBTI), and all solutions used also contained SBTI. At this concentration SBTI can inhibit 1,000 units of trypsin per milliliter. The localization of the trypsin activity was investigated by confocal microscopy (Zeiss).
Measurement of Mitochondrial Membrane Potential.
The cells were loaded with tetramethyl rhodamine ethyl ester (TMRE) (100 nM, 1/2 hour at 37°C) and examined by confocal microscopy (Zeiss). The TMRE fluorescence was expressed as a percentage change compared with control, and values were corrected for bleaching whenever necessary.
Electron Microscopy.
After incubation with the relevant stimulus, acini were pelleted by centrifugation at 150 × g for 2 min and fixed by using 4% paraformaldehyde and 2% glutaraldehyde (TAAB Laboratories, Reading, Berkshire, U.K.) in 0.1 M sodium cacodylate buffer (Agar Scientific, Stansted, Essex, U.K.) at pH 7.4 for 24 h. The samples were then immersed in osmium tetroxide (BDH) at room temperature for 2–3 h and then in uranyl acetate for the same period. The cells were dehydrated in serial solutions of ethanol and acetone before being embedded in resin. For examination by electron microscopy, ultrathin (60- to 90-nm) sections were stained with lead citrate (BDH) and mounted on 200 mesh copper grids, whereas for light microscopy, semithin (500-nm) sections were stained with toluidine blue (EMscope Laboratories, Ashford, Kent, U.K.). Electron microscopy was performed on a Hitachi H-600 (Tokyo) transmission electron microscope.
Quantitative Assessment of Vacuolization.
The degree of cytoplasmic vacuolization was quantified by using biovision 2.2 and openlab image analysis systems on an Improvision Macintosh computer (Improvision, Warwick, U.K.) attached to a light microscope. Toluidine blue sections were photographed by using a ×100 objective lens. From 30 to 50 cells were analyzed in each section, and the results from five separate experiments were pooled to give the final results. Only cells sectioned through both apical and basal poles were assessed, whereas single isolated cells were excluded. The number of vacuoles in each cell and the percentage of the total cell area taken up by abnormal vacuoles were recorded from each section, with all sections blinded to two independent observers. Statistical analysis (Mann–Whitney u test, Kruskal–Wallis Multiple Comparisons) indicated there was no significant difference between the two sets of data obtained by the two independent observers (M.R. and J.W.). This analysis provided a more objective analysis of vacuolization than was practicable by electron microscopy.
Results
Cholecystokinin-Elicited Intracellular Trypsin Activation and Its Relationship to the Cytosolic Ca2+ Rise.
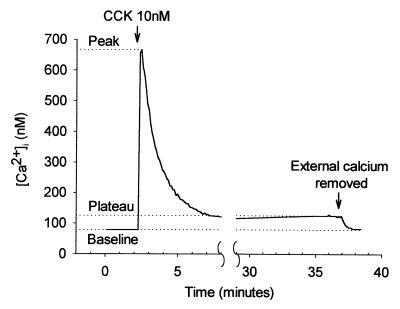
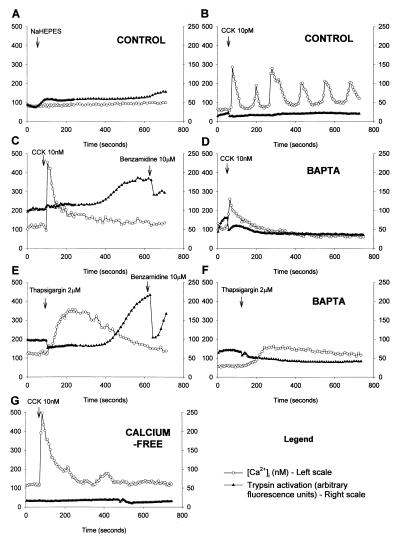
A high and nonphysiological CCK concentration (10 nM) elicited an immediate increase in [Ca2+]i to a peak of 590 ± 30 nM from a baseline of 97 ± 7 nM (n = 53). This rise tailed off over a period of about 5 min and was followed by a prolonged plateau phase during which the [Ca2+]i level remained significantly elevated above baseline by 31 ± 3 nM (P < 0.0001, paired t test) (Fig. 1). Only 2 of 38 cells studied failed to demonstrate this prolonged plateau phase, which could be maintained for at least 60 min. In the absence of CCK stimulation, [Ca2+]i remained stable at the resting level for as long as the cells were monitored (Fig. 2A). CCK at a physiological concentration (10 pM) evoked repetitive Ca2+ transients (Fig. 2B).
Figure 1.
[Ca2+]i response to hyperstimulation with CCK, showing the typical large initial rise followed by a prolonged plateau phase. Removal of external Ca2+ during the plateau phase results in a drop in [Ca2+]i back to baseline levels indicating that plasma membrane Ca2+ channels remain open throughout the stimulation period. The measurements used to quantify changes in [Ca2+]i as described in the text are indicated.
Figure 2.
Simultaneous measurement of [Ca2+]i response with fura-2 (○) (nM, plotted on left scale) and trypsin activity with BZiPAR (▴) (arbitrary fluorescence units, plotted on right scale). (A) Nonstimulated control. Little change in either [Ca2+]i or BZiPAR fluorescence. (B) Stimulation with 10 pM CCK elicits typical [Ca2+]i oscillations without trypsin activation. (C) Stimulation with 10 nM CCK evokes an immediate elevation of [Ca2+]i followed by a prolonged plateau phase. After a delay of approximately 300 seconds, there is a rise in trypsin activity to an elevated plateau level. Addition of 10 μM benzamidine, a cell-permeable trypsin inhibitor, reduces activity. (D) Stimulation with 10 nM CCK after pretreatment with BAPTA produces an attenuated [Ca2+]i response and no trypsin activation. (E) Thapsigargin (2 μM) evokes a broad [Ca2+]i response, and there is marked enzyme activation after 300 seconds, which is subsequently reduced by 10 μM benzamidine. (F) After BAPTA preloading, thapsigargin elicits very little change in [Ca2+]i and there is no sign of trypsin activity. (G) In the absence of external Ca2+, 10 nM CCK evokes a normal transient [Ca2+]i rise but no plateau phase and also no enzyme activation.
By using the fluorescent probes BZiPAR and fura-2 together, trypsin activity and [Ca2+]i were measured simultaneously. In 38 of 43 cells studied, the [Ca2+]i rise induced by the very high CCK concentration (10 nM) was followed by trypsin activation, after a delay of approximately 300 seconds (Fig. 2C). When the membrane-permeable trypsin inhibitor benzamidine was added, the fluorescence intensity decreased, most likely because of loss of trypsin activity and rapid washout of rhodamine 110. Nonstimulated control cells showed no change in [Ca2+]i and no evidence of trypsin activation (Fig. 2A). Furthermore, the regular [Ca2+]i oscillations evoked by the physiological CCK concentration (10 pM) were not associated with any trypsin activation (Fig. 2B). Of the 31 cells studied, only 3 showed a slight increase in trypsin activity after 10 pM CCK.
Preloading the acinar cells with the Ca2+ chelator BAPTA reduced the baseline [Ca2+]i to 52 ± 4 nM and significantly attenuated the peak [Ca2+]i to 268 ± 28 nM after CCK hyperstimulation (10 nM) (n = 57, P < 0.001, student's t test, compared with CCK hyperstimulated control cells, not loaded with BAPTA). BAPTA preloading also abolished the continued plateau elevation of [Ca2+]i normally seen after 10 nM CCK. In the BAPTA-loaded cells, CCK (10 nM) did not evoke any trypsin activation in the 24 cells studied (Fig. 2D).
The ER Ca2+-ATPase inhibitor thapsigargin induced an elevation of [Ca2+]i similar to that observed in response to 10 nM CCK with a peak [Ca2+]i of 384 ± 18 nM (n = 107) and an even more pronounced plateau phase with an elevation above baseline of 45 ± 7 nM at 60 min. In 12 of 12 cells, thapsigargin evoked trypsin activation similar to that seen in response to 10 nM CCK (Fig. 2E). Preloading the acinar cells with BAPTA attenuated the peak [Ca2+]i after thapsigargin to 187 ± 9 nM (n = 44, P < 0.001, compared with thapsigargin in normal cells). BAPTA preloading reduced the continued plateau elevation after thapsigargin to 19 ± 3 nM (n = 28) above baseline. In the BAPTA-loaded cells, thapsigargin (2 μM) did not evoke any trypsin activation (Fig. 2F).
Cells suspended in Ca2+-free medium were also studied. These maintained their baseline [Ca2+]i at 105 ± 5 nM, and the peak elevation after CCK hyperstimulation (10 nM) was only slightly suppressed at 422 ± 46 nM (n = 48), but there was no prolonged plateau elevation (Fig. 2G). In the Ca2+-free medium, 10 nM CCK did not generate any detectable enzyme activation (Fig. 2G) in any of the 48 cells studied.
Localization of Trypsin Activation.
To establish the intracellular location(s) of the CCK-elicited trypsin activation, we used confocal microscopy of living acinar cells loaded with BZiPAR to detect the intracellular distribution of the activated rhodamine 110 fluorescence. The transmitted light picture in Fig. 3A shows the usual polarized structure of a pancreatic acinar cell, with the densely packed ZGs to the right and the relatively clear basal area to the left. Before the CCK application, there is no detectable fluorescence (Fig. 3B), but the image taken at the peak of the response to 10 nM CCK (15 min) (Fig. 3C) shows clearly fluorescence coming exclusively from the granular region (n = 22).
Figure 3.
CCK (10 nM) evokes trypsin activation specifically in the apical granular area. (A) Transmitted light image showing the ZGs clustered at the secretory pole in the right part of the cell. (Bar = 5 μm.) (B) Fluorescence image taken just before the application of CCK. (C) Fluorescence image taken 15 min after start of stimulation with 10 nM CCK, demonstrating trypsin activity concentrated in the granular portion of the cell. There is virtually no fluorescence from tryptic cleavage of BZiPAR in the rest of the cell.
Intracellular Vacuoles Induced by a Rise in the Cytosolic Ca2+ Concentration.
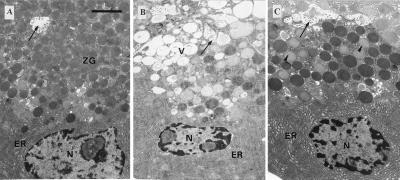
The ultrastructure of the normal pancreatic acinar cell is shown in Fig. 4A. The apical part of the cell, surrounding the acinar lumen, is packed with ZGs. Stimulation with 10 pM CCK for 60 min did not cause any major change in the cellular ultrastructure, but 60 min incubation with 10 nM CCK led to the formation of abnormal vacuoles within the cytoplasm and a marked reduction in the density of normal ZGs. The pale vacuoles were located in the apical (granular) part of the cells (Fig. 4B). In cells preloaded with the Ca2+ chelator BAPTA, there was no significant increase in the degree of vacuolization after 60 min of CCK (10 nM) stimulation (Fig. 4C).
Figure 4.
Ultrastructure of pancreatic acinar cells. (Bar = 2 μm.) (A) Normal acinar cell after loading with fura-2 showing ZGs concentrated in the apical pole of the cell, close to the acinar lumen (arrow), into which microvilli project. The basal region of the cell contains nucleus (N) surrounded by cisternae of ER. (B) Acinar cell after stimulation with 10 nM CCK for 60 minutes. Vacuoles (V) have accumulated in the apical cytoplasm. N, nucleus; arrow, acinar lumen. (C) Acinar cell loaded with BAPTA and stimulated with 10 nM CCK for 60 min. There is little evidence of vacuolization. Some decondensation of ZGs (arrowheads) has occurred.
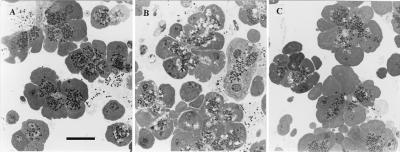
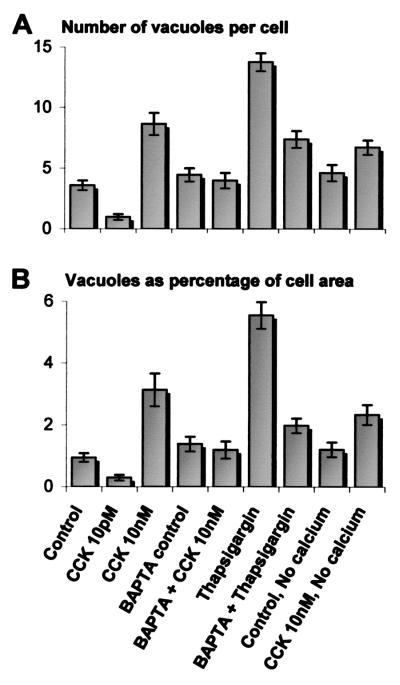
To quantify the extent of vacuole formation, toluidine blue-stained sections were viewed in the light microscope and assessed with an image analysis system. Fig. 5A shows normal cells in which the apical areas are dominated by the ZGs, whereas Fig. 5B shows cells with extensive vacuolization after 60 min of stimulation with 10 nM CCK. In the control cells, there were 3.6 ± 0.4 (mean ± SE) vacuoles per cell, occupying 0.9 ± 0.1% of the cell area (n = 194). In cells stimulated by 10 pM CCK, there was actually a decrease in the extent of vacuolization to 1.0 ± 0.2 vacuoles per cell, occupying 0.3 ± 0.1% of the cellular area (n = 151, P < 0.01, ANOVA with Bonferroni correction). In contrast, after incubation for 60 min with 10 nM CCK, there were 8.6 ± 0.9 vacuoles per cell, occupying 3.1 ± 0.5% of the cellular cross-sectional area (n = 86, P < 0.01).
Figure 5.
Examples of toluidine blue-stained sections of acinar cells viewed under light microscope, used for quantification of vacuolization. Darkly stained ZGs are seen in the apical areas, against the pale cytoplasm. Vacuoles appear as unstained “holes” within the cytoplasm. Nuclei are seen in some sections. (Bar = 20 μm.) (A) Unstimulated control cells. ZGs are plentiful and few vacuoles are visible. (B) Cells incubated with 10 nM CCK for 60 minutes in Ca2+-containing medium. Abnormal vacuoles are clearly seen. (C) BAPTA-loaded cells stimulated with 10 nM CCK for 60 minutes. The cellular appearance is almost indistinguishable from the control cells. Vacuolization is blocked.
In cells preloaded with the Ca2+ chelator BAPTA, there was no significant increase in the degree of vacuolization after 60 min of CCK (10 nM) stimulation (Fig. 5C) (4.0 ± 0.6 vacuoles per cell, 1.2 ± 0.3%, n = 60, P > 0.05, compared with controls). There was also no significant difference between control cells loaded with BAPTA (4.5 ± 0.6 vacuoles per cell, 1.4 ± 0.2%, n = 116) and those loaded with fura-2 alone (P > 0.05).
Exposure to 2 μM thapsigargin for 60 min also led to the formation of abnormal vacuoles within the cytoplasm (13.8 ± 0.7 vacuoles per cell, or 5.6 ± 0.4% cell area, n = 157). These had a similar distribution and appearance to the vacuoles described in response to secretagogue hyperstimulation. In cells preloaded with BAPTA, the degree of vacuolization in response to thapsigargin stimulation was greatly reduced with 7.4 ± 0.7 vacuoles per cell, or 2.0 ± 0.2% of cell area (n = 153, P < 0.01).
There was no significant increase in vacuolization in control cells incubated in Ca2+-free medium compared with those in standard medium containing 1 mM Ca2+ (4.6 ± 0.7 vacuoles per cell and 1.2 ± 0.2% cell area, n = 57). In the absence of external Ca2+, 10 nM CCK did not induce any significant additional vacuolization (6.7 ± 0.6 vacuoles per cell and 2.3 ± 0.3%, n = 141, P > 0.05), and the extent of vacuolization was significantly less than in cells stimulated with 10 nM CCK in Ca2+-containing medium (P < 0.01).
The quantitative analysis of the results from the various series is summarized in Fig. 6. Irrespective of whether a [Ca2+]i rise was generated by hyperstimulation of CCK receptors or by blocking the ER Ca2+ pump, the result was a substantial degree of vacuolization in the apical pole of the cells. Preincubation of the cells with a membrane-permeant Ca2+ chelator, BAPTA, almost completely protected against the vacuole formation evoked by CCK or thapsigargin.
Figure 6.
Degree of cytoplasmic vacuole formation in each experimental group, expressed as (A) number of vacuoles per cell and (B) area of vacuoles as a percentage of cell sectional area. Each column represents the mean value, and the bars show standard error.
The Effect of CCK Hyperstimulation on the Potential Across the Inner Mitochondrial Membrane.
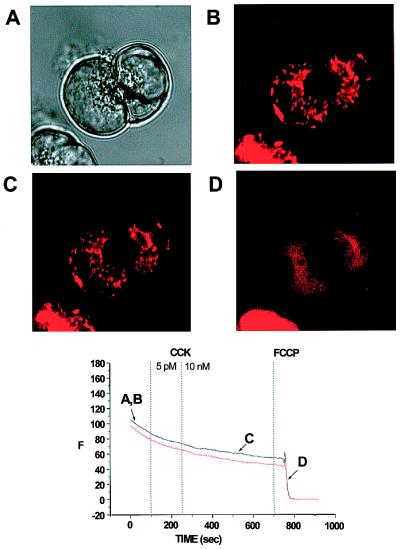
We tested whether prolonged CCK hyperstimulation was associated with a change in mitochondrial function. As a sensitive function test, we monitored possible changes in the electrical potential across the inner mitochondrial membrane, with the potential-sensitive fluorescent probe TMRE. Fig. 7 shows a typical experiment on two connected cells. The transmitted light picture (Fig. 7A) shows the usual configuration with the granules concentrated in the apical poles. As previously documented (21), the fluorescence from the active mitochondria was concentrated in a ring surrounding the granular pole (Fig. 7B), and this remained the case even after a prolonged period of stimulation with 10 nM CCK (Fig. 7C). The fluorescence intensity from the mitochondrial belt remained stable throughout the period of stimulation, first with a physiological and later with a pharmacological CCK concentration, but after application of the protonophore carbonylcyanide p-trifluoro-methoxyphenylhydrazone (FCCP) (5 μM), the mitochondrial membrane potential collapsed, and the TMRE fluorescence was dispersed (Fig. 7D). In the 12 cells investigated, 5 pM CCK reduced the fluorescence intensity only by 1.3 ± 0.6%, and further stimulation with 10 nM CCK reduced the fluorescence intensity by 3.9 ± 0.7%. In 10 of these cells, subsequent addition of 5 μM FCCP caused a dramatic decrease in fluorescence, which was reduced by 84.2 ± 8.6%. We therefore conclude that even prolonged hyperstimulation with CCK does not lead to any major mitochondrial depolarization.
Figure 7.
Distribution of mitochondria-specific TMRE fluorescence in living acinar cells and effect of CCK on the mitochondrial membrane potential. (A) Transmitted light image of two acinar cells showing granules concentrated at the secretory pole. (B) The active mitochondria are shown by TMRE fluorescence as a ring surrounding the granular region. (C) After prolonged hyperstimulation with CCK (10 nM), there is no change in the configuration of the mitochondria or in their membrane potential, as shown by persistence of TMRE fluorescence. (D) After application of the protonophore carbonylcyanide p-trifluoro-methoxyphenylhydrazone (5 μM), the mitochondrial membrane potential collapses, and the TMRE fluorescence is dispersed. Below the four images is shown a graph illustrating TMRE fluorescence intensity throughout the experiment in the two cells studied.
Discussion
Prolonged CCK hyperstimulation of pancreatic acinar cells causes Ca2+-dependent trypsin activation in the apical granular area (Figs. 2 and 3) and also evokes Ca2+-dependent changes in the acinar cell morphology, so that the electron-dense ZGs to a large extent are replaced by vacuoles (Figs. 4 and 5). It would appear that trypsin activation and vacuolization are caused directly by the rise in [Ca2+]i, because treatment of the cells with the ER Ca2+ ATPase inhibitor thapsigargin has effects similar to those elicited by a high dose of CCK (Figs. 2E and 6). Both CCK receptor stimulation and blockade of the ER Ca2+ ATPase would also reduce the Ca2+ concentration inside the ER store (22). It is, however, the rise in the [Ca2+]i and not the ER Ca2+ store depletion that is responsible for the cellular changes, because loading the cytosol with the specific Ca2+ chelator BAPTA protected against the changes evoked by both CCK hyperstimulation (Figs. 2D and 6) and ER Ca2+ ATPase blockade (Figs. 2F and 6). As seen in Fig. 2, BAPTA preloading markedly attenuated the [Ca2+]i signals. We have previously shown that even when [Ca2+]i is clamped at the resting level by dialyzing the cell interior with a solution containing 10 mM BAPTA, the agonist-elicited Ca2+ release from the ER is not inhibited but is actually enhanced (22). Vacuole formation might be a consequence of ATP depletion, which could in principle be caused by depolarization of the inner mitochondrial membrane, but prolonged CCK hyperstimulation did not result in any marked depolarization, which could, however, readily be observed by application of a protonophore (Fig. 7).
The substantial repetitive [Ca2+]i spikes elicited by 10 pM CCK consistently failed to activate trypsin (Fig. 2B), whereas the relatively small but sustained [Ca2+]i elevation induced by 10 nM CCK caused marked trypsin activation (Fig. 2C) demonstrating the importance of using oscillatory Ca2+ signals to prevent a toxic Ca2+ overload. The very different response patterns to low (pM) and high (nM) CCK concentrations would seem to indicate the involvement of two different receptor types. Two types of CCK receptors are indeed known. The type A receptor mediates the Ca2+ signal, which activates enzyme secretion and has a much higher affinity for CCK than gastrin. The function of the type B receptor, which is also referred to as the gastrin receptor, as it has equal affinity for CCK and gastrin, is less clear (23). However, mouse pancreatic acinar cells express only type A and not type B receptors (24). Type A receptors can exist in high- or low-affinity states (23). The responses to a physiological CCK concentration (10 pM) are mediated by high-affinity state receptors, whereas the responses to hyperstimulation (10 nM CCK) must be mediated by low-affinity state receptors (23). High unphysiological CCK concentrations can activate phospholipase C and thereby generate the Ca2+ releasing messenger inositol 1,4,5-trisphosphate (IP3) (25), but the Ca2+ mobilizing action of a physiological CCK level is triggered via intracellular receptors for nicotinic acid adenine dinucleotide phosphate and cyclic ADP-ribose, subsequently recruiting active IP3 receptors (26). The actions of the low (pM) and high (nM) CCK concentrations are therefore most likely triggered via different intracellular pathways (26).
Although there are similarities in the changes in acinar cell function and morphology observed in acute pancreatitis and after CCK hyperstimulation, we are not suggesting that CCK hyperstimulation is the cause of acute pancreatitis. We have simply used CCK hyperstimulated acinar cells as a model for studying abnormal changes that resemble those seen in this disease.
How could hyperstimulation affect the ZGs? These organelles have a very high total calcium concentration (≈15 mM), but the free intragranular Ca2+ concentration is only about 50 μM (12). This is lower than the free Ca2+ concentration inside the ER (≈100–300 μM) (22) but much higher than [Ca2+]i (≈50–100 nM). Inositol 1,4,5-trisphosphate can release Ca2+ from isolated ZGs (12), chromaffin granules (27, 28), and goblet-cell mucin granules (29). Reuptake of Ca2+ into the granules is driven by a vacuolar-type H+-ATPase, and the ER is the source of the Ca2+ needed for refilling (30). If the ER were empty because of excessive agonist stimulation or blockade of the ER Ca2+ ATPase, refilling of the granular Ca2+ store would not occur (30). Ca2+ is important for the stability of the granules (31, 32), and Ca2+ ionophore-induced loss of Ca2+ from ZGs causes granule lysis (31). The vast amount of Ca2+ normally bound inside the granules (12) therefore plays an important role in making the proteins combine to osmotically and chemically inactive aggregates (33). CCK hyperstimulation liberates Ca2+ from granules in intact acinar cells (34), and this could increase [Ca2+]i close to the cytosolic face of the granule membrane, potentially opening Ca2+-activated K+ channels (29). There is a K+ conductance pathway in the ZG membrane (35) that is regulated by a high-affinity dihydropyridine-binding protein (36). X-ray microanalysis of both frozen hydrated and dehydrated sections of pancreas shows that a relatively high concentration of CCK (1 nM) evokes a marked reduction in the Ca2+ concentration and a marked increase in the K+ concentration inside the ZGs (34). Ca2+ release is therefore associated with K+ uptake into the granule interior. This may result in Ca2+/K+ ion exchange in the granular matrix causing disaggregation (29), because K+ inhibits protein condensation and the binding of aggregates to membranes (37).
Our findings may be relevant to the pathophysiology of acute pancreatitis, a disease in which the pancreas digests itself because of intracellular protease activation (4). Vacuole formation occurs in the early stages of both experimental and clinical acute pancreatitis (38). Trypsinogen activation is one of the earliest manifestations of clinical acute pancreatitis (39), and its importance for the pathogenesis of the human disease has been confirmed by the identification of mutations responsible for hereditary pancreatitis, which lie within the genes coding for cationic trypsinogen (PRSS1). These mutations (R122H and N21I) prevent the degradation of active trypsin, thus circumventing one of the intracellular mechanisms preventing premature enzyme activation (40, 41).
We have previously proposed that an abnormally elevated [Ca2+]i might be a trigger for acute pancreatitis (42). The present work provides direct evidence for a role of Ca2+ in mediating intracellular trypsin activation, which is recognized as a crucial step in the pathophysiology of acute pancreatitis (4). Cerulein-induced pancreatitis is associated with a progressive disruption of acinar cell Ca2+ signaling and specifically the ability to initiate Ca2+ signals in the apical granular pole (43). The data presented here show that hyperstimulation results in a profound change in the structure of the apical pole, because the normal ZGs are largely replaced by vacuoles.
Our new results highlight the importance of continuing Ca2+ influx from the external solution for CCK-induced trypsin activation. In the absence of external Ca2+, there was no measurable trypsin activation, although the initial CCK-elicited [Ca2+]i transient was well preserved (Fig. 2G). The Ca2+ influx during the sustained phase of CCK stimulation is mediated by store-operated Ca2+ channels in the plasma membrane (44). If and when suitable pharmacological tools for blocking the opening of this channel type become available, we might have an attractive therapy for prevention of inappropriate protease activation.
Acknowledgments
We thank Nina Burdakova for technical support. This work was supported by a Medical Research Council Program Grant. M.R. was supported by a fellowship from The Royal College of Surgeons. O.H.P. is a Medical Research Council Research Professor.
Abbreviations
- ZG
zymogen granule
- CCK
cholecystokinin
- [Ca2+]i
cytosolic Ca2+ concentration
- BAPTA
1,2-bis(O-aminophenoxy)ethane-N,N,N′,N′-tetraacetic acid
- ER
endoplasmic reticulum
- BZiPAR
rhodamine 110, bis-(CBZ-l-isolyl-l-prolyl-l-arginine amide) dihydrochloride
- TMRE
tetramethyl rhodamine ethyl ester
Footnotes
See commentary on page 12933.
References
- 1.Palade G E. Science. 1975;189:347–358. doi: 10.1126/science.1096303. [DOI] [PubMed] [Google Scholar]
- 2.Case R M, Argent B E. In: Handbook of Physiology. Schultz S G, editor. Washington, DC: Am. Physiol. Soc.; 1989. pp. 383–417. [Google Scholar]
- 3.Gorelick F S, Jamieson J D. In: Physiology of the Gastrointestinal Tract. 3rd Ed. Johnson L R, Alpers D H, Jacobson E D, Christensen J, Walsh J H, editors. New York: Raven; 1994. pp. 1353–1376. [Google Scholar]
- 4.Neoptolemos J P. In: Acute Pancreatitis, in Bailliere's Clinical Gastroenterology. Neoptolemos J P, editor. Vol. 13. London: Bailliere Tindall; 1999. [Google Scholar]
- 5.Kasai H. Trends Neurosci. 1999;22:88–93. doi: 10.1016/s0166-2236(98)01293-4. [DOI] [PubMed] [Google Scholar]
- 6.Petersen O H, Burdakov D, Tepikin A V. BioEssays. 1999;21:851–860. doi: 10.1002/(SICI)1521-1878(199910)21:10<851::AID-BIES7>3.0.CO;2-F. [DOI] [PubMed] [Google Scholar]
- 7.Kasai H, Li Y X, Miyashita Y. Cell. 1993;74:669–677. doi: 10.1016/0092-8674(93)90514-q. [DOI] [PubMed] [Google Scholar]
- 8.Thorn P, Lawrie A M, Smith P M, Gallacher D V, Petersen O H. Cell. 1993;74:661–668. doi: 10.1016/0092-8674(93)90513-p. [DOI] [PubMed] [Google Scholar]
- 9.Nathanson M H, Fallon M B, Padfield P J, Maranto A R. J Biol Chem. 1994;269:4693–4696. [PubMed] [Google Scholar]
- 10.Petersen O H, Petersen C C H, Kasai H. Annu Rev Physiol. 1994;56:297–319. doi: 10.1146/annurev.ph.56.030194.001501. [DOI] [PubMed] [Google Scholar]
- 11.Mogami H, Nakano K, Tepikin A V, Petersen O H. Cell. 1997;88:49–55. doi: 10.1016/s0092-8674(00)81857-7. [DOI] [PubMed] [Google Scholar]
- 12.Gerasimenko O V, Gerasimenko J V, Belan P V, Petersen O H. Cell. 1996;84:473–480. doi: 10.1016/s0092-8674(00)81292-1. [DOI] [PubMed] [Google Scholar]
- 13.Adler G, Rohr G, Kern H F. Dig Dis Sci. 1982;27:993–1002. doi: 10.1007/BF01391745. [DOI] [PubMed] [Google Scholar]
- 14.Burnham D B, Williams J A. Cell Tissue Res. 1982;222:201–212. doi: 10.1007/BF00218300. [DOI] [PubMed] [Google Scholar]
- 15.Lampel M, Kern H F. Virchow's Arch A Pathol Anat Histol. 1977;373:97–117. doi: 10.1007/BF00432156. [DOI] [PubMed] [Google Scholar]
- 16.Niederau C, Ferrell L D, Grendell J H. Gastroenterology. 1985;88:1192–1204. doi: 10.1016/s0016-5085(85)80079-2. [DOI] [PubMed] [Google Scholar]
- 17.Williams J, Korc M, Dormer R L. Am J Physiol. 1978;235:E517–E524. doi: 10.1152/ajpendo.1978.235.5.E517. [DOI] [PubMed] [Google Scholar]
- 18.Grynkiewicz G, Poenie M, Tsien R Y. J Biol Chem. 1985;260:3440–3450. [PubMed] [Google Scholar]
- 19.Kruger B, Lerch M M, Tessenow W. Lab Invest. 1998;78:763–764. [PubMed] [Google Scholar]
- 20.Halangk W, Sturzebecher J, Matthias R, Schulz H U, Lippert H. Biochim Biophys Acta. 1997;1362:243–251. doi: 10.1016/s0925-4439(97)00082-3. [DOI] [PubMed] [Google Scholar]
- 21.Tinel H, Cancela J M, Mogami H, Gerasimenko J V, Gerasimenko O V, Tepikin A V, Petersen O H. EMBO J. 1999;18:4999–5008. doi: 10.1093/emboj/18.18.4999. [DOI] [PMC free article] [PubMed] [Google Scholar]
- 22.Mogami H, Tepikin A V, Petersen O H. EMBO J. 1998;17:435–442. doi: 10.1093/emboj/17.2.435. [DOI] [PMC free article] [PubMed] [Google Scholar]
- 23.Jensen R T. In: Physiology of the Gastrointestinal Tract. 3rd Ed. Johnson L R, Alpers D H, Jacobson E D, Christensen J, Walsh J H, editors. New York: Raven; 1994. pp. 1377–1446. [Google Scholar]
- 24.Saillan-Bareau C, Clerc P, Adato M, Escrieut C, Vaysse N, Fourmy D, Dufresne M. Gastroenterology. 1998;115:988–996. doi: 10.1016/s0016-5085(98)70271-9. [DOI] [PubMed] [Google Scholar]
- 25.Matozaki T, Goke B, Tsunoda Y, Rodriguez M, Martinez J, Williams J A. J Biol Chem. 1990;265:6247–6254. [PubMed] [Google Scholar]
- 26.Cancela J M, Gerasimenko O V, Gerasimenko J V, Tepikin A V, Petersen O H. EMBO J. 2000;19:2549–2557. doi: 10.1093/emboj/19.11.2549. [DOI] [PMC free article] [PubMed] [Google Scholar]
- 27.Yoo S H, Albanesi J P. J Biol Chem. 1990;265:13446–13448. [PubMed] [Google Scholar]
- 28.Yoo S H, So S H, Kweon H S, Lee J S, Kang M K, Jeon C J. J Biol Chem. 2000;275:12553–12559. doi: 10.1074/jbc.275.17.12553. [DOI] [PubMed] [Google Scholar]
- 29.Nguyen T, Chin W-C, Verdugo P. Nature (London) 1998;395:908–912. doi: 10.1038/27686. [DOI] [PubMed] [Google Scholar]
- 30.Camello C, Pariente J A, Salido G M, Camello P. Curr Biol. 2000;10:161–164. doi: 10.1016/s0960-9822(00)00313-4. [DOI] [PubMed] [Google Scholar]
- 31.Lebel D, Grondin G, Paquette J. Biol Cell. 1988;63:343–353. [PubMed] [Google Scholar]
- 32.Nicaise G, Maggio K, Thirion S, Horoyan M, Keicher E. Biol Cell. 1992;75:89–99. doi: 10.1016/0248-4900(92)90128-n. [DOI] [PubMed] [Google Scholar]
- 33.Leblond F A, Viau G, Laine J, Lebel D. Biochem J. 1993;291:289–296. doi: 10.1042/bj2910289. [DOI] [PMC free article] [PubMed] [Google Scholar]
- 34.Sasaki S, Nakagaki I, Kondo H, Hori S. Pflügers Arch. 1996;432:538–545. doi: 10.1007/s004240050167. [DOI] [PubMed] [Google Scholar]
- 35.Thevenod F, Hildebrandt J P, Striessnig J, DeJonge H R, Schulz I. J Biol Chem. 1996;271:3300–3305. doi: 10.1074/jbc.271.6.3300. [DOI] [PubMed] [Google Scholar]
- 36.Braun M, Thevenod F. Mol Pharmacol. 2000;57:308–316. [PubMed] [Google Scholar]
- 37.Dartsch H, Kleene R, Kern H E. Eur J Cell Biol. 1998;75:211–222. doi: 10.1016/S0171-9335(98)80115-5. [DOI] [PubMed] [Google Scholar]
- 38.Kloppel G. In: Acute Pancreatitis: Diagnosis and Therapy. Bradley E L III, editor. New York: Raven; 1994. pp. 35–45. [Google Scholar]
- 39.Neoptolemos J P, Kemppainen E, Mayer J M, Fitzpatrick J M, Raraty M G T, Slavin J, Beger H-G, Hietaranta A J, Puolakkainen P A. Lancet. 2000;355:1955–1960. doi: 10.1016/s0140-6736(00)02327-8. [DOI] [PubMed] [Google Scholar]
- 40.Gorry M C, Gabbaizedeh D, Furey W, Gates L K, Preston R A, Aston C E, Zhang Y Z, Ulrich C, Ehrlich G D, Whitcomb D C. Gastroenterology. 1997;113:1063–1068. doi: 10.1053/gast.1997.v113.pm9322498. [DOI] [PubMed] [Google Scholar]
- 41.Whitcomb D C, Gorry M C, Preston R A, Furey W, Sossenheimer M J, Ulrich C D, Martin S P, Gates L K, Amann S T, Toskes P P, et al. Nat Genet. 1996;14:141–145. doi: 10.1038/ng1096-141. [DOI] [PubMed] [Google Scholar]
- 42.Ward J B, Petersen O H, Jenkins S A, Sutton R. Lancet. 1995;346:1016–1019. doi: 10.1016/s0140-6736(95)91695-4. [DOI] [PubMed] [Google Scholar]
- 43.Ward J B, Sutton R, Jenkins S A, Petersen O H. Gastroenterology. 1996;111:481–491. doi: 10.1053/gast.1996.v111.pm8690215. [DOI] [PubMed] [Google Scholar]
- 44.Parekh A, Penner R. Physiol Rev. 1997;77:901–930. doi: 10.1152/physrev.1997.77.4.901. [DOI] [PubMed] [Google Scholar]


