

Abstract
Accumulating evidence suggests a link between lead exposure and memory impairment but assessments based on predictive and validated measures are lacking. We conducted a pilot study of 47 healthy subjects 55-67 years of age to examine associations between bone lead levels and 4 tests sensitive to the natural history of Mild Cognitive Impairment (MCI) and Alzheimer's disease (AD). These include 3 subtests of the Cambridge Neuropsychological Test Automated Battery (delayed match-to-sample, paired associates learning and spatial recognition memory) and the Montreal Cognitive Assessment Test. Bone lead concentrations were measured at the mid-shaft of the tibia and the calcaneus with K X-ray fluorescence. Higher tibial and calcaneal bone lead values were significantly (p<0.05) associated with lower performance levels on delayed match-to-sample and paired associates learning in unadjusted analyses with Spearman rank correlation coefficients of about 0.4. Multiple linear regression analyses (i.e., least-squares means of cognitive test scores across tertiles of lead exposure) adjusted for age, education and smoking status continued to show an association of higher calcaneal lead levels with increasing memory impairments on delayed match-to-sample (p=0.07). As might be expected, additional adjustment for history of hypertension reduced the strength of this association (p=0.19). Given the demonstrated impact of lead exposure on hypertension and the vascular etiology of certain dementias, we speculate that hypertension could play a mediating role in the association between lead exposure and memory impairment.
Keywords: aging, bone lead, memory disorders, mild cognitive impairment, epidemiology, K-XRF
Introduction
Dementias are a group of diseases characterized by the impaired ability to learn new information or recall previously learned information, and one or more cognitive disturbances in either the ability to generate coherent speech or understand language (aphasia), the ability to carry out motor activities despite intact motor function (apraxia), the ability to recognize or identify objects despite intact sensory function (agnosia), or the ability to carry out complex tasks (e.g., planning, organizing) (Alzheimer's Association 2008, Chertkow 2008). Mild cognitive impairment (MCI), also known as cognitive impairment without dementia, is a concept that is increasingly being used to describe older individuals whose performance on tests of memory and cognitive functioning is below what would be considered normal for according to the individual's age, but whose condition does not meet the criteria for dementia (Chertkow et al., 2008). Nevertheless, MCI is considered to be a high-risk state for developing dementia with about 50% of MCI patients progressing to dementia (Chertkow et al., 2008).
Most cases of dementia and MCI are sporadic, meaning that the etiology is unknown. (Chertkow 2008, Patterson et al., 2008). However, several lines of evidence have now suggested that environmental exposures to lead may play an important role. A recent study of cumulative environmental lead and cognitive function in adult men from the Normative Aging Study reported that the degree of performance impairment over time, particularly in visuospatial and visuomotor domains, increased with increasing bone lead concentration, a marker of cumulative exposure (Weisskopf et al., 2007). Additionally, bone lead has been associated, both in longitudinal and cross-sectional studies, with reduced scores on the Mini Mental Status Exam (Weisskopf et al., 2004, Wright et al., 2003). A study of elderly women reported inverse associations between some measures of behavior, including reaction time, digit symbol and trailmaking, with blood lead levels (Muldoon et al., 1996). Most recently, Weuve and colleages in a longitudinal community study of older women reported an adverse impact of cumulative lead exposure using generalized estimating equations of 8 cognitive tests (Weuve et al., in press). Adjustment for potential vascular and mental health intermediates did not change their results (Weuve et al., in press). Intriguingly, recent animal studies report that early developmental lead exposures in rodents resulted in an age-related elevation in APP protein and its amyloidogenic Aβ product, markers of Alzheimer's disease (AD) (Basha et al., 2005a, Basha et al., 2005b, Bolin et al., 2006) and over-expression of the β-amyloid protein precursor gene 20 months after exposure had ceased. Subsequent studies in non-human primates that were exposed to lead beginning in development have shown similar effects (Wu et al., 2008a). Furthermore, lead may be indirectly linked to dementia through its demonstrated effect on the risk of hypertension (Navas-Acien et al., 2007, Vaziri 2008, Vaziri and Gonick 2008), a risk factor considered to play an important role in the development of dementia (Chertkow 2008, Patterson et al., 2008). In addition, lead could act on neurotransmitter systems, such as the acetylcholine system known to be compromised in AD (Reddy et al., 2007, Wang et al., 2007)
One limitation of the current understanding of the potential risk posed by lead exposure for dementias or MCI is the lack of information on the specific behavioral profile with which lead may be associated. In particular, it is unknown whether lead exposure reproduces the specific behavioral deficits, many of which can also be directly evaluated in experimental animal models, that have proven to be predictive of dementias in human populations. We conducted a pilot study, therefore, to obtain a preliminary estimate of the association between lead exposure and memory impairment using biological markers of chronic exposure and validated and clinically relevant behavioral measures sensitive to the natural history of MCI and dementias.
Methods
Study Population
In 2008, we conducted a cross-sectional pilot study of men and women between the ages 55 and 67 residing in the Rochester, NY region. Our study built upon an ongoing study evaluating the association between lead exposure and bone mineral density in children, adolescents and older adults (NIEHS PO1 ES 011854; unpublished data). The adult participants were recruited from an Occupational Medicine clinic, and those responding to the informational flyers distributed to the public and newspaper advertisement. These sources were selected to recruit individuals with probable high and probable low exposures to lead to obtain variability in the exposure measure. Information on study eligibility was obtained from consenting individuals via a telephone screening interview. Persons were excluded from the study if they had certain medical conditions associated with osteoporosis (e.g., hypogonadal states; arthritis; certain endocrine, nutritional and gastrointestinal disorders), or used certain medications that affect bone density (e.g., hormone-replacement therapy; glucocorticoids; cyclosporine; anticonvulsants; biphosphanates). Individuals were also questioned about height and weight during the telephone screening. Those who reported a height and weight corresponding to a body-mass index (BMI) above 32 kg/m2 were excluded due to concerns about the potential impact of high BMI on the accuracy of the bone lead assessment. Nevertheless, six participants, who reported lower weights at the time of screening, were found actually to have weights corresponding to a BMI above 32 kg/m2 at study visit; these individuals were not excluded from our current analysis.
For our pilot study, we re-contacted those adults who participated in the previous study to inquire about their interest to participate in an additional cognitive assessment; $25 was offered for their time. Of the 68 adults contacted, 47 (69 percent) agreed to participate in our pilot study. We obtained information on bone lead levels (from the original bone mineral density study); demographic, medical and behavioral factors (from questionnaires used in either the original study or our pilot study); and cognitive measures (from our pilot study).
This study was approved by the University of Rochester Research Subjects Review Board.
Cognitive Measures
We evaluated the association between lead exposure and memory impairment using validated and behaviorally-based measures. Three specific tests in the Cambridge Neuropsychological Test Automated Battery (CANTAB) collection were used to obtain additional and direct measures of memory deficits. They were chosen based on the prior study of Egerhazi and colleagues demonstrating that people with AD score significantly worse on these CANTAB subtests (Egerhazi et al., 2007). CANTAB has been used to study learning and memory in humans, non-human primates and rodents (Robbins et al., 1994). Thus, such tests have particular advantages for backward and forward translational research because of the ability to implement them across a range of experimental species. In addition, MCI was measured using the Montreal Cognitive Assessment (MoCA), which is a validated instrument with a sensitivity of 90% and a specificity of 87% (Nasreddine et al., 2005). MCI is a diagnosable entity and a high-risk state for progression to AD.
A trained technician asked participants to perform a series of 3 computerized neuropsychological tests of the CANTAB. In brief, subjects seated about 0.5 m from a touch-screen monitor receive an explanation of test procedures and are subsequently instructed to complete a simple task (touching the center point of flashing crosses on the screen) prior to initiating the 3 tests. Participants were given the tests in the following order: delayed matching-to-sample (DMS), paired associate learning (PAL) and then spatial recognition memory (SRM). These tests have been associated with AD and/or MCI (Barbeau et al., 2004, Egerhazi et al., 2007, Iddon et al., 1999).
In DMS, the subject is first shown a complex visual pattern (the sample) and then, after one of four time delays, which vary across trials, four patterns are displayed, one of which is the same as the sample presented prior to the delay. A correct response is choosing the pattern which exactly matches the sample. In the PAL subtest, boxes are displayed on the screen and are opened one at a time in a randomized order. One or more of them will contain a pattern. The patterns are then displayed in the middle of the screen, one at a time, and the subject must touch the box where the pattern was originally located. If the subject makes an error, the patterns are re-presented to remind the subject of their locations. The number of patterns increases from one to eight across the course of the test. One participant was excluded from statistical analysis of PAL because this person was color blind. In SRM, the subject is presented with a white square, which appears in sequence at five different locations on the screen. In the recognition phase, the subject sees a series of five pairs of squares, one of which is in a place previously seen in the presentation phase. The other square is in a location not seen in the presentation phase. The correct response is to touch the box located in the previously seen location. The total time for administering these three tests was about 20 minutes.
This was followed by administration of the MoCA, a one-page 30-point test administered in 10 minutes (Nasreddine et al., 2005, Smith et al., 2007). The short-term memory recall task involves two learning trials of five nouns and delayed recall after approximately 5 minutes. The clock-drawing task and a three-dimensional cube copy are used to assess visuospatial abilities. Tests of executive function include an adaptation of the Trail Making B task, a phonemic fluency task, and a two-item verbal abstraction task. A sustained attention task, serial subtraction task and digits forward and backward are tests to evaluate attention, concentration, and working memory. Language is assessed using a three-item confrontation task, repetition of two syntactically complex sentences, and the fluency task described above. Orientation to place and time is also evaluated. We obtained written permission from the developer to use the MoCA for research. MoCA scores were analyzed as a continuous variable as well as a dichotomous variable using a cut-off score of 26, a score below which an individual is considered to have MCI.
Lead Exposure
Bone lead concentrations were measured at the mid-shaft of the tibia and at the calcaneus for 30 minutes each with K-XRF using 200 mCi 109Cd radioactive source. A K-XRF cortical bone lead level, such as the mid-shaft of the tibia, is the most valid measure of cumulative lead exposure over a period of decades (Christoffersson et al., 1984, Gerhardsson et al., 1993, Hu et al., 1990, Hu et al., 1991, Hu et al., 1998, Somervaille et al., 1988), whereas the calcaneus is mostly trabecular bone and has a greater turnover rate (Hu et al., 1996). The K-XRF device was normalized daily prior to patient measurements using lead-acetate/plaster-of-Paris phantoms. Normalization yields a unit of measurement of μg lead per gram of bone mineral, and makes the accuracy of the measurement insensitive to variations in bone shape, size, and density, to overlying tissue thickness, and to minor subject movement (Aro et al., 2000). The instrument also provides an estimate of uncertainty associated with each measurement. In our study, several negative lead values were obtained which occurs because the K-XRF device provides a continuous point estimate that fluctuates around the true bone lead value. Therefore, the measurement may yield negative lead concentrations when the true bone lead value is close to zero (Perlstein et al., 2007). As has been reported elsewhere, negative values were particularly common for tibia lead (31.9% had values that were less than zero). A smaller proportion of calcaneal levels had negative values (12.8%). In sensitivity analyses, we evaluated the impact of including negative point estimates on our findings (see Statistical Analysis).
Covariates
The following variables were considered potential confounders due to their potential correlation with either lead exposure or performance on the cognitive tests: age (continuous), gender (men, women), education level (some college or less, college graduate or more), history of hypertension (yes, no), BMI from measured height and weight (<25, 25-29.9, 30+), smoking status (ever, never), alcohol use in the past 30 days (<15 days with 1 drink or more, 15+ days with 1 drink or more), history of occupational solvent exposure (yes, no), and medication use for hypertension, depression/anxiety, and allergies (yes, no).
Other covariates with a limited variability in the data (i.e., less than 10 individuals in any given group of a categorical variable) were not further considered due to their limited contribution to statistical inference, including selected aspects of diet and physical activity, medical and reproductive history, and selected occupational exposures.
Statistical Analysis
Initially, we performed a descriptive univariate analysis to describe the study population of 47 participants in terms of bone lead levels, cognitive measures, and selected covariates. Indexes of central tendency included means and medians for continuous measures, and proportions for nominal and ordinal variables. In addition, we report the standard deviation for continuous variables as a measure of variability in the data.
Subsequently, we performed a series of bivariate analyses to evaluate the association between bone lead levels and cognitive test scores. Our analyses primarily relied on non-parametric tests of bivariate associations due to the non-normal distribution of lead concentrations and the presence of negative lead concentrations. Spearman rank correlations (and p-values) assessed the relationship between continuous bone lead concentrations and continuous CANTAB and MoCA scores. Additionally, average bone lead levels were compared between those who perform better (≥ median test score for CANTAB, and ≥26 for MoCA) and worse (< median test score for CANTAB and <26 for MoCA) on the cognitive tests. Average bone lead concentrations between groups were compared using t-tests (parametric) and continuity-corrected Wilcoxon-Mann-Whitney test (non-parametric; Normal approximation).
Some have excluded bone lead levels measured with high uncertainty estimates from statistical analysis, i.e., greater than 10 μg/g tibia bone and 15 μg/g trabecular bone (Rajan et al., 2008). None of the tibia values in our study would be excluded based on high uncertainty estimates, but three calcaneal lead levels (two of which were most negative of all levels, and one of which was positive but in the lowest tertile) would be excluded. Using a slightly different approach, we investigated the impact of negative lead concentrations on the consistency of our findings by reporting bivariate associations after either including, as suggested previously (Kim et al., 1995, Theppeang et al., 2008), or excluding negative values from the analyses.
Finally, we conducted multiple linear regression analyses for cognitive tests showing consistent statistically significant associations (p<0.10 due to this study's small sample size) across both types of bone in the bivariate analyses: DMS (% correct all delays; % correct 12 s delay) and PAL (total errors adjusted, total trials adjusted). After evaluating the assumption of normality of residuals, we took the natural logarithm of the PAL scores; the assumption was not violated for DMS. To accommodate the negative lead values in linear regression without excluding them we categorized bone lead levels into three groups based on tertiles of the exposure distribution. This appears appropriate as negative lead levels are likely to represent true bone lead concentrations that are close to zero (Theppeang et al., 2008). Within-group least-squares means of cognitive test scores across levels of bone lead concentration, and p-values for the comparison with the lowest lead tertile, were calculated based on three linear regression models: no adjustment for covariates; adjustment for age, education, and smoking status; and controlling for hypertension in addition to these three covariates. These covariates were selected due to their apparent association with both exposure and outcome in bivariate analyses. We fit separate multiple linear regression models for each cognitive test and lead biomarker.
All tests of significance were two-sided. Analyses were conducting using SAS version 9.1 (SAS Institute, Cary, NC).
Results
Ten of 47 participants had MoCA scores below 26 indicating a 21% prevalence of MCI. Table 1 shows the demographic, medical, behavioral and exposure characteristics of our study population and their relationship with cognitive tests scores and bone lead levels. Average bone lead levels in our population were quite low with 6.1 μg/g calcaneal bone and 2.0 μg/g tibial bone. The average age of our population was just over 61 years of age. Most were women, and most were highly educated. About one third has a history of hypertension, and two thirds were overweight or obese. Half of the population ever smoked and about one quarter regularly drank alcohol in the past 30 days. Approximately one third took medication for hypertension, depression/anxiety, or allergies.
Table 1.
Characteristics of the study population
| Variable† | N | % (mean; median; SD) | Calcaneus‡ | Tibia‡ | MoCA‡ | DMS % correct all delays‡ | PAL Total errors adjusted‡* | SRM % correct‡ | ||
|---|---|---|---|---|---|---|---|---|---|---|
| Demographics | ||||||||||
| Age (range: 55-67) | 47 | 61.55; 61.0; 3.0 | 6.1; 6.6; 8.5 | 2.0; 2.6; 5.2 | 26.9; 27.0; 1.9 | 85.0; 86.7; 7.8 | 20.2; 14.5; 22.0 | 83.6; 85.0; 7.5 | ||
| Gender | ||||||||||
| Men | 18 | 38.3 | 6.6; 6.5; 7.6 | 3.8; 4.7; 5.9 | 26.7; 27.0; 2.0 | 83.9; 83.3; 8.1 | 25.7; 15.0; 29.0 | 84.7; 85.0; 6.1 | ||
| Women | 29 | 61.7 | 5.8; 6.6; 9.1 | 0.9; 1.6; 4.5 | 27.0; 27.0; 1.9 | 85.7; 86.7; 7.7 | 17.0; 11.0; 16.3 | 82.9; 85.0; 8.3 | ||
| Education | ||||||||||
| Some college or less | 17 | 36.2 | 6.9; 7.5; 8.9 | 3.2; 4.0; 5.3 | 26.1; 27.0; 2.1 | 83.5; 80.0; 9.6 | 27.2; 21.0; 27.3 | 82.4; 85.0; 8.3 | ||
| College graduate or | 30 | 63.8 | 5.6; 5.8; 8.3 | 1.4; 2.2; 5.1 | 27.3; 27.0; 1.7 | 85.9; 86.7; 6.6 | 16.1; 10.0; 17.4 | 84.3; 85.0; 7.0 | ||
| more | ||||||||||
| Medical History | ||||||||||
| Hypertension | ||||||||||
| No | 32 | 68.1 | 4.6; 6.0; 9.4 | 1.3; 1.8; 5.6 | 27.4; 27.5; 1.6 | 87.2; 88.3; 7.4 | 17.0; 11.5; 16.5 | 83.3; 82.5; 6.0 | ||
| Yes | 15 | 31.9 | 9.2; 9.9; 4.7 | 3.7; 4.0; 3.9 | 25.8; 26.0; 2.0 | 80.4; 80.0; 6.9 | 27.7; 21.5; 30.6 | 84.3; 85.0; 10.2 | ||
| Body Mass Index | ||||||||||
| <25 | 16 | 34.0 | 7.9; 7.8; 6.7 | 4.4; 3.8; 4.3 | 26.7; 26.5; 1.5 | 84.2; 85.0; 8.6 | 21.9; 16.0; 21.8 | 82.5; 82.5; 8.8 | ||
| 25-29.9 | 18 | 38.3 | 3.6; 5.4; 10.9 | 0.4; 1.1; 5.7 | 27.2; 27.5; 2.3 | 85.6; 86.7; 7.9 | 21.2; 12.0; 28.4 | 83.1; 82.5; 6.4 | ||
| 30+ | 13 | 27.7 | 7.7; 9.3; 5.5 | 1.4; 0.5; 4.8 | 26.8; 27.0; 1.9 | 85.4; 83.3; 7.1 | 17.1; 16.0; 9.9 | 85.8; 85.0; 7.3 | ||
| Exposures | ||||||||||
| Smoking Status | ||||||||||
| Never | 24 | 51.1 | 4.1; 6.2; 10.4 | 1.7; 3.0; 5.4 | 27.3; 28.0; 1.9 | 85.1; 83.3; 7.3 | 15.8; 10.0; 16.8 | 83.8; 85.0; 8.8 | ||
| Ever | 23 | 48.9 | 8.1; 7.5; 5.3 | 2.4; 1.8; 5.1 | 26.5; 26.0; 1.9 | 84.9; 86.7; 8.5 | 25.0; 21.0; 26.0 | 83.5; 85.0; 6.1 | ||
| Alcohol Use (past 30 days) | ||||||||||
| <15 days with ≥1 drink | 34 | 72.3 | 5.8; 6.6; 9.0 | 1.4; 2.1; 5.2 | 26.8; 27.0; 2.0 | 85.1; 85.0; 7.2 | 18.7; 11.5; 23.6 | 82.9; 85.0; 8.3 | ||
| 15+ days with ≥1 drink | 13 | 27.7 | 6.7; 4.6; 7.0 | 3.7; 3.3; 4.9 | 27.2; 27.0; 1.6 | 84.9; 86.7; 9.6 | 24.5; 22.0; 16.6 | 85.4; 85.0; 4.8 | ||
| Occupational Solvents | ||||||||||
| No | 36 | 76.6 | 5.4; 6.2; 9.0 | 1.3; 1.7; 5.0 | 26.8; 27.0; 2.0 | 84.4; 83.3; 8.0 | 19.5; 14.0; 21.6 | 83.8; 85.0; 7.7 | ||
| Yes | 11 | 23.4 | 8.2; 6.6; 6.1 | 4.6; 4.0; 5.4 | 27.1; 27.0; 1.4 | 87.0; 90.0; 7.4 | 22.5; 15.0; 24.1 | 83.2; 80.0; 7.2 | ||
| Medication | ||||||||||
| Hypertension | ||||||||||
| No | 34 | 72.3 | 5.2; 6.5; 9.4 | 1.4; 1.8; 5.6 | 27.2; 27.0; 1.8 | 86.4; 86.7; 7.9 | 20.4; 13.5; 24.4 | 82.2; 80.0; 7.4 | ||
| Yes | 13 | 27.7 | 8.4; 9.3; 4.5 | 3.7; 4.0; 3.5 | 26.2; 26.0; 2.0 | 81.5; 83.3; 6.8 | 19.8; 18.5; 13.9 | 87.3; 90.0; 6.7 | ||
| Depression or anxiety | ||||||||||
| No | 32 | 68.1 | 6.8; 6.5; 6.6 | 2.4; 2.5; 5.2 | 27.1; 27.0; 1.8 | 85.5; 86.7; 7.8 | 19.7; 14.0; 22.3 | 83.8; 85.0; 6.6 | ||
| Yes | 15 | 31.9 | 4.6; 6.6; 11.5 | 1.3; 3.2; 5.2 | 26.4; 26.0; 2.2 | 84.0; 83.3; 8.0 | 21.3; 16.0; 22.1 | 83.3; 85.0; 9.4 | ||
| Allergies | ||||||||||
| No | 32 | 68.1 | 6.6; 6.9; 6.4 | 1.1; 1.8; 4.1 | 26.8; 27.0; 2.0 | 85.8; 86.7; 8.3 | 18.7; 12.0; 22.8 | 83.9; 85.0; 6.2 | ||
| Yes | 15 | 31.9 | 5.0; 5.4; 12.0 | 4.1; 3.6; 6.7 | 27.2; 27.0; 1.6 | 83.3; 80.0; 6.5 | 23.5; 16.0; 20.5 | 83.0; 85.0; 10.0 | ||
Limited to variables with at least 10 observations in a category
Mean, median, standard deviation
Excluding one colorblind participant who did not complete the PAL portion of the CANTAB
Bone lead levels appeared to be consistently higher in persons with lower education levels, and individuals with a history of hypertension, smoking, and occupational solvent exposure (Table 1). Participants appeared to score worse on the cognitive tests if they had lower education levels or a history of hypertension, and to a lesser extent if they were men, ever smoked (for PAL) or took medication for depression/anxiety or allergies. PAL scores were more strongly associated with covariates, whereas SRM showed little association with any of these factors.
Spearman rank correlation coefficients for the association between bone lead concentrations and cognitive tests scores are presented in Table 2. When all data were used, both calcaneal and tibial lead showed statistically significant correlations. DMS was related to calcaneal lead, with some suggestion of a positive dose-response with increasing delay. Notably, significant correlations (both calcaneal and tibial lead even with negative values excluded) were consistently observed for the 12 second or longest delay value used (Figure 1), consistent with memory impairment, and occurred in the absence of any changes in latency that might have suggested some motivational basis for memory effects.
Table 2.
Spearman rank correlations (p-value) of Cambridge Neuropsychological Test Automated Battery (CANTAB) measures and Montreal Cognitive Assessment (MoCA) scores with bone lead levels
| Cognitive Test | Mean | (Stdev; Median) | Calcaneus | Tibia | ||
|---|---|---|---|---|---|---|
| All (n=47) | Excluding negative values (n=41) | All (n=47) | Excluding negative values (n=32) | |||
| MoCA | 26.89 | (27.00; 1.91) | -0.23 (0.12) | -0.089 (0.58) | -0.26 (0.072) | -0.059 (0.75) |
| Delayed Matching-to-Sample | ||||||
| Percent correct all delays | 85.04 | (86.67; 7.83) | -0.39 (0.0061) | -0.40 (0.0088) | -0.18 (0.22) | -0.43 (0.013) |
| Percent correct 0 s delay | 86.38 | (90.00; 11.50) | -0.15 (0.31) | -0.27 (0.094) | 0.019 (0.90) | -0.22 (0.22) |
| Percent correct 4 s delay | 85.74 | (90.00; 11.37) | -0.32 (0.029) | -0.21 (0.18) | -0.094 (0.53) | -0.24 (0.18) |
| Percent correct 12 s delay | 82.98 | (80.00; 12.14) | -0.40 (0.0054) | -0.34 (0.031) | -0.32 (0.031) | -0.42 (0.018) |
| Mean correct latency | 3965 | (3690; 1203) | -0.029 (0.85) | 0.057 (0.73) | -0.012 (0.93) | 0.10 (0.58) |
| Mean correct latency 12 s delay | 5023 | (4539; 1710) | -0.079 (0.60) | -0.0033 (0.98) | 0.022 (0.88) | 0.21 (0.24) |
| Paired Associate Learning* | ||||||
| Total errors adjusted | 20.24 | (14.50; 21.97) | 0.29 (0.051) | 0.28 (0.082) | 0.19 (0.21) | 0.42 (0.018) |
| Total errors 8 shapes adjusted | 12.67 | (7.00; 14.49) | 0.22 (0.14) | 0.18 (0.26) | 0.21 (0.15) | 0.43 (0.016) |
| Total trials adjusted | 14.32 | (12.50; 4.63) | 0.27 (0.066) | 0.30 (0.064) | 0.23 (0.13) | 0.41 (0.021) |
| Stages completed | 7.91 | (8.00; 0.35) | -0.41 (0.0050) | -0.43 (0.0056) | -0.067 (0.66) | -0.19 (0.30) |
| Stages completed on first trial | 5.72 | (6.00; 0.98) | -0.26 (0.085) | -0.35 (0.027) | -0.14 (0.37) | -0.28 (0.13) |
| Spatial Recognition Memory | ||||||
| Percent correct | 83.62 | (85.00; 7.50) | -0.28 (0.057) | -0.24 (0.13) | 0.18 (0.23) | 0.067 (0.71) |
| Mean correct latency – block 1 | 3712 | (3293; 1739) | -0.21 (0.15) | -0.063 (0.69) | -0.38 (0.0086) | -0.21 (0.25) |
| Mean correct latency – block 2 | 2436 | (2239; 773.59) | -0.16 (0.28) | -0.080 (0.62) | -0.12 (0.42) | 0.093 (0.61) |
Excluding one colorblind participant who did not complete the PAL portion of the CANTAB
Figure 1.
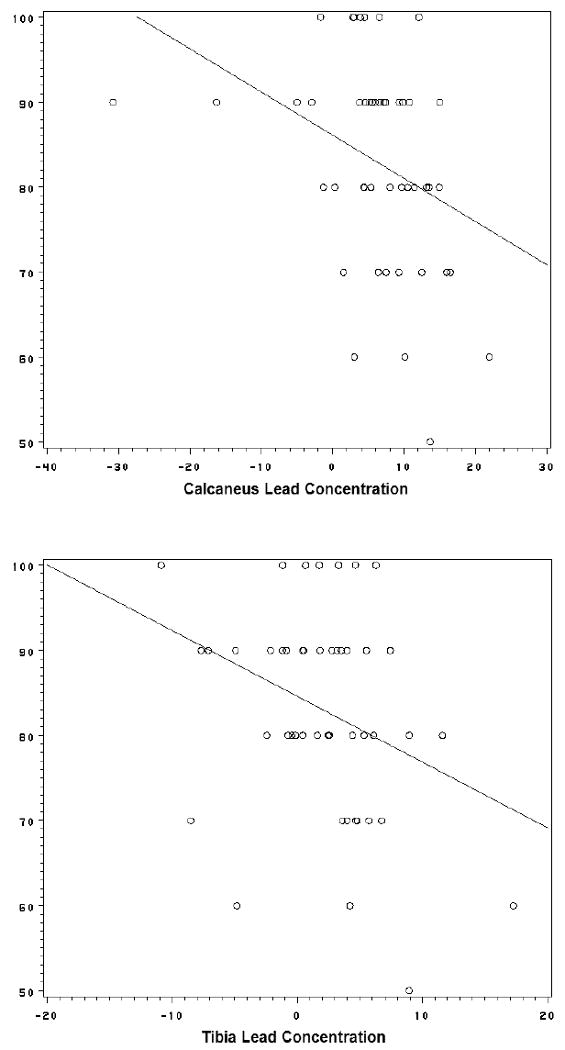
Scatter plot of Delayed Matching-to-Sample (Percent Correct, 12 second Delay subtest) in relation to calcaneus (top) and tibia (bottom) bone lead concentrations with crude linear regression slope (DMS = 86.0723 - 0.508425*CALCANEUS and DMS = 84.55502 - 0.772652*TIBIA, respectively)
Furthermore, the PAL stages completed subtest showed a correlation with calcaneal lead levels. Omission of negative lead values did not greatly impact correlations for calcaneal lead, but substantially increased correlations coefficients for the association between PAL (total errors adjusted, total errors 8 shapes adjusted, and total trials adjusted) and tibial lead.
Similar patterns were found when average calcaneal lead values among those whose test score was lower than the median in our population (or had MCI) were compared to persons with test scores higher than the median (or did not have MCI; Table 3). That is, calcaneal lead levels were statistically significantly (p<0.10) greater among participants who scored worse on the cognitive tests, in particular for DMS and PAL. Excluding negative lead values did not greatly impact these findings. Tibial lead did not show clear relationships with cognitive test performance, and tests with statistically significant associations showed an inverse pattern, i.e., those who did better on the tests had higher lead levels (Table 3). Nevertheless, after excluding negative tibial lead values DMS showed results similar to calcaneal lead. Parametric and non-parametric significance tests showed similar results.
Table 3.
Average (SD; n) bone lead levels among those who perform better (≥ median test score) and worse (< median test score) on neurological tests and two-sided tests of statistical significance
| Cognitive Test | Calcaneus | Tibia | ||||||
|---|---|---|---|---|---|---|---|---|
| Test Score < median | Test Score ≥ median | p-value | p-value** | Test Score < median | Test Score ≥ median | p-value | p-value** | |
| Including negative bone lead concentrations | ||||||||
| MoCA† | 10.57 (6.48;10) | 4.87 (8.58;37) | 0.058 | 0.071 | 3.79 (6.25;10) | 1.57 (4.86;37) | 0.23 | 0.43 |
| Delayed Matching-to-Sample | ||||||||
| Percent correct all delays | 8.22 (6.09;29) | 2.65 (10.58;18) | 0.053* | 0.043 | 2.72 (5.76;29) | 0.94 (4.05;18) | 0.26 | 0.19 |
| Percent correct 0 s delay | 7.25 (5.90;16) | 5.48 (9.54;31) | 0.50 | 0.61 | 1.44 (5.61;16) | 2.35 (5.04;31) | 0.57 | 0.97 |
| Percent correct 4 s delay | 9.25 (5.97;21) | 3.53 (9.36;26) | 0.015 | 0.025 | 2.92 (5.46;21) | 1.33 (4.97;26) | 0.30 | 0.41 |
| Percent correct 12 s delay | 10.79 (6.12;11) | 4.65 (8.61;36) | 0.033 | 0.026 | 4.25 (6.67;11) | 1.37 (4.56;36) | 0.11 | 0.049 |
| Mean correct latency | 7.34 (5.65;24) | 4.78 (10.60;23) | 0.31* | 0.94 | 2.53 (5.96;24) | 1.53 (4.34;23) | 0.51 | 0.60 |
| Mean correct latency 12 s delay | 6.26 (4.65;23) | 5.92 (11.05;24) | 0.89* | 0.35 | 1.43 (4.91;23) | 2.62 (5.50;24) | 0.44 | 0.46 |
| Paired Associate Learning | ||||||||
| Total errors adjusted | 3.56 (9.84;23) | 8.29 (6.19;23) | 0.059* | 0.15 | 0.61 (5.32;23) | 3.29 (4.86;23) | 0.082 | 0.15 |
| Total errors 8 shapes adjusted | 3.44 (10.04;22) | 8.20 (6.08;24) | 0.063* | 0.17 | 1.38 (5.03;22) | 2.48 (5.43;24) | 0.48 | 0.62 |
| Total trials adjusted | 3.60 (9.79;23) | 8.24 (6.30;23) | 0.064* | 0.22 | -0.08 (4.88;23) | 3.98 (4.82;23) | 0.0068 | 0.027 |
| Stages completed | 17.64 (3.77;3) | 5.11 (8.11;43) | 0.012 | 0.00092ˆ | 6.15 (10.08;3) | 1.66 (4.79;43) | 0.52* | 0.64ˆ |
| Stages completed on first trial | 9.41 (6.93;15) | 4.24 (8.73;31) | 0.051 | 0.046 | 3.45 (6.05;15) | 1.22 (2.95;31) | 0.18 | 0.20 |
| Spatial Recognition Memory | ||||||||
| Percent correct | 7.70 (5.79;21) | 4.78 (10.03;26) | 0.22* | 0.33 | 0.53 (4.78;21) | 3.26 (5.29;26) | 0.073 | 0.067 |
| Mean correct latency – block 1 | 7.09 (9.15;23) | 5.12 (7.79;24) | 0.43 | 0.078 | 2.92 (4.41;23) | 1.20 (5.82;24) | 0.26 | 0.062 |
| Mean correct latency – block 2 | 7.03 (9.33;23) | 5.18 (7.60;24) | 0.46 | 0.10 | 2.25 (4.85;23) | 1.84 (5.61;24) | 0.79 | 0.29 |
| Excluding negative bone lead concentrations | ||||||||
| MoCA† | 10.57 (6.48;10) | 7.68 (3.89;31) | 0.21* | 0.23ˆ | 6.61 (5.16;7) | 4.13 (2.77;25) | 0.26* | 0.22ˆ |
| Delayed Matching-to-Sample | ||||||||
| Percent correct all delays | 9.52 (4.92;26) | 6.42 (3.76;15) | 0.042 | 0.047 | 5.68 (3.86;20) | 3.00 (1.93;12) | 0.014* | 0.028 |
| Percent correct 0 s delay | 8.85 (4.24;14) | 8.15 (5.03;27) | 0.66 | 0.55 | 5.12 (2.39;10) | 4.47 (3.92;22) | 0.64 | 0.19 |
| Percent correct 4 s delay | 9.86 (5.41;20) | 6.98 (3.56;21) | 0.050 | 0.093 | 5.73 (4.13;14) | 3.85 (2.74;18) | 0.13 | 0.14 |
| Percent correct 12 s delay | 10.79 (6.12;11) | 7.50 (3.87;30) | 0.047 | 0.10 | 6.67 (4.30;9) | 3.89 (2.85;23) | 0.041 | 0.031ˆ |
| Mean correct latency | 7.94 (5.03;21) | 8.86 (4.47;20) | 0.54 | 0.32 | 5.01 (4.33;16) | 4.34 (2.48;16) | 0.60* | 0.95 |
| Mean correct latency 12 s delay | 7.05 (4.01;21) | 9.78 (5.12;20) | 0.064 | 0.074 | 3.83 (3.00;16) | 5.52 (3.82;16) | 0.17 | 0.16 |
| Paired Associate Learning | ||||||||
| Total errors adjusted | 7.11 (3.52;19) | 9.29 (5.47;21) | 0.15 | 0.27 | 3.44 (2.80;16) | 5.90 (3.88;15) | 0.052 | 0.023 |
| Total errors 8 shapes adjusted | 7.17 (3.58;18) | 9.15 (5.39;22) | 0.19 | 0.35 | 3.75 (2.96;16) | 5.56 (3.95;15) | 0.16 | 0.13 |
| Total trials adjusted | 7.17 (3.29;19) | 9.25 (5.61;21) | 0.16* | 0.40 | 2.92 (1.85;15) | 6.22 (4.02;16) | 0.0073 | 0.0068 |
| Stages completed | 17.64 (3.77;3) | 7.50 (3.92;37) | 0.0001 | 0.0014ˆ | 10.43 (9.66;2) | 4.23 (2.74;29) | 0.53 | 0.35ˆ |
| Stages completed on first trial | 10.44 (5.89;14) | 7.08 (3.55;26) | 0.067* | 0.072 | 6.09 (4.51;11) | 3.82 (2.66;20) | 0.15* | 0.12 |
| Spatial Recognition Memory | ||||||||
| Percent correct | 8.93 (4.53;19) | 7.91 (4.95;22) | 0.50 | 0.44 | 3.83 (2.50;12) | 5.18 (3.94;20) | 0.30 | 0.32 |
| Mean correct latency – block 1 | 8.81 (4.05;22) | 7.89 (5.48;19) | 0.54 | 0.29 | 5.54 (2.51;19) | 4.87 (4.68;13) | 0.82* | 0.51 |
| Mean correct latency – block 2 | 8.75 (4.48;22) | 7.97 (5.09;19) | 0.61 | 0.38 | 4.26 (2.47;18) | 5.20 (4.53;14) | 0.49 | 0.95 |
Cut-off for MoCA = 26
T-test with Unequal variance (Satterthwaite)
continuity-corrected Wilcoxon-Mann-Whitney test (non-parametric; Normal approximation) unless noted otherwise; two-sided p-value
Wilcoxon exact test; two-sided p-value
Results highlighted in bold indicate those where both the parametric and non-parametric p-value <0.10
Based on the bivariate associations shown in Tables 2 and 3, we conducted multiple linear regression analyses for DMS and PAL (Table 4). DMS was statistically significantly associated with calcaneal lead exposure in unadjusted analyses, with test scores decreasing with increasing exposure. Adjustment for age, education and smoking status only slightly affected these patterns. Additionally controlling for hypertension history further reduced the association with non-statistically significant p-values. PAL also showed dose-response trends of deteriorating test performance as lead levels increased; however, these trends were not statistically significant. Tibial lead was not associated with DMS or PAL.
Table 4.
Within-group least-squares means of cognitive test scores across levels of bone lead concentration (p-value for comparison with low lead group) adjusted for covariates in multiple linear regression model
| Cognitive Test/Lead concentration | Calcaneus | Tibia | ||||
|---|---|---|---|---|---|---|
| Crude | Adjusted I | Adjusted II | Crude | Adjusted I | Adjusted II | |
| Delayed Matching-to-Sample | ||||||
| Percent correct all delays | ||||||
| Low | 87.56 (ref) | 86.94 (ref) | 85.40 (ref) | 85.42 (ref) | 84.68 (ref) | 83.04 (ref) |
| Medium | 86.67 (0.74) | 86.36 (0.83) | 85.34 (0.98) | 87.08 (0.55) | 86.52 (0.51) | 85.91 (0.28) |
| High | 80.67 (0.014) | 80.85 (0.041) | 80.83 (0.12) | 82.44 (0.29) | 83.07 (0.61) | 81.85 (0.68) |
| Type-III p-value | 0.027 | 0.070 | 0.19 | 0.25 | 0.51 | 0.32 |
| Model R-square | 0.15 | 0.19 | 0.26 | 0.06 | 0.10 | 0.24 |
| Percent correct 12 s delay | ||||||
| Low | 86.67 (ref) | 85.70 (ref) | 83.81 (ref) | 85.63 (ref) | 84.49 (ref) | 82.47 (ref) |
| Medium | 85.29 (0.74) | 84.80 (0.83) | 83.56 (0.95) | 85.00 (0.88) | 84.02 (0.91) | 83.26 (0.85) |
| High | 76.67 (0.022) | 76.81 (0.051) | 76.79 (0.13) | 78.00 (0.082) | 78.84 (0.23) | 77.35 (0.26) |
| Type-III p-value | 0.045 | 0.089 | 0.20 | 0.16 | 0.42 | 0.37 |
| Model R-square | 0.13 | 0.21 | 0.25 | 0.08 | 0.14 | 0.23 |
| Paired Associate Learning* | ||||||
| Total errors adjusted | ||||||
| Low | 2.29 (ref) | 2.36 (ref) | 2.46 (ref) | 2.65 (ref) | 2.74 (ref) | 2.86 (ref) |
| Medium | 2.63 (0.34) | 2.78 (0.23) | 2.84 (0.28) | 2.36 (0.41) | 2.48 (0.46) | 2.53 (0.34) |
| High | 2.81 (0.16) | 2.87 (0.18) | 2.88 (0.28) | 2.73 (0.85) | 2.77 (0.95) | 2.88 (0.95) |
| Type-III p-value | 0.36 | 0.34 | 0.46 | 0.57 | 0.67 | 0.53 |
| Model R-square | 0.05 | 0.18 | 0.20 | 0.03 | 0.15 | 0.20 |
| Total trials adjusted | ||||||
| Low | 2.54 (ref) | 2.56 (ref) | 2.61 (ref) | 2.62 (ref) | 2.64 (ref) | 2.69 (ref) |
| Medium | 2.61 (0.48) | 2.64 (0.37) | 2.68 (0.47) | 2.59 (0.77) | 2.62 (0.81) | 2.64 (0.56) |
| High | 2.72 (0.080) | 2.74 (0.097) | 2.74 (0.21) | 2.66 (0.68) | 2.67 (0.80) | 2.72 (0.81) |
| Type-III p-value | 0.21 | 0.25 | 0.46 | 0.79 | 0.89 | 0.70 |
| Model R-square | 0.07 | 0.22 | 0.28 | 0.01 | 0.17 | 0.27 |
Logtransformed to ensure normal distribution of residuals
I: adjusted for age, smoking status, education
II: adjusted for age, smoking status, education, and hypertension history
Discussion
A growing literature suggests a contributory role for environmental lead exposure in dementias. This pilot study advances that understanding by demonstrating an association between calcaneal lead levels and specific measures of memory impairment that are sensitive to the natural history of MCI and AD (although we did not evaluate AD or other dementias directly). Importantly, changes in DMS were seen at the longer delay values only, where greater memory was required, and occurred in the absence of any changes in latency which is consistent with selective memory impairment rather than a non-specific behavioral deficit.
The exact mechanisms with which lead exposure affects cognition in older adults have yet to be revealed, but several pathways have been proposed such as lead's impact on oxidative stress, neural apoptosis, neurotransmitter storage and release, mitochondrial damage, and hippocampal changes (Shih et al., 2007, Weuve et al., in press, White et al., 2007). Of particular relevance to MCI and dementia is oxidative stress, with higher levels of oxidative stress markers (e.g., isoprostanes, nitrotyrosine, 8-hydroxyguanosine, 8-hydroxyguanine) among patients with MCI and AD (Pratico 2008). Although lead is known to induce oxidative stress (Ahamed and Siddiqui 2007), the relationship of lead exposure with these specific markers of effect is not known. Lead may also affect cognitive function indirectly through its effect on hypertension (Navas-Acien et al., 2007, Vaziri 2008, Vaziri and Gonick 2008), which is increasingly being recognized as a target for the prevention of dementias (Chertkow 2008, Patterson et al., 2008). Lead exposure also directly affects multiple neurotransmitter systems, including acetylcholine, and could result in modifications directly or indirectly through effects on other neurotransmitter systems (Reddy et al., 2007, Wang et al., 2007).
Several recent epidemiological studies have implicated environmental lead exposure as a potential contributor to cognitive and behavioral deficits at older age in the general population (Muldoon et al., 1996, Weisskopf et al., 2007, Weisskopf et al., 2004, Weuve et al., in press, Wright et al., 2003). However, it is not clear how the outcome measures used in these studies relate specifically to the well-documented deficits in dementia and clinically relevant syndromes such as MCI.
In the current study, DMS (a measure of non-spatial memory) and to a lesser extent PAL (a measure of spatial memory) appeared to be associated with calcaneal lead concentrations in a dose-response fashion after controlling for age, educational level, and smoking status. On the other hand, tibial levels showed little association with these cognitive tests. This could suggest that exposures in the recent past are more important than exposures incurred one or two decades ago (Hu et al., 1990, Hu et al., 1996, Hu et al., 1998). This may be contrary to what would be expected if memory impairment represents a prolonged process spanning several decades. For example, age-related decline could be due to cumulative exposure over the lifetime. As suggested by recent animal studies, lead exposure could induce epigenetic effects that predispose to other risk factors for the condition (Wu et al., 2008a, Wu et al., 2008b). On the other hand, recent external exposure or mobilization of stored bone lead may accelerate the normal age-related decline in cognitive function. With the age-related breakdown of skeleton, a repository for 90-95% of the total lead body burden (Hu et al., 1998), lead is mobilized into plasma and to target organs such as the brain. Therefore, the brain may experience lead exposure later in life even in the absence of external exposure sources (Weuve et al., in press). Previous studies have found the adverse impact on cognition to be generally greatest for tibial lead (Shih et al., 2007, Weuve et al., in press).
DMS was most consistently associated with lead in both bivariate and multiple regression analyses, whereas PAL was only statistically significantly associated with lead exposure in bivariate analyses. SRM did not appear to be consistently affected by lead exposure. In the study of Egerhazi and colleagues, PAL was most affected (although no direct statistical comparisons were carried out) of the 13 subtests of CANTAB utilized in the behavioral profiling in that study (Egerhazi et al., 2007) which would suggest that PAL is most predictive of future AD. However, subjects in that study were also already clinically diagnosed, whereas our subjects had no clinical disease. Therefore, the extent to which PAL or DMS represent a primary outcome in this subset of tests may reflect the underlying pathology or progression of the disease. It is also important to remember that the current study had a limited sample size. Despite this, it is notable that the two most affected subtests as studied in AD patients by Egerhazi and coworkers both show vulnerability to the effects of environmental lead exposure.
Our findings must be interpreted in light of several limitations. First, our sample size was small and hampered the ability to observe statistically significant associations of bone lead with MCI despite a two-fold difference in average lead levels (Table 3). Additionally, the modest sample size limited our ability to control for a large number of potential confounders in regression analyses. Nevertheless, bivariate analyses indicated that only a few of the covariates with sufficient data were associated with both lead exposure and memory impairment, and these covariates did not importantly impact our regression results. Several covariates were analyzed as categorical measures to enhance the interpretability of the findings. However, some could be considered to represent continuous constructs, such as BMI, alcohol use, and smoking (duration of smoking in years). Therefore, we repeated our multiple regression analyses of DMS scores including all three continuous covariates (in addition to age and educational level), which were not statistically significantly associated with DMS scores (either percent correct, all delays or with 12 second delay). Consequently, they were not confounders of the association between bone lead levels and cognitive impairment and did not meaningfully alter the findings presented in Table 4 (data not shown). Blood pressure is associated with lead exposure and may be a mediator of the association between lead and cognitive impairment. Controlling for hypertension history reduced the association with non-statistically significant p-values in our analysis and may be an over-adjustment. On the other hand, we may not have had sufficient sample size to identify all relevant confounders and therefore cannot rule out residual confounding. Furthermore, we did not obtain information on IQ which has been shown to associated with lead exposure (Lanphear et al., 2005) and may be correlated with CANTAB performance (Robbins et al., 1994).
Secondly, the association between lead exposure and cognition was explored in many different ways, and the generation of numerous p-values may have resulted in some being significant by chance. One approach to handle such multiple comparisons is to modify the cut-off for rejecting the null hypothesis according to the number of statistical tests performed, such as the Bonferroni adjustment (Glantz 2002). However, this adjustment is known to be problematic (Perneger 1998) and is overly conservative when a large number of comparisons are made (Glantz 2002). Rather than statistically adjusting for the number of comparisons made, our interpretation was based on the consistency of results across different types of analyses. That is, we used a combination of parametric and non-parametric statistical tests and multiple linear regression models to identify those associations that proved to be robust. DMS was consistently associated with calcaneal bone lead levels in three types of analyses; Spearman rank correlations, comparison of average lead levels between those who performed better and worse on cognitive tests, and multiple linear regression adjusting for age, education and smoking status. This suggests that this observation is potentially valid.
A substantial proportion of lead values in our population were negative, which can occur with K-XRF when true bone lead concentrations are close to zero. Because negative bone lead levels are difficult to interpret, our bivariate analyses were performed both with and without these values. This exclusion did not greatly affect the interpretation of findings for calcaneal lead, but tibial lead appeared to be more strongly associated with selected cognitive measures suggesting that misclassification of exposure resulted in bias towards no effect. Negative lead concentrations were readily accommodated in multiple linear regression models using a categorical lead variable in which the negative values were grouped in the lowest tertile. This approach appears appropriate as these values are more likely to represent concentrations close to zero than medium or high-level exposures.
Performance on cognitive tests may be affected by an individual's motivation to complete these tests successfully, which may be related to the level of interest in the subject matter or may be affected by medical comorbidities such as depression. Participants' level of motivation is unlikely to explain the association between bone lead level and the DMS subtest % correct, since DMS latency measures, which capture such determinants of behavioral performance, were not associated with lead exposure. It is also important to point out that the current study examined only three subtests of CANTAB, and assessment of other behavioral domains are clearly needed to evaluate the specificity of these effects.
Finally, our recruitment strategy relied primarily on the volunteer mechanism, which resulted in a study population more highly educated than the general population (only three participants, or 6.3 percent, had no more than a high school education) thereby potentially limiting the generalizability of our findings. Nevertheless, about half of our participants have ever smoked and two thirds were overweight or obese which are numbers similar to those in the general United States population (Centers for Disease Control and Prevention 2007).
In conclusion, we observed an association of higher calcaneal lead levels with increasing memory impairments on DMS. Future larger longitudinal studies may be able to shed more light on the etiology of lead-induced cognitive impairment in older adults, including the role of oxidative stress, hypertension, and other factors thought to be possible consequences of lead exposure and predictive of dementias and MCI.
Acknowledgments
We are indebted to Doug Weston for his efforts in recruitment and cognitive assessment of the study participants. We also thank Roni Kobrosly for this assistance in data management. This research was supported by Grants ES-01247 and PO1 ES 011854 from the US National Institutes of Health.
Footnotes
Publisher's Disclaimer: This is a PDF file of an unedited manuscript that has been accepted for publication. As a service to our customers we are providing this early version of the manuscript. The manuscript will undergo copyediting, typesetting, and review of the resulting proof before it is published in its final citable form. Please note that during the production process errors may be discovered which could affect the content, and all legal disclaimers that apply to the journal pertain.
References
- Ahamed M, Siddiqui MK. Low level lead exposure and oxidative stress: current opinions. Clin Chim Acta. 2007;383:57–64. doi: 10.1016/j.cca.2007.04.024. [DOI] [PubMed] [Google Scholar]
- Alzheimer's Association. 2008 Alzheimer's disease facts and figures. Alzheimers Dement. 2008;4:110–133. doi: 10.1016/j.jalz.2008.02.005. [DOI] [PubMed] [Google Scholar]
- Aro A, Amarasiriwardena C, Lee ML, Kim R, Hu H. Validation of K x-ray fluorescence bone lead measurements by inductively coupled plasma mass spectrometry in cadaver legs. Med Phys. 2000;27:119–123. doi: 10.1118/1.598863. [DOI] [PubMed] [Google Scholar]
- Barbeau E, Didic M, Tramoni E, Felician O, Joubert S, Sontheimer A, Ceccaldi M, Poncet M. Evaluation of visual recognition memory in MCI patients. Neurology. 2004;62:1317–1322. doi: 10.1212/01.wnl.0000120548.24298.db. [DOI] [PubMed] [Google Scholar]
- Basha MR, Murali M, Siddiqi HK, Ghosal K, Siddiqi OK, Lashuel HA, Ge YW, Lahiri DK, Zawia NH. Lead (Pb) exposure and its effect on APP proteolysis and Abeta aggregation. Faseb J. 2005a;19:2083–2084. doi: 10.1096/fj.05-4375fje. [DOI] [PubMed] [Google Scholar]
- Basha MR, Wei W, Bakheet SA, Benitez N, Siddiqi HK, Ge YW, Lahiri DK, Zawia NH. The fetal basis of amyloidogenesis: exposure to lead and latent overexpression of amyloid precursor protein and beta-amyloid in the aging brain. J Neurosci. 2005b;25:823–829. doi: 10.1523/JNEUROSCI.4335-04.2005. [DOI] [PMC free article] [PubMed] [Google Scholar]
- Bolin CM, Basha R, Cox D, Zawia NH, Maloney B, Lahiri DK, Cardozo-Pelaez F. Exposure to lead and the developmental origin of oxidative DNA damage in the aging brain. Faseb J. 2006;20:788–790. doi: 10.1096/fj.05-5091fje. [DOI] [PubMed] [Google Scholar]
- Centers for Disease Control and Prevention. Behavioral Risk Factor Surveillance System Survey Data. Atlanta, GA: U.S. Department of Health and Human Services, Centers for Disease Control and Prevention; 2007. [Google Scholar]
- Chertkow H. Diagnosis and treatment of dementia: introduction. Introducing a series based on the Third Canadian Consensus Conference on the Diagnosis and Treatment of Dementia. CMAJ. 2008;178:316–321. doi: 10.1503/cmaj.070795. [DOI] [PMC free article] [PubMed] [Google Scholar]
- Chertkow H, Massoud F, Nasreddine Z, Belleville S, Joanette Y, Bocti C, Drolet V, Kirk J, Freedman M, Bergman H. Diagnosis and treatment of dementia: 3. Mild cognitive impairment and cognitive impairment without dementia. CMAJ. 2008;178:1273–1285. doi: 10.1503/cmaj.070797. [DOI] [PMC free article] [PubMed] [Google Scholar]
- Christoffersson JO, Schutz A, Ahlgren L, Haeger-Aronsen B, Mattsson S, Skerfving S. Lead in finger-bone analysed in vivo in active and retired lead workers. Am J Ind Med. 1984;6:447–457. doi: 10.1002/ajim.4700060608. [DOI] [PubMed] [Google Scholar]
- Egerhazi A, Berecz R, Bartok E, Degrell I. Automated Neuropsychological Test Battery (CANTAB) in mild cognitive impairment and in Alzheimer's disease. Prog Neuropsychopharmacol Biol Psychiatry. 2007;31:746–751. doi: 10.1016/j.pnpbp.2007.01.011. [DOI] [PubMed] [Google Scholar]
- Gerhardsson L, Attewell R, Chettle DR, Englyst V, Lundstrom NG, Nordberg GF, Nyhlin H, Scott MC, Todd AC. In vivo measurements of lead in bone in long-term exposed lead smelter workers. Arch Environ Health. 1993;48:147–156. doi: 10.1080/00039896.1993.9940813. [DOI] [PubMed] [Google Scholar]
- Glantz SA. A primer of biostatistics. 5th edition. New York, NY: McGraw-Hill; 2002. [Google Scholar]
- Hu H, Milder FL, Burger DE. X-ray fluorescence measurements of lead burden in subjects with low-level community lead exposure. Arch Environ Health. 1990;45:335–341. doi: 10.1080/00039896.1990.10118752. [DOI] [PubMed] [Google Scholar]
- Hu H, Payton M, Korrick S, Aro A, Sparrow D, Weiss ST, Rotnitzky A. Determinants of bone and blood lead levels among community-exposed middle-aged to elderly men. The normative aging study. Am J Epidemiol. 1996;144:749–759. doi: 10.1093/oxfordjournals.aje.a008999. [DOI] [PubMed] [Google Scholar]
- Hu H, Pepper L, Goldman R. Effect of repeated occupational exposure to lead, cessation of exposure, and chelation on levels of lead in bone. Am J Ind Med. 1991;20:723–735. doi: 10.1002/ajim.4700200603. [DOI] [PubMed] [Google Scholar]
- Hu H, Rabinowitz M, Smith D. Bone lead as a biological marker in epidemiologic studies of chronic toxicity: conceptual paradigms. Environ Health Perspect. 1998;106:1–8. doi: 10.1289/ehp.981061. [DOI] [PMC free article] [PubMed] [Google Scholar]
- Iddon JL, Pickard JD, Cross JJ, Griffiths PD, Czosnyka M, Sahakian BJ. Specific patterns of cognitive impairment in patients with idiopathic normal pressure hydrocephalus and Alzheimer's disease: a pilot study. J Neurol Neurosurg Psychiatry. 1999;67:723–732. doi: 10.1136/jnnp.67.6.723. [DOI] [PMC free article] [PubMed] [Google Scholar]
- Kim R, Aro A, Rotnitzky A, Amarasiriwardena C, Hu H. K x-ray fluorescence measurements of bone lead concentration: the analysis of low-level data. Phys Med Biol. 1995;40:1475–1485. doi: 10.1088/0031-9155/40/9/007. [DOI] [PubMed] [Google Scholar]
- Lanphear BP, Hornung R, Khoury J, Yolton K, Baghurst P, Bellinger DC, Canfield RL, Dietrich KN, Bornschein R, Greene T, Rothenberg SJ, Needleman HL, Schnaas L, Wasserman G, Graziano J, Roberts R. Low-level environmental lead exposure and children's intellectual function: an international pooled analysis. Environ Health Perspect. 2005;113:894–899. doi: 10.1289/ehp.7688. [DOI] [PMC free article] [PubMed] [Google Scholar]
- Muldoon SB, Cauley JA, Kuller LH, Morrow L, Needleman HL, Scott J, Hooper FJ. Effects of blood lead levels on cognitive function of older women. Neuroepidemiology. 1996;15:62–72. doi: 10.1159/000109891. [DOI] [PubMed] [Google Scholar]
- Nasreddine ZS, Phillips NA, Bedirian V, Charbonneau S, Whitehead V, Collin I, Cummings JL, Chertkow H. The Montreal Cognitive Assessment, MoCA: a brief screening tool for mild cognitive impairment. J Am Geriatr Soc. 2005;53:695–699. doi: 10.1111/j.1532-5415.2005.53221.x. [DOI] [PubMed] [Google Scholar]
- Navas-Acien A, Guallar E, Silbergeld EK, Rothenberg SJ. Lead exposure and cardiovascular disease--a systematic review. Environ Health Perspect. 2007;115:472–482. doi: 10.1289/ehp.9785. [DOI] [PMC free article] [PubMed] [Google Scholar]
- Patterson C, Feightner JW, Garcia A, Hsiung GY, MacKnight C, Sadovnick AD. Diagnosis and treatment of dementia: 1. Risk assessment and primary prevention of Alzheimer disease. CMAJ. 2008;178:548–556. doi: 10.1503/cmaj.070796. [DOI] [PMC free article] [PubMed] [Google Scholar]
- Perlstein T, Weuve J, Schwartz J, Sparrow D, Wright R, Litonjua A, Nie H, Hu H. Cumulative community-level lead exposure and pulse pressure: the normative aging study. Environ Health Perspect. 2007;115:1696–1700. doi: 10.1289/ehp.10350. [DOI] [PMC free article] [PubMed] [Google Scholar]
- Perneger TV. What's wrong with Bonferroni adjustments. Bmj. 1998;316:1236–1238. doi: 10.1136/bmj.316.7139.1236. [DOI] [PMC free article] [PubMed] [Google Scholar]
- Pratico D. Oxidative stress hypothesis in Alzheimer's disease: a reappraisal. Trends Pharmacol Sci. 2008;29:609–615. doi: 10.1016/j.tips.2008.09.001. [DOI] [PubMed] [Google Scholar]
- Rajan P, Kelsey KT, Schwartz JD, Bellinger DC, Weuve J, Spiro A, 3rd, Sparrow D, Smith TJ, Nie H, Weisskopf MG, Hu H, Wright RO. Interaction of the delta-aminolevulinic acid dehydratase polymorphism and lead burden on cognitive function: the VA normative aging study. J Occup Environ Med. 2008;50:1053–1061. doi: 10.1097/JOM.0b013e3181792463. [DOI] [PMC free article] [PubMed] [Google Scholar]
- Reddy GR, Devi BC, Chetty CS. Developmental lead neurotoxicity: alterations in brain cholinergic system. Neurotoxicology. 2007;28:402–407. doi: 10.1016/j.neuro.2006.03.018. [DOI] [PubMed] [Google Scholar]
- Robbins TW, James M, Owen AM, Sahakian BJ, McInnes L, Rabbitt P. Cambridge Neuropsychological Test Automated Battery (CANTAB): a factor analytic study of a large sample of normal elderly volunteers. Dementia. 1994;5:266–281. doi: 10.1159/000106735. [DOI] [PubMed] [Google Scholar]
- Shih RA, Hu H, Weisskopf MG, Schwartz BS. Cumulative lead dose and cognitive function in adults: a review of studies that measured both blood lead and bone lead. Environ Health Perspect. 2007;115:483–492. doi: 10.1289/ehp.9786. [DOI] [PMC free article] [PubMed] [Google Scholar]
- Smith T, Gildeh N, Holmes C. The Montreal Cognitive Assessment: validity and utility in a memory clinic setting. Can J Psychiatry. 2007;52:329–332. doi: 10.1177/070674370705200508. [DOI] [PubMed] [Google Scholar]
- Somervaille LJ, Chettle DR, Scott MC, Tennant DR, McKiernan MJ, Skilbeck A, Trethowan WN. In vivo tibia lead measurements as an index of cumulative exposure in occupationally exposed subjects. Br J Ind Med. 1988;45:174–181. doi: 10.1136/oem.45.3.174. [DOI] [PMC free article] [PubMed] [Google Scholar]
- Theppeang K, Glass TA, Bandeen-Roche K, Todd AC, Rohde CA, Links JM, Schwartz BS. Associations of bone mineral density and lead levels in blood, tibia, and patella in urban-dwelling women. Environ Health Perspect. 2008;116:784–790. doi: 10.1289/ehp.10977. [DOI] [PMC free article] [PubMed] [Google Scholar]
- Vaziri ND. Mechanisms of lead-induced hypertension and cardiovascular disease. Am J Physiol Heart Circ Physiol. 2008;295:H454–465. doi: 10.1152/ajpheart.00158.2008. [DOI] [PMC free article] [PubMed] [Google Scholar]
- Vaziri ND, Gonick HC. Cardiovascular effects of lead exposure. Indian J Med Res. 2008;128:426–435. [PubMed] [Google Scholar]
- Wang L, Luo L, Luo YY, Gu Y, Ruan DY. Effects of Pb2+ on muscarinic modulation of glutamatergic synaptic transmission in rat hippocampal CA1 area. Neurotoxicology. 2007;28:499–507. doi: 10.1016/j.neuro.2006.11.003. [DOI] [PubMed] [Google Scholar]
- Weisskopf MG, Proctor SP, Wright RO, Schwartz J, Spiro A, 3rd, Sparrow D, Nie H, Hu H. Cumulative lead exposure and cognitive performance among elderly men. Epidemiology. 2007;18:59–66. doi: 10.1097/01.ede.0000248237.35363.29. [DOI] [PubMed] [Google Scholar]
- Weisskopf MG, Wright RO, Schwartz J, Spiro A, 3rd, Sparrow D, Aro A, Hu H. Cumulative lead exposure and prospective change in cognition among elderly men: the VA Normative Aging Study. Am J Epidemiol. 2004;160:1184–1193. doi: 10.1093/aje/kwh333. [DOI] [PubMed] [Google Scholar]
- Weuve J, Korrick S, Weisskopf MG, Ryan LM, Schwartz J, Nie H, Grodstein F, Hu H. Cumulative exposure to lead in relation to cognitive function in older women. Environ Health Perspect; in press. [DOI] [PMC free article] [PubMed] [Google Scholar]
- White LD, Cory-Slechta DA, Gilbert ME, Tiffany-Castiglioni E, Zawia NH, Virgolini M, Rossi-George A, Lasley SM, Qian YC, Basha MR. New and evolving concepts in the neurotoxicology of lead. Toxicol Appl Pharmacol. 2007;225:1–27. doi: 10.1016/j.taap.2007.08.001. [DOI] [PubMed] [Google Scholar]
- Wright RO, Tsaih SW, Schwartz J, Spiro A, 3rd, McDonald K, Weiss ST, Hu H. Lead exposure biomarkers and mini-mental status exam scores in older men. Epidemiology. 2003;14:713–718. doi: 10.1097/01.EDE.0000081988.85964.db. [DOI] [PubMed] [Google Scholar]
- Wu J, Basha MR, Brock B, Cox DP, Cardozo-Pelaez F, McPherson CA, Harry J, Rice DC, Maloney B, Chen D, Lahiri DK, Zawia NH. Alzheimer's disease (AD)-like pathology in aged monkeys after infantile exposure to environmental metal lead (Pb): evidence for a developmental origin and environmental link for AD. J Neurosci. 2008a;28:3–9. doi: 10.1523/JNEUROSCI.4405-07.2008. [DOI] [PMC free article] [PubMed] [Google Scholar]
- Wu J, Basha MR, Zawia NH. The environment, epigenetics and amyloidogenesis. J Mol Neurosci. 2008b;34:1–7. doi: 10.1007/s12031-007-0009-4. [DOI] [PubMed] [Google Scholar]