

Abstract
A microflow cytometer was developed that ensheathed the sample (core) fluid on all sides and interrogated each particle in the sample stream at four different wavelengths. Sheathing was achieved by first sandwiching the core fluid with the sheath fluid laterally via fluid focusing. Chevron-shaped groove features fabricated in the top and bottom of the channel directed sheath fluid from the sides to the top and bottom of the channel, completely surrounding the sample stream. Optical fibers inserted into guide channels provided excitation light from diode lasers at 532 and 635 nm and collected the emission wavelengths. Two emission collection fibers were connected to PMTs through a multimode fiber splitter and optical filters for detection at 635 nm (scatter), 665 nm and 700 nm (microsphere identification) and 565 nm (phycoerythrin tracer). The cytometer was capable of discriminating microspheres with different amounts of the fluorophores used for coding and detecting the presence of a phycoerythrin antibody complex on the surface of the microspheres. Assays for Escherichia coli were compared with a commercial Luminex flow cytometer.
Introduction
Flow cytometry has demonstrated utility for applications in research fields as diverse as genetics, clinical marker identification, developmental embryology, biodefense, and cytochemistry.1 Traditionally, flow cytometers have been large laboratory instruments operated by specially trained technicians. However, over the last decade, “personal cytometers” have become available that are smaller, less expensive and more user friendly.2–5 Generally, they do not have capability for cell sorting, but can analyze signals at more than one fluorescence wavelength and light scatter, a rough measure of size and density. As a result, users are developing methods for continuous monitoring of the environment6,7 and routine clinical screening. To more easily bring such applications to the field or point of care, more miniaturization, automation, and cost reductions are required. Microfluidic approaches, combined with less expensive optical components, are key for achieving success.
Several features are important for accurate analysis of individual particles in a flow cytometer, whether large or small. First, the particles must move one by one through the interrogation region. For this to happen, the sample or “core” stream must be of a diameter that is within an order of magnitude of that of the particles to be measured. The wider the core, as compared to the size of the particle, the more chance that two or more particles will overlap within the interrogation region, confounding the analysis. Second, the particles should all pass through the same region of the interrogation beam if quantitative information is important. Interrogation beams are usually obtained from a laser and typically have a Gaussian intensity profile, so a particle near the edge of the beam may generate a lower fluorescence signal than an identical particle in the center of the beam. Two factors are important for achieving uniform excitation: the diameter of the core should be small relative to the diameter of the interrogation beam, and the core should be positionally stable as it flows through the channel. Fluctuations caused by irregular fluid pumping or debris accumulating on the walls can cause the core to move from side to side. In addition, the data acquisition must be sufficiently fast to characterize the signal pulses generated by individual particles passing through the beam at typical flow rates. Finally, when multiple lasers and/or detectors are used, either physical alignment or electronic offsets synchronized with the core flow rate are required to coordinate signals at multiple wavelengths with individual particles. The more signals collected from each particle, the more challenging the alignment of the multiple lasers and detectors becomes.
The microfluidics community has eagerly approached the challenge of fabricating a microflow cytometer. The first challenge is to eliminate the nozzle that is used in larger flow cytometers to inject the core stream into a surrounding sheath stream because a round nozzle within a cylindrical sheath channel is very difficult to fabricate in a microfluidic system. Channels fabricated for use as microflow cytometers have been designed in a number of ways: no sheathing,8 sheathing on two sides,9–13 sheathing on three sides,14,15 and sheathing on four sides.16–23 These approaches are reviewed in detail in Ateya et al.24 In general, if there is no sheathing, the channel diameter must be similar to the particle diameter in order to focus the particles within the interrogation region; clogging of the channel and light scatter off the walls are significant problems. Sheathing on two sides is relatively easy and has been used extensively. However, the particles are still not focused between the two channel walls where there is no sheath flow, and fouling of the channel walls, loss of particles, and clogging are still potential problems. Three-sided sheath flow was achieved by making the sheath fluid input channel deeper than the sample fluid input channel, so that the sheath stream flowed over the sample stream as well as on both sides. This geometry was somewhat more difficult to fabricate than the cross-shaped, two-sided sheath flow systems; nonetheless, 10 μm particles flowing through the three-sided sheath flow channels had less variance in fluorescence intensity than particles flowing through a two-sided sheath flow cytometer.12,14 The four-sided sheath systems successfully focused the core stream so that particles flowed in single file with reduced signal variance. However, fabrication and plumbing for these microflow cytometers are much more complex, with four-to-six inlets for the sheath stream being typical.
Like the four-sided sheath systems, the microflow cytometer described here creates a sheath flow that completely surrounds the core stream, yet the fabrication and plumbing are relatively simple. As described in Howell et al.,25 grooves in the top and bottom of the channels direct sheath fluid around the core. Two variants of this sheath flow design have been fabricated by soft lithography and laser ablation, and the sheathing function has been characterized. In the first version, sheath fluid from a single inlet is directed up, over, around, and under the core stream by straight diagonal grooves in the top, sidewall and bottom of the main channel. In the second version, chevron-shaped grooves in the top and bottom of the channel direct sheath fluid from both sides of the core stream such that the fluid is directed above and below the core stream, as well as continuing along the sides. In this study we employ the sheathing mechanism with the chevrons in the top and bottom. Although the chevron design requires a second input channel for the sheath fluid, the core position is more stable and the core size, shape and position can be more easily manipulated within the interrogation region.
The number of lasers and detection elements focused on the interrogation region determines the number of output wavelengths (scatter and fluorescence) that can be measured. Multi-color analyses have been used for decades in flow cytometers, but the advent of biomolecular assays on coded microsphere arrays in the last eight years1,2,26–32 has meant that instead of analyzing one target per color, a flow cytometer can use a few colors to analyze hundreds of targets simultaneously. In a standard microsphere array assay, microspheres are coded with different amounts of two fluorophores. Each set of microspheres with a unique code is coated with a particular recognition molecule, and the sets are mixed. Target binding to microspheres of one code is followed by binding of a target-specific tracer molecule with a third fluorescent color. The codes of the microspheres along with the third color are read as the microspheres pass through the flow cytometer, and the target is detected and identified. Over 100 different 2-color microsphere sets are commercially available for flow cytometry, with and without the inclusion of magnetic nanoparticles, and 3-color sets are under development. While this capacity for highly multiplexed assays is not required for many applications, it adds critical capability for applications such as disease diagnostics and characterization of complex biochemical reactions.33
The microflow cytometer described here is unique among microfluidic cytometers in two respects. First, the chevron-based sheathing mechanism not only provides for the sheath to completely surround the core, but it also makes it simple to adjust the position of the core by varying the relative flow rates for the two fluids. Second, rather than illuminating the flow channel by directing the laser light through the glass substrate supporting the microchannel walls as in the systems described above, light is delivered into the channel from the side using optical fibers. Multimode fibers are used to collect the light scatter and three fluorescence signals from coded microspheres passing through the interrogation region. While this design adds a degree of complexity to the fabrication process, the result is a more robust microflow cytometer. The design, fabrication, and demonstration of the chevron-based microflow cytometer are described. The performance of the system was assessed by evaluating: 1) the ability to discriminate microspheres based on scatter and 2-color fluorescence analysis, and 2) the performance of an immunoassay for E. coli using bead identification and a third color.
Experimental
Materials
Streptavidin-conjugated phycoerythrin was supplied by Prozyme (San Leandro, CA, USA). Carboxy-functionalized microsphere sets 98, 81, 77, 73, and 50, were purchased from Luminex Corporation (Austin, TX, USA). All microspheres were 5.6 μm diameter polystyrene beads coded with different amounts of two fluorescent indicator dyes. Llama IgG (anti-ricin) and goat anti-llama IgG were purchased from Triple J Farms (Bellingham, WA, USA). Heat deactivated E. coli, goat anti-E. coli, goat anti-listeria, and goat anti-salmonella IgG were obtained from Kirkegaard & Perry Laboratories, Inc. (Gaithersburg, Mary-land). Rabbit anti-staphylococcal enterotoxin B (SEB) was kindly provided by the Naval Medical Research Center (Silver Spring, MD, USA). Chlorotrimethylsilane was purchased from Sigma-Aldrich (St. Louis, MO, USA). SU-8 photoresist was purchased from Microchem (Newton, MA, USA). Polydimethylsiloxane (PDMS, Sylgard 184) was purchased from Dow-Corning (Corning, NY, USA) and used according to manufacturer’s instructions for using a 10:1 mass ratio of base to curing agent. Polyetheretherketone (PEEK) tubing was purchased from Upchurch Scientific (Oak Harbor, WA, USA).
Flow channel design and device fabrication
The sheath flow was generated by a combination of lateral fluid focusing and chevron-shaped groove features in the top and bottom of the channel. The positioning of the chevrons and the inlet channels are shown in Fig. 1. The chevron-based design generated stable core flow at low core flow rates (~ 10 μL/min), with no visible side-to-side fluctuation. Since there was no need for inlets above or below the flow channel, as in other sheath microflow systems, the fabrication of this design was straightforward using soft lithography.
Fig. 1.
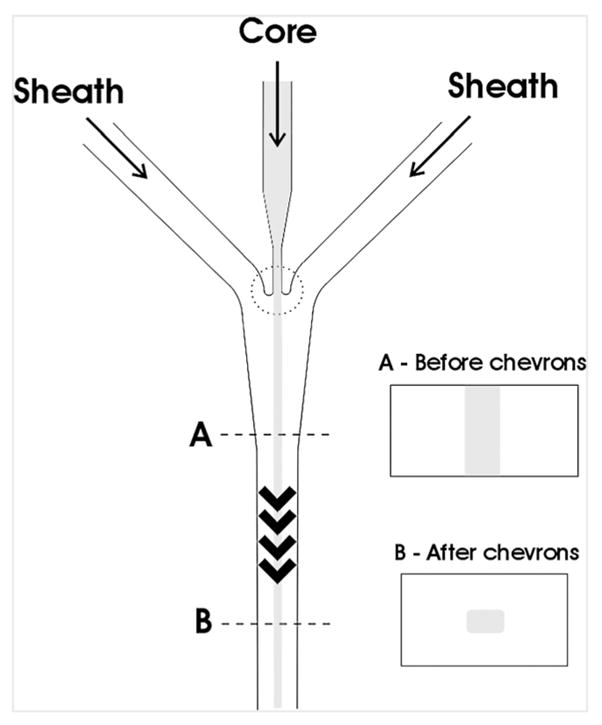
Chevrons and sheath flow generation. Core fluid was surrounded by sheath fluid by first sandwiching the core stream between the two sheath streams via fluid focusing. The chevrons perform the final sheathing function by moving some of the sheath fluid to above and below the core.
The microflow cytometer channels were fabricated in polydimethylsiloxane (PDMS) using standard microfabrication procedures.34 Briefly, a master was created on a silicon wafer by sequentially spinning on layers of SU-8 photoresist and exposing with a photomask containing the desired channel geometries and features. After development, the master was treated with chlorotrimethylsilane vapor to prevent polymer adhesion. The master was placed into the bottom of a mold, and PDMS was poured on top to make layers with thicknesses of approximately 1 mm (bottom) or 10 mm (top). After curing, the PDMS was peeled from the master. Fluidic inlets were cored into the top of the cytometer, and polyetheretherketone (PEEK) tubing sections (Upchurch Scientific, Oak Harbor, WA) with an internal diameter of 400 μm and a length of 13 mm were placed into the inlets. Channels were located only in the top half of the device so that only the chevrons would need to be aligned before bonding. Channels were 130 μm high throughout and 390 μm wide in the sheathing and interrogation region. The chevron-shaped grooves extended 65 μm into the top and bottom of the channels. The two PDMS pieces were then bonded together by oxygen plasma treatment.35 Optical fibers were cleaved, placed into their guide channels and carefully aligned with the channel walls. Finally, the optical fiber channels and PEEK inlets were sealed with PDMS cured at 50 °C for 2 hours.
Detection system
A fiber-optic detection system was designed and constructed to provide excitation light and collect the scatter and fluorescence emission of each of the coded microspheres flowing through the interrogation region. Excitation light from diode lasers at 532 nm (GM32-10H, 10 mW, Intelite, Inc. Minden NV) and 635 nm (LAS-200-635-15, 15 mW, Lasermax Inc, Rochester, NY) was launched into optical fibers (Fiber Instrument Sales, Inc Oriskany, NY) using a microscope objective for the 532 nm laser and a single-mode coupler (HPUC-28-635-S-11AS-1, OZ Optics, Saint Cloud, FL) for the 635 nm laser. To confine the microsphere identification excitation beam, a single-mode fiber with a numerical aperture (NA) of 0.14 was used for the 635 nm excitation. All other fibers aligned on the interrogation region were multimode (0.275 NA).
The fiber pigtails were cleaved, inserted into the PDMS module and aligned with the interrogation region. As shown in Fig. 2, the microsphere identification fiber (upper right) and the phycoerythrin/light scatter fiber (lower left) were each connected to a multimode fiber splitter (1 × 2 30/70 Coupler, 1 × 2 50/50 Coupler, 62.5 μm, Fiber Instrument Sales, Inc, Oriskany, NY). The microsphere identification splitter was a 50/50 splitter and the phycoerythrin/scatter splitter was a 70/30 splitter. Since the scatter signal was very strong relative to the phycoerythrin signal, the phycoerythrin was detected through the 70% leg and the light scatter was detected through the 30% leg. Each of the four interrogation fibers was connected to one of four PMTs (H9306-02, Hamamatsu Corp., Bridgewater, NJ) for detection of the requisite wavelength. Each of the PMTs was equipped with a filter: a 635 ± 5 nm filter for light scatter (635DF10, Omega Optical, Inc., Brattleboro, VT), 665 ± 10 nm and 700 nm long-pass filters for microsphere identification (665DF20, Omega Optical, Inc., Brattleboro VT, LL700, 700 nm long-pass filter, Corion Corp., Franklin MA), and a 565 ± 10 nm filter for detection of phycoerythrin fluorescence (565WB20, Omega Optical, Inc., Brattleboro, VT). The PMTs and laser sources were all equipped with an ST fiber optic receptacle that was permanently aligned with the optical system for quick connection of the optical fiber pigtails. The output of the PMTs was recorded using an A/D converter (NI USB-6251 M, National Instruments, Austin, TX) and data acquisition and data analysis software was written in LabWindows/CVI (National Instruments, Austin, TX).
Fig. 2.
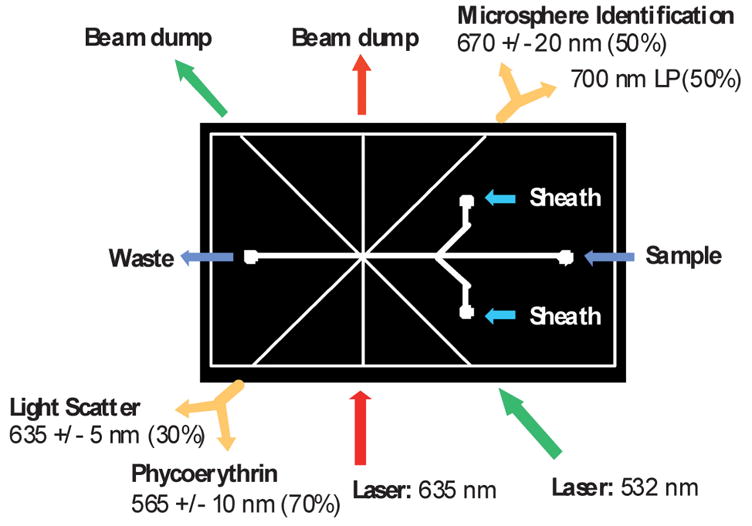
The PDMS module was 3.17 × 5.71 cm and had connections for optical fibers and fluidics as shown in the figure. Excitation fibers (bottom) were connected to the 635 nm and 532 nm lasers. Two multimode beam dump fibers were inserted across the channel from the excitation fibers (upper left) to capture excess excitation light and reduce scatter. The microsphere identification fiber (upper right) and the phycoerythrin/light scatter fiber (lower left) were each connected to a multimode fiber splitter. Each leg of the splitters was connected to a PMT as shown in the diagram.
Assay protocols
Sample was flowed into the PDMS microflow channel using a precision syringe pump (CAVRO XE 1000, Tecan Systems, Inc., San Jose, CA) controlled by software written in Lab-Windows/CVI via RS232 communication. To avoid uneven flow, a dual syringe pump (EW-74900-10, Cole-Parmer Instrument Company, Vernon Hills, IL) was used for the two sheath fluid channels. The microflow cytometer was initially flushed with sheath fluid (deionized water filtered through 0.2 μm syringe filters) at 100 μL/min. Microsphere-containing samples (in filtered, deionized water) were injected into the sample (core) inlet at 10 μL/min while the sheath fluid flowed at 100 μL/min in each inlet yielding an overall flow rate of 210 μL/min. PMT gains for the detection of microsphere identification dyes (665 nm and 700 nm) were both set to 0.90 V. The PMT used to detect phycoerythrin fluorescence emission was set to maintain background at or below 0.10 V. The PMT gain for the detection of light scatter was set to obtain the substantially high scatter signal with minimal signal overload.
Phycoerythrin detection protocol
Carboxy-functionalized microspheres (microsphere sets 50, 73, 77, 81) were activated with a standard two-step carbodiimide coupling chemistry protocol as described by the manufacturer. Llama IgG was subsequently covalently attached to the surface of microsphere set 77, while various antibodies (used here as negative controls) were attached to the other microsphere sets. After removal of unbound antibody from the microspheres, i.e. excess llama IgG from microsphere set 77, they were resuspended in phosphate buffered saline (PBS) with 0.05% Tween-20 (PBST) and then stored in the dark at 4 °C until used. For this experiment, set 77 was incubated with biotinylated goat anti-llama IgG (1 μg/mL). Streptavidin-phycoerythrin tracer (5 μg/mL) was added to the biotinylated anti-llama IgG-labeled microsphere set 77. Excess tracer was removed by washing the microspheres over a filter plate. Antibody-labeled microsphere sets 50, 73, 81 and the phycoerythrin-labeled microsphere set 77 were flowed through the microflow cytometer separately (~ 5 × 10³ microspheres/mL) and measured individually.
Bacterial detection protocol
Carboxy-functionalized microspheres (microsphere sets 50, 73, 81, 98) were activated with a standard two-step carbodiimide coupling chemistry protocol as described by the manufacturer. Rabbit or goat IgG specific for bacterial agents was covalently attached to the surface of the individual microsphere sets. The microsphere sets were designated to detect the bacterial agents as follows: 50-Salmonella, 73-Listeria, 81-Escherichia coli, 98-Staphylococcal enterotoxin B (SEB).
Samples consisting of a mixture of microspheres from each set were incubated with E. coli in concentrations of 107, 106, 105, 104, and 0 cfu/ml (colony forming units/ml) for 30 minutes at room temperature. Unbound antigen was removed on a filter plate, before biotinylated goat anti-E. coli IgG (5 μg/mL) was added to the microsphere mixture and allowed to incubate for 30 minutes at room temperature. Again, a filter plate was used to remove excess tracer antibody before streptavidin-phycoerythrin (5 μg/mL) was added. After a 30 minute incubation in the dark, the excess fluorescent protein was removed before analysis using a commercial Luminex © 100 system or the microflow cytometer.
Data collection and thresholding
The data acquisition system was set to sample at 60,000 samples/s. The microspheres passing through the interrogation region generated pulses in each of the four detection channels, representing microsphere detection events. A software threshold of 2.5 V was set on the light scatter detection channel to trigger data collection of each event. When the light scatter threshold exceeded 2.5 V, the data from the two microsphere identification signals, phycoerythrin fluorescence, and light scatter were recorded until the light scatter signal dropped below the 2.50 V threshold value.
Results and discussion
The goal of this study was to assemble and demonstrate a microfluidic flow cytometer based on a novel approach for creating three-dimensional sheath flow in microfabricated channels. The sheath flow was generated in two steps. First, the core stream was sandwiched laterally between two sheath streams via flow focusing, as shown in Fig. 1. Second, chevron-shaped grooves caused fluid advection that moved some of the sheath fluid from the sides of the channel to above and below the core fluid, forming a sheath that completely surrounded the core. Details of how the groove features cause fluid advection and generate sheath flow can be found in Howell.25,36 The performance of the microflow cytometer was judged by its ability to discriminate microspheres and detect a target analyte based on light scatter and 3-color fluorescence.
Modeling
To understand and visualize the three-dimensional sheathing action of the chevrons, fluid flow was simulated using the COMSOL Multiphysics finite element analysis package (Comsol Inc., Palo Alto, CA) with a model of the channel geometry. To reduce computation time for the simulations, only the top half of the channel was modeled. Flow in the inlet was specified to be fully developed, and the no-slip condition was assumed to hold at the channel walls. The channel dimensions were based on the dimensions of the actual microflow channel, which were 390 μm wide and 130 μm high. The four chevrons were in the form of grooves 200 μm apart, 65 μm deep and 100 μm wide on the top and bottom of the channel. With core flow rate set to 10 and sheath flow rates on each set to 100 μl/min, the core would be 18.5 μm wide and 130 μm high at the inlet of the channel, which were the dimensions used for the simulation. Fig. 3 shows the top view, side view and channel cross section of the simulated flow, showing the fully sheathed core at the outlet. The core fluid was simulated as a fluid having maximum concentration and the sheath as a fluid with zero concentration. The simulation results showed that the size of the core at position A in Fig. 1 was 43 × 34 μm for flow rates of 10 μl/min for the core and 100 μl/min for each sheath inlet. At 10 μl/min core and 200 μl/min for each sheath inlet, the size of the core at position A in Fig. 1 was 20 × 34 μm. The core width was confirmed using dye in the core fluid and visual inspection using light microscopy.
Fig. 3.
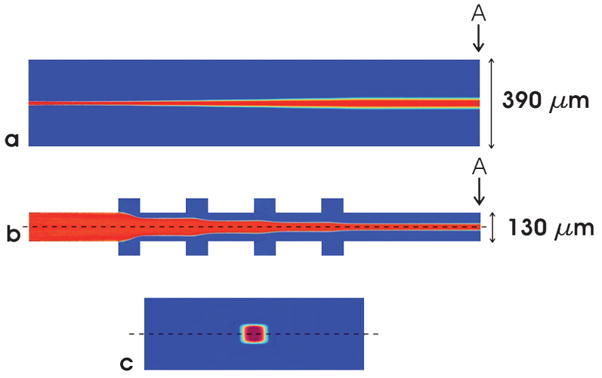
Simulation of chevron sheathing using COMSOL. The core fluid and sheath fluid enter the channel simulation from the left and flow at rates of 10 μL/min and 100 μL/min per channel, respectively. To reduce computation time, only the top half of the channel (above the dotted line) was modeled. (a) top view of channel. (b) side view of section down the middle of the channel showing chevron locations (c) sheathed core fluid as viewed at cross-section “A” (enlarged). For (b) and (c) the top half of the channel was combined with its mirror image to form a full image of the channel.
Fabrication issues
Fabrication of the cytometer in a microfluidic format provided a number of challenges. In general, there were three major issues considered in the channel design: (1) making the channels large enough to fit mated parts, such as optical fibers, (2) minimizing the core size without resorting to excessive volumetric flow rates, and (3) minimizing flow fluctuations.
The flow channel dimensions were driven by the dimensions of the optical fibers (130 μm diameter). To ensure alignment of the fiber core with the vertical center of the channel, the channel height was set to the diameter of the fibers. Fiber guide channels 135 μm wide by 130 μm deep were molded into the PDMS to insert the optical fibers for excitation, collection of scatter and fluorescence signals, and removal of the excitation beams (beam dump). Fig. 2 shows the configuration of the fiber guide channels with the flow channel. Since this design had a single interrogation region, all fibers had to be aimed at the same central spot in the fluid stream where the fluid core would pass. The locations of the fibers surrounding the interrogation region was a compromise between the need to position the fibers near the fluidic core to deliver and collect light at multiple wavelengths and the size of the individual fibers themselves, which limited their proximity to each other. The methods reported previously for using fibers with flow cytometers were not applicable for alignment of multiple fibers focused on one location in the microfluidic channel.13,37–39 Therefore, channel width was set to 390 μm to allow enough room to align the fiber tips around the interrogation region. The overlapping fiber NAs formed the interrogation region where the excitation of the microspheres in the core and the collection of scatter and fluorescence emission occurred simultaneously. Fig. 4 shows light passing through the 532 and 635 nm excitation fibers and the microsphere identification fluorescence collection fiber, verifying that the excitation and collection regions overlap in the center of the flow channel. The intersection of the excitation region with the core cross-section forms an interrogation region that is approximately 20 × 34 × 30 μm. In future work, the excitation channels will be combined through the use of fiber splitters and/or dichroic mirrors and optimal angles for scatter detection, background reduction and fluorescence detection will be determined.
Fig. 4.
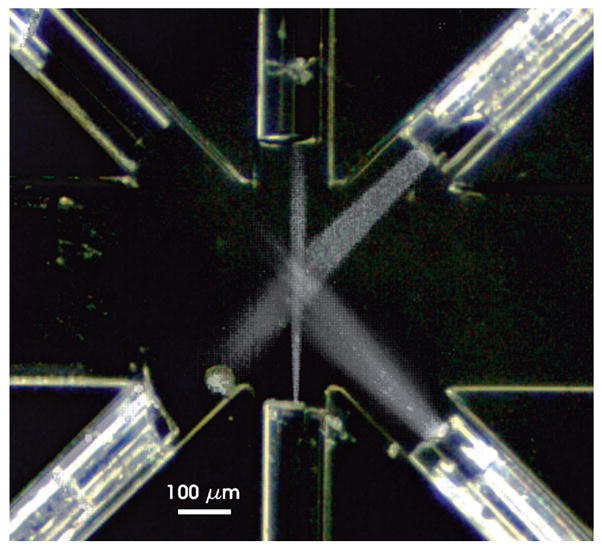
Alignment of fibers in the interrogation region. To observe the alignment of the optical fibers with the center of the flow channel, each fiber was connected to a laser while the channel was filled with Cy5 dye solution and photographed. Three images were combined to show the overlap of the output of the single mode 635 nm excitation fiber (bottom), the phycoerythrin excitation fiber (bottom right) and the acceptance angle of the microsphere identification fiber (top right).
Chevrons in the top and bottom of the channel were used as part of the mechanism to create core-in-sheath flow. The optimal number of chevrons to produce a core stream in the middle of the channel was determined using simulations generated by a computational fluidics “toolbox” program.40 Unfortunately, the chevrons themselves sometimes served as bubble traps. Thus, chevrons were fabricated to be as shallow as possible to prevent bubbles from accumulating and disturbing the path of the core, yet deep enough to have a sufficient sheathing effect. In addition, the location of the chevrons downstream of the inlets, as shown in Fig. 1, was a compromise between keeping the fluid path as short as possible (to minimize backpressure and the effects of diffusion) while making the distance between the chevrons and the optical fibers large enough that the chevrons would not scatter stray light back into the detectors.
Performance issues
Minimizing flow fluctuations that would affect the alignment of the core stream in the laser excitation beams was a major concern. The origin of some of the fluctuations was a direct result of the choice of using syringe pumps, which inherently pulse, and using a flexible material, PDMS, to build the cytometer. In all cases possible, rigid materials were used: syringes holding fluids were made of glass, HPLC fittings were used to make rigid and tight connections to the pumps, and rigid PEEK tubing was used to connect the pumps to the device. To minimize disturbances due to abrupt changes in flow channel dimensions, the inner diameter of the tubing (380 μm) used was similar to the channel height (390 μm). Nevertheless, flow fluctuations remained and seemed to originate from the region in the device where the three inlet streams come together (see Fig. 1). The design of this region was modified to obtain a core that was as steady as possible.
In our original designs, the widths of the core and sheath inlet channels were identical. However, because of the extreme differences in the volumetric flow rates of the fluids coming in through the inlet streams, the pressures generated by these streams were quite different. If the backpressure generated by the sheath streams entering the constriction where the streams come together becomes greater than the pressure exerted by the core stream at the point of confluence, the core stream will no longer flow.41 This problem was exacerbated by the flexible PDMS walls, which could pulse as the core stream pushed against them in response to the backpressure from the sheath streams. It was possible to fix this problem by placing a second constriction (~ 40 μm) in the core channel immediately before the location where it combines with the sheath streams (dotted circle in Fig. 1). This created a second region of backpressure on the same order of magnitude as that created by the sheath streams entering the mixing region. By making this design modification, larger differences in volumetric flow rates between the core and sheath streams were implemented without negatively impacting the flow of the sample stream out of the inlet channel and into the main channel.
Performance assessment
For each pulse generated by a microsphere in the interrogation region, there were measurements in four different detection channels. Scattered light collected at 135 degrees relative to the direction of the excitation light was detected at 635 nm, the two microsphere identification wavelengths at 45 degrees were detected at 665 and 700 nm and the phycoerythrin emission at 90 degrees was detected at 565 nm.
Analysis software was written in LabWindows/CVI to detect each pulse generated by the coded microspheres, plot the microsphere identification data on a scatter plot, refine the microsphere identification regions, and output the following pulse information: pulse maximum, pulse area, pulse area/pulse width, and pulse area normalized by the scatter pulse. The phycoerythrin data was pulse area/pulse width, and the bead identification data was the pulse area normalized by the scatter pulse area, which also normalized for pulse width. Since some pulses are wider than others, normalizing the pulse area by pulse width resulted in a more accurate representation of the fluorescence values for each pulse.
To test the ability of the microflow cytometer to distinguish the different microsphere sets and perform an assay on them, microsphere sets were flowed through the microflow cytometer separately while measuring and recording the pulses from the microspheres at the four different wavelengths. Pulses were ~100 μs long and were detected at 26 microspheres/min, approximately 5% of the maximum possible rate at 1% duty cycle. Fig. 5 shows a scatter plot of the microsphere identification channels for sets 50, 73, 77 and 81. Comparing Fig. 5a with 5b, it appears that normalizing by the scatter channel is essential for separating the clusters. Since there is some variation in the excitation of the microspheres due to the Gaussian output of the fibers and the position of the microspheres in relation to the excitation beam, and since the fluorescence intensity is proportional to the excitation intensity, normalizing by the scatter signal reduces the spread of each cluster.
Fig. 5.

Microsphere identification plot. (a) Shown are the coded microsphere sets 50 (○), 73 (△), 77 (▽), and 81 (□). Each point represents the pulse area normalized by its width for the 665 and 700 nm microsphere identification wavelengths detected for each pulse that was over threshold. (b) Data from (a) normalized using the light scatter signal for each microsphere. Set 77 had phycoerythrin attached to the microspheres.
One contribution to the excitation variability is the size of the fluid core used in these experiments (43 × 34 μm) and its geometric relationship with the NA of the optical fibers. Since the fiber NA has a roughly Gaussian intensity cross-section, microspheres that are in the middle of the core will receive brighter illumination than those at the upper or lower edges of the core, yielding the variation along a 45 degree diagonal shown in Fig. 5. Any offset or misalignment in the optical fibers will exaggerate this phenomenon and reduce the efficiency of the scatter data for normalization. To reduce this variation, the fiber used for exciting the microsphere identification fluorescence was single mode, which has a smaller NA.
Phycoerythrin excites at 532 nm and emits between 550 and 600 nm. Signal at 565 nm was measured for each of the microsphere sets. Unlike the microsphere identification data, the phycoerythrin data was not normalized by the scatter data for 2 reasons, 1) the collected scatter data was not measured using the phycoerythrin excitation wavelength, and 2) the 532 nm phycoerythrin excitation was delivered to the core at a different angle of incidence than the 635 nm excitation. Fig. 6 shows the phycoerythrin signal for each coded microsphere set tested. This data, together with the data in Fig. 5, demonstrated the capability for detecting bound antigen and identifying the microsphere sets.
Fig. 6.

Phycoerythrin detection results. Shown is the mean and standard deviation of the phycoerythrin signal for each microsphere set tested. Signal was the area under each pulse normalized by the pulse width.
Assays for E. coli were performed using the microflow cytometer and the Luminex 100. Bead sets 50, 73 and 98 were functionalized with irrelevant capture antibodies, while bead set 81 had IgG specific for E. coli. After incubation with E. coli concentrations of 107, 106, 105, 104, and 0 cfu/ml, sandwich assays were performed with phycoerythrin as the fluorescent indicator. Each sample consisted of a mixture of the microspheres treated with one of the concentrations of E. coli. To narrow the core stream even more for the E. coli assays, a higher flow rate of 200 μl/min was used for the flow in each sheath inlet. The core size was reduced to 20 × 34 μm. Fig. 7 is the bead identification plot, and Fig. 8 shows the phycoerythrin signal from each microsphere set for each concentration of E. coli tested. The same samples were run on the Luminex 100. For comparison, phycoerythrin signal from coded microsphere set 81 using both the microflow cytometer and the Luminex system are shown in Fig. 9. For the microflow cytometer, data from pulses with pulse widths outside the nominal range (2–6 samples) were excluded. Also excluded were pulses that had a scatter signal at 10 V, the maximum output of the PMTs. These data were considered invalid, as they most likely were generated by microsphere aggregates or debris. The microflow cytometer easily detected 105 cfu/ml E. coli, and the assay results shown in Fig. 9 reveal that the microflow cytometer and the Luminex 100 produce similar dose-response curves with this particular antibody-antigen pair.
Fig. 7.

Microsphere identification plots for E. coli assays. Shown are the coded microsphere sets 50 (○), 73 (△), 81 (□) and 98 (▽), for the 107 cfu/ml sample on the (a) Microflow cytometer. Bead identification signal was pulse area normalized by scatter. Microsphere set 81 had anti-E.coli attached to the microspheres (b) bead identification from the Luminex for the same microsphere sets.
Fig. 8.

Results from E. coli assays. The fluorescence pulse from each microsphere was integrated and normalized by pulse width. Shown are the mean and standard deviation for the fluorescence signals from microsphere sets 50 (black), 73 (medium gray), 81 (dark gray) and 98 (light gray) for each concentration tested. Microsphere set 81 (dark gray) had anti-E.coli attached to the microspheres.
Fig. 9.

The E. coli assays were performed on the microflow cytometer and Luminex systems. Shown is the mean and standard deviation of the (a) fluorescence signal integrated and normalized by pulse width from the microflow cytometer and (b) results from the Luminex system using the same samples.
Conclusions
A flow cytometer based on a grooved microfluidic channel for generating sheath flow and inserted optical fibers for interrogating particles in the sample demonstrated the capability to distinguish coded microsphere sets. The fabrication of these devices is very simple since all features except the bottom chevrons are in a single PDMS layer. Two-color excitation and signal collection at four different wavelengths measured the signature of individual coded microspheres passing through the interrogation region. In addition to identifying each microsphere based on two fluorescent colors (665 nm and 700 nm), the cytometer could detect fluorescence from antibody-antigen reactions at the microsphere surface, resulting in a dose-response similar to a commercial Luminex 100 flow cytometer. These studies demonstrate proof-of-principle capability for performing multiplexed assays, and show promise for applications of this microflow cytometer design in miniaturized, automated, point-of-care instrumentation.
Acknowledgments
The work presented here was performed under NIH grant UO1 AI075489 and ONR/NRL 6.2 work unit 6336. The authors would like to thank Ron Hui for his help in developing the first preliminary prototype of the microflow cytometer. The views presented here are those of the authors and do not represent the opinion or policy of the National Institutes of Health, Department of Health and Human Services, US Navy, or Department of Defense.
References
- 1.Shapiro HM. Practical flow cytometry. John Wiley and Sons; Hoboken, NJ: 2003. [Google Scholar]
- 2.Fulton RJ, McDade RL, Smith PL, Kienker LJ, Kettman JR. Clinical Chemistry. 1997;43:1749–1756. [PubMed] [Google Scholar]
- 3.Pattanapanyasat K, Phuang-Ngern Y, Lerdwana S, Wasinrapee P, Sakulploy N, Noulsri E, Thepthai C, McNicholl JM. Cytometry Part B-Clinical Cytometry. 2007;72B:387–396. doi: 10.1002/cyto.b.20167. [DOI] [PubMed] [Google Scholar]
- 4.http://www.guavatechnologies.com/cm/Home.html.
- 5.http://www.luminexcorp.com.
- 6.McBride MT, Masquelier D, Hindson BJ, Makarewicz AJ, Brown S, Burris K, Metz T, Langlois RG, Tsang KW, Bryan R, Anderson DA, Venkateswaran KS, Milanovich FP, Colston BW. Analytical Chemistry. 2003;75:5293–5299. doi: 10.1021/ac034722v. [DOI] [PubMed] [Google Scholar]
- 7.Olson RJ, Shalapyonok A, Sosik HM. Deep-Sea Research Part I-Oceanographic Research Papers. 2003;50:301–315. [Google Scholar]
- 8.Eyal S, Quake SR. Electrophoresis. 2002;23:2653–2657. doi: 10.1002/1522-2683(200208)23:16<2653::AID-ELPS2653>3.0.CO;2-H. [DOI] [PubMed] [Google Scholar]
- 9.Jacobson SC, Ramsey JM. Analytical Chemistry. 1997;69:3212–3217. doi: 10.1021/ac970192p. [DOI] [PubMed] [Google Scholar]
- 10.Schrum DP, Culbertson CT, Jacobson SC, Ramsey JM. Analytical Chemistry. 1999;71:4173–4177. doi: 10.1021/ac990372u. [DOI] [PubMed] [Google Scholar]
- 11.McClain MA, Culbertson CT, Jacobson SC, Ramsey JM. Analytical Chemistry. 2001;73:5334–5338. doi: 10.1021/ac010504v. [DOI] [PubMed] [Google Scholar]
- 12.Blankenstein G, Larsen UD. Biosensors & Bioelectronics. 1998;13:427–438. [Google Scholar]
- 13.Chang CM, Hsiung SK, Lee GB. Japanese Journal of Applied Physics Part 1-Regular Papers Brief Communications & Review Papers. 2007;46:3126–3134. [Google Scholar]
- 14.Chung S, Park SJ, Kim JK, Chung C, Han DC, Chang JK. Microsystem Technologies-Micro-and Nanosystems-Information Storage and Processing Systems. 2003;9:525–533. [Google Scholar]
- 15.Stiles T, Fallon R, Vestad T, Oakey J, Marr DWM, Squier J, Jimenez R. Microfluidics and Nanofluidics. 2005;1:280–283. [Google Scholar]
- 16.Sundararajan N, Pio MS, Lee LP, Berlin AA. Journal of Microelectromechanical Systems. 2004;13:559–567. [Google Scholar]
- 17.Simonnet C, Groisman A. Analytical Chemistry. 2006;78:5653–5663. doi: 10.1021/ac060340o. [DOI] [PubMed] [Google Scholar]
- 18.Simonnet C, Groisman A. Applied Physics Letters. 2005:87. [Google Scholar]
- 19.Chang CC, Huang ZX, Yang RJ. Journal of Micromechanics and Microengineering. 2007;17:1479–1486. [Google Scholar]
- 20.Goranovic G, Perch-Nielsen IR, Larsen UD, Wolff A, Kutter JP, Telleman P. Proc Modeling and Simulation of Microsystems. 2001:242–245. [Google Scholar]
- 21.Wolff A, Perch-Nielsen IR, Larsen UD, Friis P, Goranovic G, Poulsen CR, Kutter JP, Telleman P. Lab on a Chip. 2003;3:22–27. doi: 10.1039/b209333b. [DOI] [PubMed] [Google Scholar]
- 22.Yang R, Feeback DL, Wang WJ. Sensors and Actuators a-Physical. 2005;118:259–267. [Google Scholar]
- 23.Klank H, Goranovic G, Kutter JP, Gjelstrup H, Michelsen J, Westergaard CH. Journal of Micromechanics and Microengineering. 2002;12:862–869. [Google Scholar]
- 24.Ateya DA, Erickson JS, Howell PB, Hilliard LR, Golden JP, Ligler FS. Analytical and Bioanalytical Chemistry. 2008;391:1485–1498. doi: 10.1007/s00216-007-1827-5. [DOI] [PMC free article] [PubMed] [Google Scholar]
- 25.Howell PB, Jr, Golden JP, Hilliard LR, Erickson JS, Mott DR, Ligler FS. Lab on a Chip. 2008;8:1097–1103. doi: 10.1039/b719381e. [DOI] [PMC free article] [PubMed] [Google Scholar]
- 26.Gorris HH, Blicharz TM, Walt DR. Febs Journal. 2007;274:5462–5470. doi: 10.1111/j.1742-4658.2007.06078.x. [DOI] [PubMed] [Google Scholar]
- 27.LaFratta CN, Walt DR. Chemical Reviews. 2008;108:614–637. doi: 10.1021/cr0681142. [DOI] [PubMed] [Google Scholar]
- 28.Hill HD, Vega RA, Mirkin CA. Analytical Chemistry. 2007;79:9218–9223. doi: 10.1021/ac701626y. [DOI] [PMC free article] [PubMed] [Google Scholar]
- 29.Cheng MMC, Cuda G, Bunimovich YL, Gaspari M, Heath JR, Hill HD, Mirkin CA, Nijdam AJ, Terracciano R, Thundat T, Ferrari M. Current Opinion in Chemical Biology. 2006;10:11–19. doi: 10.1016/j.cbpa.2006.01.006. [DOI] [PubMed] [Google Scholar]
- 30.Michael KL, Taylor LC, Schultz SL, Walt DR. Analytical Chemistry. 1998;70:1242–1248. doi: 10.1021/ac971343r. [DOI] [PubMed] [Google Scholar]
- 31.Anderson GP, Lamar JD, Charles PT. Environmental Science & Technology. 2007;41:2888–2893. doi: 10.1021/es062333n. [DOI] [PubMed] [Google Scholar]
- 32.Holmes D, She JK, Roach PL, Morgan H. Lab on a Chip. 2007;7:1048–1056. doi: 10.1039/b707507n. [DOI] [PubMed] [Google Scholar]
- 33.Nolen BM, Marks JR, Ta’san S, Rand A, Luong TM, Wang Y, Blackwell K, Lokshin AE. Breast Cancer Research. 2008:10. doi: 10.1186/bcr2096. [DOI] [PMC free article] [PubMed] [Google Scholar]
- 34.Duffy DC, McDonald JC, Schueller OJA, Whitesides GM. Analytical Chemistry. 1998;70:4974–4984. doi: 10.1021/ac980656z. [DOI] [PubMed] [Google Scholar]
- 35.Jo BH, Van Lerberghe LM, Motsegood KM, Beebe DJ. Journal of Microelectromechanical Systems. 2000;9:76–81. [Google Scholar]
- 36.Howell PB, Mott DR, Fertig S, Kaplan CR, Golden JP, Oran ES, Ligler FS. Lab on a Chip. 2005;5:524–530. doi: 10.1039/b418243j. [DOI] [PubMed] [Google Scholar]
- 37.Fu LM, Yang RJ, Lin CH, Pan YJ, Lee GB. Analytica Chimica Acta. 2004;507:163–169. [Google Scholar]
- 38.Bernini R, De Nuccio E, Brescia F, Minardo A, Zeni L, Sarro PM, Palumbo R, Scarfi MR. Analytical and Bioanalytical Chemistry. 2006;386:1267–1272. doi: 10.1007/s00216-006-0623-y. [DOI] [PubMed] [Google Scholar]
- 39.Lin YH, Lee GB. Biosensors & Bioelectronics. 2008;24:572–578. doi: 10.1016/j.bios.2008.06.008. [DOI] [PubMed] [Google Scholar]
- 40.Mott DR, Howell PB, Golden JP, Kaplan CR, Ligler FS, Oran ES. Lab on a Chip. 2006;6:540–549. doi: 10.1039/b516459a. [DOI] [PubMed] [Google Scholar]
- 41.Knight JB, Vishwanath A, Brody JP, Austin RH. Physical Review Letters. 1998;80:3863–3866. [Google Scholar]