

Abstract
Introduction
High-field magnetic resonance imaging (MRI) is an emerging technique that provides a powerful, non-invasive tool for in vivo studies of cancer therapy in animal models. Photodynamic therapy (PDT) is a relatively new treatment modality for prostate cancer, the second leading cause of cancer mortality in American males. The goal of this study was to evaluate the response of human prostate tumor cells growing as xenografts in athymic nude mice to Pc 4-sensitized PDT.
Materials and Methods
PC-3, a cell line derived from a human prostate malignant tumor, was injected intradermally on the back flanks of athymic nude mice. Two tumors were initiated on each mouse. One was treated and the other served as the control. A second-generation photosensitizing drug Pc 4 (0.6 mg/kg body weight) was delivered to each animal by tail vein injection 48 hours before laser illumination (672 nm, 100 mW/cm2, 150 J/cm2). A dedicated high-field (9.4 T) small-animal MR scanner was used for image acquisitions. A multi-slice multi-echo (MSME) technique, permitting noninvasive in vivo assessment of potential therapeutic effects, was used to measure the T2 values and tumor volumes. Animals were scanned immediately before and after PDT and 24 hours after PDT. T2 values were computed and analyzed for the tumor regions.
Results
For the treated tumors, the T2 values significantly increased (P < 0.002) 24 hours after PDT (68.2 ± 8.5 milliseconds), compared to the pre-PDT values (55.8 ± 6.6 milliseconds). For the control tumors, there was no significant difference (P = 0.53) between the pre-PDT (52.5 ± 6.1 milliseconds) and 24-hour post-PDT (54.3 ± 6.4 milliseconds) values. Histologic analysis showed that PDT-treated tumors demonstrated necrosis and inflammation that was not seen in the control.
Discussion
Changes in tumor T2 values measured by multi-slice multi-echo MR imaging provide an assay that could be useful for clinical monitoring of photodynamic therapy of prostate tumors.
Keywords: photodynamic therapy, magnetic resonance imaging (MRI), prostate cancer, efficacy assessment, multi-slice multi-echo, tumor treatment monitoring
INTRODUCTION
Photodynamic therapy (PDT) is a novel therapeutic modality for cancer treatment [1]. With PDT, a tumor-localized photosensitizer is irradiated with red light to generate reactive oxygen species that efficiently kills cells and ablates tumors [2]. An important advantage of PDT is that both the photosensitizer and the light are inert by themselves, and the light can be precisely delivered to a selected region, allowing extreme specificity in the localization of the photodynamic effect. Consequently, side effects are minimized. PDT with Photofrin® is US-FDA approved for treating early and advanced lung cancer, advanced esophageal cancer, and Barrett's esophagus [1,3]. PDT with new second-generation photosensitizers is being evaluated for treating a variety of cancers, including prostate cancer [1,3].
Prostate cancer is the second leading cause of cancer mortality in American males [4]. The current therapy options for patients with clinically localized prostate cancer are: (a) radical prostatectomy; (b) external beam radiation therapy; and (c) interstitial brachytherapy. These methods can have serious side effects such as incontinence and sexual dysfunction [5]. If radiation therapy fails, there are currently only a limited number of salvage options available for treatment of recurrent prostate cancer [5,6]. Therefore, new treatment methods are of great potential value. PDT may be an ideal salvage treatment modality for recurrent localized prostate cancer. PDT can be administered deep into tumors using minimally invasive techniques, as only the small laser fibers that deliver the light to the tumor need to be inserted into the lesions. Currently, second-generation photosensitizing drugs such as Pc 4 [7], motexafin lutetium (Lu-Tex) [8-10], Pd-bacteriopheophorbide (TOOKAD) [11,12], aminolevulinic acid (ALA) [13-15], mTHPC [16,17], and SnET2 [18,19] are being studied for treating prostate cancer.
Magnetic resonance imaging (MRI) and MR spectroscopy (MRS) techniques have already proven to be a useful tool for assessing PDT efficacy. First, MRI has been used to evaluate PDT-induced vascular damage followed by hemorrhagic necrosis in murine M1 tumors in mice [20]. Blood oxygenation level-dependent (BOLD) contrast MRI shows attenuation (25−40%) of the MR signal at the treated tumor site [21]. Decreases in contrast agent uptake rates following PDT were observed by gadolinium-contrast MRI [22]. Gadolinium diethylenetriamene pentaacetate (DTPA) contrast-enhanced MRI was used to assess the boundary of PDT-induced tissue necrosis in a canine model [23] and in human patients [24]. Second, in vivo 31P nuclear magnetic resonance (NMR) spectroscopy has been used to monitor tumor metabolic status before and after the treatment of RIF-1 tumors [25,26] and mammary carcinoma [27-30]. NMR data analysis revealed significant differences in the time course of changes in high energy phosphate levels in response to combined hyperthermia and photodynamic therapies [29]. It was also demonstrated that there is a relationship between NMR measurements immediately following PDT and the ultimate effect on the tumor [26]. Third, diffusion-weighted MRI showed a biphasic change in the apparent diffusion coefficient (ADC) within the first 24 hours post-PDT, indicating the early response of PC-14 tumors to PDT [11].
In our previous study, we used both MRI and positron emission tomography (PET) to image C3H mice bearing RIF-1 tumors after PDT [31,32]. PET with 18F-fluorodeoxyglucose (FDG) provided metabolic information of the tumors. High-resolution MRI provided information on anatomical and morphological changes in the lesions. Registration methods were developed to combine MRI and PET images for improved tumor monitoring. Fusion of MRI and PET images provided both anatomical and functional information about the tumors for evaluating PDT effects. We found that the tumor FDG uptake decreased immediately after successful PDT [31,32].
In the present study, we focused on high-field small-animal MR imaging for monitoring the early response of prostate cancer to PDT. To the best of our knowledge, this is the first study on in vivo imaging for Pc 4-based PDT of prostate cancer. The overall goal is to develop non-invasive imaging and quantitative analysis techniques to identify the subtle changes that occur 24 hours after PDT for evaluating therapeutic efficacy.
MATERIALS AND METHODS
Pc 4 Formulation
We use a second-generation photosensitizing drug, the silicon phthalocyanine Pc 4, [HOSiPcOSi(CH3)2(CH2)3N(CH3)2], that was developed and evaluated for treating a variety of cancers at Case Comprehensive Cancer Center. The chemical synthesis of Pc 4 was described earlier [33]. Pc 4 was obtained from Dr. Malcolm E. Kenney, Chemistry Department, Case Western Reserve University. A stock solution (1 mg/ml) was made by dissolving Pc 4 in 50% Cremophor EL, 50% absolute ethanol, then adding 9 volumes of normal saline with mixing. For injection, the Pc 4 stock solution was mixed with an equal volume of 5% Cremophor EL, 5% ethanol, and 90% saline to give a final concentration of 0.05 mg/ml (0.07 mM).
Tumor Model
The PC-3 cell line is derived from a primary malignant human prostate tumor [34]. PC-3 cells were grown as monolayers in E-MEM supplemented with 15% fetal bovine serum at 37°C. Cells were harvested by trypsinization in ethylenediaminetetraacetic acid/trypsin, washed in Hank's balanced salt solution (HBSS) without Ca2+ and Mg2+, and centrifuged at 150g for 5 minutes. Cells were counted in a hemacytometer using 0.4% trypan blue, and the cell suspension was brought to a final concentration of 1 × 10⁶ cells/ml and kept on ice for immediate injection.
The study was conducted with the approval of the Institutional Animal Care and Use Committee (IACUC) of Case Western Reserve University and conformed to the guidelines of the National Institutes of Health for the care and use of laboratory animals. Male athymic nude mice of 4−8 weeks old were obtained from the Case Comprehensive Cancer Center Athymic Animal Facility (Case Western Reserve University, Cleveland, Ohio) and housed under pathogen-free conditions. They were maintained under controlled conditions (12-h dark–light cycles; temperature 20−24°C) with free access to sterilized mouse chow. Two tumors were initiated in each mouse by injection of 50 μl containing 5 × 10⁴ PC-3 cells intradermally on each flank at least 20 mm apart and as far from the lung and heart as possible to minimize motion effects in MRI.
Experimental Protocol
Tumors were treated and imaged when they reached 8−10 mm in diameter, which typically required 2−4 weeks after implantation. A volume of Pc 4 solution was injected intravenously into the tail vein to give 0.6 mg/kg (e.g., 240 μl to a 20 g mouse), a dose that we found to be optimal in another xenograft model (OVCAR-3 ovarian epithelial carcinoma) [35]. Appropriate controls of photosensitizer without light or light without photosensitizer produced no response. Forty-eight hours after photosensitizer injection, the animals were taken to the small-animal imaging facility for imaging and PDT. For PDT, a diode laser (Applied Optronics Corp., Newport, CT) delivered 672-nm light, the longest wavelength absorption maximum of Pc 4. The laser was coupled to a fiber optic cable terminating in a microlens. The treatment light covered the entire tumor and was distributed uniformly throughout the treatment field. One of the two tumors on each animal was irradiated with a fluence of 150 J/cm2 and an irradiance of 100 mW/cm2, that has been shown to produce a complete response and some cures in other tumor models [35]. The low power of the laser light precludes thermal effects. The other tumor in each animal served as a control (receiving photosensitizer but no light). Mice were euthanized 24 hours after PDT to measure early histologic responses to Pc 4-PDT. The tumors were harvested and immediately stored in 10% formalin before histologic processing. A total of 13 tumor-bearing animals were treated and imaged in this study. Each mouse had two tumors, but mice 1 and 7 each had a small control tumor. Therefore, data were obtained from only 24 tumors.
MRI
Forty-eight hours after photosensitizer injection, high-resolution MR images were acquired from each mouse preand post-PDT, and an additional MR image was obtained 24 hours after PDT. The mice were imaged immediately after light treatment and 24 hours later, because our research focuses on detecting the early tumor response to PDT. The mouse MR images were acquired using a high-field (9.4-T) small-animal MR scanner (Bruker BioSpin GmbH, Rheinstetten, Germany). A dedicated whole body mouse coil was used for the image acquisitions. During each imaging session, the animals were placed on a plastic holder and were provided with a continuous supply of 2% isoflurane (EZAnesthesia, Palmer, PA) in air. To minimize motion artifacts, we used respiration-gated MR image acquisitions. Animals’ respiration rates and core-body temperatures were monitored throughout the entire experiments; temperature was maintained via a feedback system that provided warm air to the bore of the magnet. Typically, the respiration rate was maintained at 40/min, and the core-body temperature was maintained between 35 and 37°C.
Images with varying echo times (TEs) were then obtained using a commercial multi-slice multi-echo (MSME) sequence to enable T2 calculation. Two sets of imaging parameters were used. First, MR images were obtained at four different echo-times (27.85, 55.71, 83.56, and 111.42 milliseconds) in one single acquisition (TR = 6,929 milliseconds, field of view 7.50 cm × 3.75 cm, matrix size 256 × 128, slice thickness 0.5 mm, receiver bandwidth 30.864 kHz, 1 average). Typically, 15−20 coronal slices were acquired to cover the two tumors. The total scan time to simultaneously acquire the four T2-weighted images was 14 minutes 47 seconds. These MR parameters were used for mice 1−6. Then, we used another set of echo times (10.25, 20.50, 30.75, and 41.00 milliseconds) for a shorter acquisition time. Other parameters were modified accordingly (TR = 1,250 milliseconds, field of view 3.5 cm × 3.5 cm, matrix size 128 × 128, slice thickness 0.5 mm, receiver bandwidth 25 kHz, 1 average). The total scan time for the four T2-weighted images acquired simultaneously was 2 minutes 43 seconds, which was much shorter than that using the first set of MR parameters. We used the second set of MR parameters for mice 7−13. Although two sets of imaging parameters were used for the image acquisitions, they were from the same MR imaging sequence, that is, MSME sequence that was a standard MR imaging sequence installed in the MR scanner by the manufacturer. No variation was detected in T2 calculations on the same tissues using the different MSME echo times (data not shown).
Image and Data Analysis
We performed quantitative image analysis for the MSME images. First, we used the MSME images to generate T2 maps by performing a linear least squares fit to the semilogarithm at each voxel, as described below:
where S0 and S are the initial signal and signal at echo time TE, respectively. We used the software package Paravision 3.1 (Bruker BioSpin GmbH) to compute the T2 maps. Second, we manually segmented the tumor on each slice of the MSME image volumes. We used commercial image analysis software, Analyze (AnalyzeDirect, Inc., Overland Park, KS), for the segmentation. On the T2-weighted MR images, the tumor appeared as a bright region. One author manually drew the boundary of the tumor on the image and then saved the object map of the tumor. Another author examined the image independently and loaded the object map to verify the segmentation. The object map was edited if the two authors agreed to make the change. The final boundaries of the segmented tumor were saved and copied to the corresponding T2 map. The T2 value for each voxel was determined within the tumor region. Third, we calculated the histogram, mean, and standard deviation of the T2 maps. We compared the mean T2 values for the treated and control tumors.
Histologic Analysis
Histologic analyses were performed at the Case Comprehensive Cancer Center Histology Core Facility. We dissected the prostate tumors 1−7 days after PDT. Sixteen tumors (9 PDT-treated, 7 control) were harvested 24 hours after PDT and 8 tumors (4 PDT-treated, 4 control) were dissected 7 days after PDT. Excised tissues were fixed in a large volume of 10% formalin for a minimum of one day to allow complete tissue fixation. Subsequently, the tissue was sectioned along approximately the same plane as the coronal MR images to permit correlation of histologic and MR images. All tumors were stained with hematoxylin and eosin (H&E) for histopathologic assessment of tumor features. Tissue sections of the entire specimen were then examined with an Olympus BX40 microscope at magnifications ranging from 40 × to 400 × by a pathologist specially trained in genitourinary pathology.
Statistical Analysis
Statistical analyses were performed to compare the T2 values obtained at three different time points (pre-PDT, post-PDT, and 24-hour after PDT). We used Microsoft Excel 2007 (Microsoft, Seattle, WA) to compute a two-tailed two-sample Student's t-test for the T2 values. A P-value ≤0.05 was assigned statistical significance.
RESULTS
Figure 1a,b shows MR images of a tumor-bearing mouse pre-PDT and 24 hours after PDT. The treated and control tumors are clearly delineated on the images. The signal intensity values changed 24 hours after the treatment. The MR images were used to calculate T2 maps (Fig. 1c,d). Compared to the T2 map before PDT, the T2 values of the treated tumor increased 24 hours after PDT. After the treatment, inflammation at the tumor region and the surrounding tissues was observed. On both the MR images and the T2 maps, visible intensity variation was also observed within the treated tumor indicating possible heterogeneity of the tumor response to the therapy. On the 24-h T2 map, the intensity also increased at other regions outside of the tumor; it is likely the intensity increases in the peritumoral area are due to inflammation, which is known to result from PDT [36].
Fig. 1.
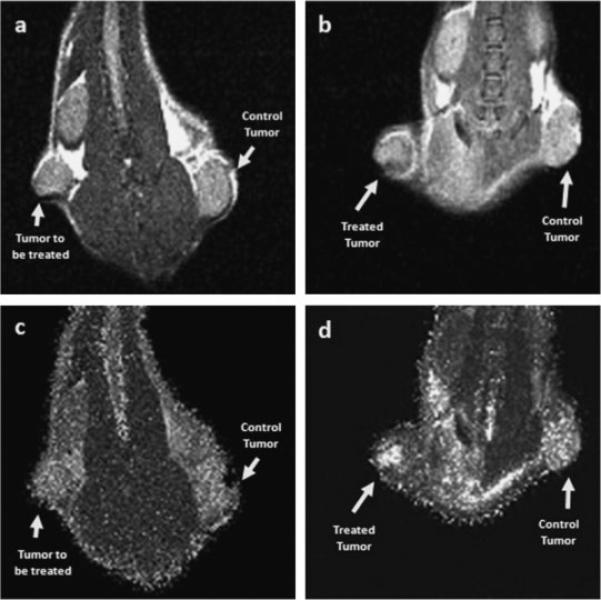
MR images of a tumor-bearing mouse (M10) pre-PDT (a) and 24 hours after PDT (b). The images were acquired using a multi-slice multi-echo (MSME) MR sequence with the following imaging parameters: TE = 10.25, 20.50, 30.75, and 41.00 milliseconds; TR = 1,280 milliseconds; FOV = 3.5 cm × 3.5 cm; Matrix size: 128 × 128. The MR images shown here were reconstructed from the first echo. The signal intensity values changed 24 hours after the treatment. MR images from four echoes were used to calculate T2 maps. Compared to the T2 map before PDT (c), the T2 values increased 24 hours after the treatment (d), especially within the treated tumor (arrow).
Figure 2 shows the T2 histograms of the treated and control tumors pre-PDT, immediately post-PDT, and 24 hours after PDT. For the treated tumors, the T2 histogram shifted to the right 24 hours after the treatment, indicating increases in the T2 values within the treated tumor. The T2 histograms of the control tumor did not demonstrate significant changes immediately or 24 hours after PDT as compared to the pre-PDT values. It should also be noted that the T2 histogram of the treated tumor immediately after PDT shows increased numbers of voxels with low T2 values. One possibility is that the level of deoxyhemoglobin was changed immediately upon PDT, as has been observed by others [21].
Fig. 2.

Histograms of the T2 values over the tumor regions pre-PDT, post-PDT and 24 hours after PDT. a: For the treated tumor, the T2 histogram shifted to the right 24 hours after the treatment, indicating increases in the T2 values. b: For the control tumor, the T2 histograms did not demonstrate significant change pre-PDT, post-PDT and 24 hours after PDT. The treated and control tumors were for the same mouse (M2).
Figure 3 shows the mean T2 values for the 13 treated mice. For the treated tumors, the mean T2 values are 55.8 ± 6.6 and 68.2 ± 8.5 milliseconds pre-PDT and 24 hours after PDT, respectively, and are significantly different (P < 0.0002). For the control tumors, the mean T2 values are 52.5 ± 6.1 and 54.3 ± 6.4 milliseconds pre-PDT and 24-hour after PDT, respectively, which are not significantly different (P = 0.53). For both treated and control tumors, there was no significant difference between the T2 values obtained pre-PDT and immediately post-PDT (Data not shown).
Fig. 3.
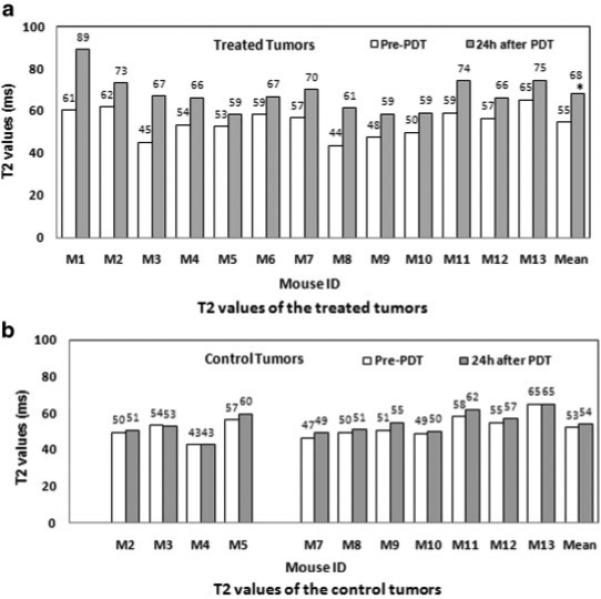
T2 values of the treated and control tumors for 13 mice (M1-M13). a: For the treated tumors, the mean T2 values are 55.8 ± 6.6 and 68.2 ± 8.5 milliseconds pre-PDT and 24 hours after PDT, respectively. An asterisk is placed at the mean T2 value of treated tumors and the T2 values are significantly different for these two time points (P < 0.0002). b: For the control tumors, the mean T2 values are 52.5 ± 6.1 and 54.3 ± 6.4 milliseconds pre-PDT and 24 hours after PDT, respectively. M1 and M6 each had a small control tumor, which was not included in this study. There is no significant difference between the T2 values at the two time points studied (P = 0.53).
Figure 4 shows histologic images of treated and control tumors. These images are typical of those obtained from the other tumors. An inflammatory response with edema was observed in the treated tumor, which was not seen within the control tumor. The treated tumor cells were massively damaged by the PDT and the tissues became necrotic. Substantial intra-tumor variation in response to the treatment was also observed. Factors that may contribute to the heterogeneity of the tumor response include variations in drug distribution within the tumor, oxygen supply from the microvasculature system and laser light distribution. As shown above on the MR images and the T2 maps, we also observed variations in intensity within the tumor. Thus, the MR images are consistent with the histologic findings. The most likely explanation is that the biological effects of the treatment result in altered water distribution within the treated tissue, including substantial edema, which contributes to changes in the T2 values.
Fig. 4.

Histologic images of treated and control tumors from a representative mouse (M7) 24 hours after PDT. An inflammatory response with edema was observed in the treated tumor (a), which was not seen within the control tumor (b). The rectangular areas on images (a) and (b) are magnified and shown in images (c) and (d), respectively. On image (c), massive areas of tumor cells were damaged by PDT, and the tissues became necrotic. However, the control tumor cells were intact (d). The laser light was focused approximately perpendicular to the plane of the tissue slice. The two tumors were from the same mouse (M7).
DISCUSSION
We developed small-animal MR imaging and analysis methods for non-invasively assessing the efficacy of PDT of prostate cancer in mice. To the best of our knowledge, this is the first study demonstrating an effect of Pc 4-PDT for human prostate cancer (PC-3) in an animal model, which is detectable with imaging at an early stage. Our preliminary results show that high-resolution MSME MR images may be able to reveal tumor response to the therapy 24 hours after the treatment. For treated tumors, the T2 values significantly increased 1 day after treatment, whereas no significant difference in T2 values was observed in the untreated tumor at the same time. Histologic images verified the therapeutic effect on the treated tumors. The MR imaging parameter (T2 value) may provide a useful tool to monitor early tumor response and to determine the effectiveness of the treatment regimen.
The targets of PDT include tumor cells and cells of and within tumor microvasculature, and photodynamic damage to these targets leads to direct tumor cell death and to inflammatory and immune responses by the host. PDT effects on all these targets may influence each other, producing a plethora of responses; the relative importance of each for the overall tumor response has yet to be fully defined and may differ for different tumor types [3]. The photosensitizer Pc 4 localizes in and has a major influence on mitochondria, and Pc 4-PDT produces cytotoxic reactive oxygen species which lead to cell apoptosis and necrosis [2]. Rapid tumor responses to Pc 4-PDT include acute edema and inflammation a few hours after the treatment. PDT-induced lesions are characterized by marked necrosis a few days after therapy. Given the mechanism of action of PDT with photosensitizers such as Pc 4, one might expect alterations in MR imaging parameters in the treated area based on increased water content from edema, vascular occlusion and necrosis. As shown on the histologic images (Fig. 4), there are massive areas of inflammation and necrosis within the treated tumor. T2-weighted MR imaging is sensitive to alterations in tissue water content. The change of T2 values 1 day after PDT may be related to the increased edema and the changes of water distribution in the treated tissues, consistent with necrosis and inflammation.
Conclusions from our data are limited in several ways. Results from tumor xenografts in mice may not extrapolate directly to human cancers. The mouse study was performed in a high-field (9.4 T) MR scanner. Human MRI is typically performed at field strengths between 1.5 and 3.0 T. Although T1 and T2 MR relaxation times depend on the field strength, the field strength dependence of T2 is much less than that of T1. However, due to field strength and species differences, one should anticipate different T2 values when translating the study from mouse to human. More importantly, it is likely that the therapy-induced change in T2 rather than the absolute value is what is important. Moreover, tumors in our study were implanted in athymic mice, which do not exhibit the expected immune response of a human patient. We have not evaluated the tumors more than 7 days after PDT, as we focused on early tumor response to Pc 4-PDT in this study. Delayed T2 changes, for example, more than 1 week after treatment, may be different. It is likely that the timing of post-therapy imaging will be an important factor in the usefulness of MR imaging in monitoring therapeutic response. Notwithstanding these limitations, our results indicate MR imaging parameters may be related to intratumor properties altered by PDT in an animal model.
The imaging and analysis methods may provide a useful tool to monitor tumor response to PDT, to study therapeutic mechanisms, and to evaluate new PDT drugs. Potential clinical applications of the imaging technique include PDT efficacy assessment and prediction of long-term tumor cure or regrowth.
ACKNOWLEDGMENTS
This work was partially supported by NIH grant R21CA120536 (PI: B. Fei), by a Pilot Grant from the Case Comprehensive Cancer Center (PI: B. Fei), and by Case Western Reserve University Presidential Research Initiative Award (PI: B. Fei). The imaging facility was partially supported by the Northeastern Ohio Animal Imaging Resource Center, as funded by NIH/NCI grant R24CA110943 (PI: J.L. Duerk). Cell culture supporting the animal study was partially funded by NIH/NCI grant R01CA083917 (PI: N.L. Oleinick). The authors thank Dr. Malcolm E. Kenney for providing the Pc 4, John Mulvihill and Xiang Chen for assistance with the animal experiments, and Dr. Thomas G. Pretlow, Dr. Gregory MacLennan, and Nancy Edgehouse for histologic processing of the tissues.
Contract grant sponsors: NIH/National Cancer Institute (R21CA120536, R01CA083917 and R24CA110943) and Case Western Reserve University (Presidential Research Initiative Award and Case Comprehensive Cancer Center Pilot Project Award).
REFERENCES
- 1.Dougherty TJ. An update on photodynamic therapy applications. J Clin Laser Med Surg. 2002;20:3–7. doi: 10.1089/104454702753474931. [DOI] [PubMed] [Google Scholar]
- 2.Oleinick NL, Morris RL, Belichenko I. The role of apoptosis in response to photodynamic therapy: What, where, why, and how. Photochem Photobiol Sci. 2002;1:1–21. doi: 10.1039/b108586g. [DOI] [PubMed] [Google Scholar]
- 3.Dougherty TJ, Gomer CJ, Henderson BW, Jori G, Kessel D, Korbelik M, Moan J, Peng Q. Photodynamic therapy. J Natl Cancer Inst. 1998;90:889–905. doi: 10.1093/jnci/90.12.889. [DOI] [PMC free article] [PubMed] [Google Scholar]
- 4.Jemal A, Siegel R, Ward E, Murray T, Xu J, Smigal C, Thun MJ. Cancer statistics, 2006. CA Cancer J Clin. 2006;56:106–130. doi: 10.3322/canjclin.56.2.106. [DOI] [PubMed] [Google Scholar]
- 5.Trojan L, Kiknavelidze K, Knoll T, Alken P, Michel MS. Prostate cancer therapy: Standard management, new options and experimental approaches. Anticancer Res. 2005;25:551–561. [PubMed] [Google Scholar]
- 6.Zhu TC, Glatstein E, Hahn SM, Dimofte A, Finlay JC, Stripp D, Busch T, Miles J, Whittington R, Malkowicz SB, Tochner Z. Optical properties of human prostate at 732 nm measured in vivo during motexafin lutetium-mediated photodynamic therapy. Photochem Photobiol. 2004;81:96–105. doi: 10.1562/2004-06-25-RA-216. [DOI] [PMC free article] [PubMed] [Google Scholar]
- 7.Fei B, Wang H, Meyers J, Feyes D, Mulvihill J, Oleinick N, Edgehouse N, Pretlow T. In vivo small animal imaging for early assessment of therapeutic efficacy of photodynamic therapy for prostate cancer. Proc SPIE Med Imaging: Physiol Funct Struct Med Images. 2007;6511:1–8. doi: 10.1117/12.708718. [DOI] [PMC free article] [PubMed] [Google Scholar]
- 8.Yu G, Durduran T, Zhou C, Zhu TC, Finlay JC, Busch TM, Malkowicz SB, Hahn SM, Yodh AG. Real-time in situ monitoring of human prostate photodynamic therapy with diffuse light. Photochem Photobiol. 2006;82:1279–1284. doi: 10.1562/2005-10-19-RA-721. [DOI] [PubMed] [Google Scholar]
- 9.Hsi RA, Kapatkin A, Strandberg J, Zhu T, Vulcan T, Solonenko M, Rodriguez C, Chang J, Saunders M, Mason N, Hahn S. Photodynamic therapy in the canine prostate using motexafin lutetium. Clin Cancer Res. 2001;7:651–660. [PubMed] [Google Scholar]
- 10.Zhu TC, Hahn SM, Kapatkin AS, Dimofte A, Rodriguez CE, Vulcan TG, Glatstein E, Hsi RA. In vivo optical properties of normal canine prostate at 732 nm using motexafin lutetium-mediated photodynamic therapy. Photochem Photobiol. 2003;77:81–88. doi: 10.1562/0031-8655(2003)077<0081:ivopon>2.0.co;2. [DOI] [PubMed] [Google Scholar]
- 11.Plaks V, Koudinova N, Nevo U, Pinthus JH, Kanety H, Eshhar Z, Ramon J, Scherz A, Neeman M, Salomon Y. Photodynamic therapy of established prostatic adenocarcinoma with TOOKAD: A biphasic apparent diffusion coefficient change as potential early MRI response marker. Neoplasia. 2004;6:224–233. doi: 10.1593/neo.3352. [DOI] [PMC free article] [PubMed] [Google Scholar]
- 12.Weersink RA, Bogaards A, Gertner M, Davidson SR, Zhang K, Netchev G, Trachtenberg J, Wilson BC. Techniques for delivery and monitoring of TOOKAD (WST09)-mediated photodynamic therapy of the prostate: Clinical experience and practicalities. J Photochem Photobiol B. 2005;79:211–222. doi: 10.1016/j.jphotobiol.2005.01.008. [DOI] [PubMed] [Google Scholar]
- 13.Zaak D, Sroka R, Stocker S, Bise K, Lein M, Hoppner M, Frimberger D, Schneede P, Reich O, Kriegmair M, Knuchel R, Baumgartner R, Hofstetter A. Photodynamic therapy of prostate cancer by means of 5-aminolevulinic acid-induced protoporphyrin IX—In vivo experiments on the dunning rat tumor model. Urol Int. 2004;72:196–202. doi: 10.1159/000077114. [DOI] [PubMed] [Google Scholar]
- 14.Xiao Z, Tamimi Y, Brown K, Tulip J, Moore R. Interstitial photodynamic therapy in subcutaneously implanted urologic tumors in rats after intravenous administration of 5-amino-levulinic acid. Urol Oncol. 2002;7:125–132. doi: 10.1016/s1078-1439(01)00184-3. [DOI] [PubMed] [Google Scholar]
- 15.Chang SC, Buonaccorsi GA, MacRobert AJ, Bown SG. Interstitial photodynamic therapy in the canine prostate with disulfonated aluminum phthalocyanine and 5-amino-levulinic acid-induced protoporphyrin IX. Prostate. 1997;32:89–98. doi: 10.1002/(sici)1097-0045(19970701)32:2<89::aid-pros3>3.0.co;2-a. [DOI] [PubMed] [Google Scholar]
- 16.Moore CM, Nathan TR, Lees WR, Mosse CA, Freeman A, Emberton M, Bown SG. Photodynamic therapy using meso tetra hydroxy phenyl chlorin (mTHPC) in early prostate cancer. Lasers Surg Med. 2006;38:356–363. doi: 10.1002/lsm.20275. [DOI] [PubMed] [Google Scholar]
- 17.Chang SC, Chern IF, Hsu YH. Biological responses of dog prostate and adjacent structures after meso-tetra-(m-hydroxyphenyl) chlorin and aluminum disulfonated phthalocyanine based photodynamic therapy. Proc Natl Sci Counc Repub China B. 1999;23:158–166. [PubMed] [Google Scholar]
- 18.Jankun J, Keck RW, Skrzypczak-Jankun E, Lilge L, Selman SH. Diverse optical characteristic of the prostate and light delivery system: Implications for computer modelling of prostatic photodynamic therapy. BJU Int. 2005;95:1237–1244. doi: 10.1111/j.1464-410X.2005.05512.x. [DOI] [PubMed] [Google Scholar]
- 19.Lilge L, Pomerleau-Dalcourt N, Douplik A, Selman SH, Keck RW, Szkudlarek M, Pestka M, Jankun J. Transperineal in vivo fluence-rate dosimetry in the canine prostate during SnET2-mediated PDT. Phys Med Biol. 2004;49:3209–3225. doi: 10.1088/0031-9155/49/14/014. [DOI] [PubMed] [Google Scholar]
- 20.Winsborrow BG, Grondey H, Savoie H, Fyfe CA, Dolphin D. Magnetic resonance imaging evaluation of photodynamic therapy-induced hemorrhagic necrosis in the murine M1 tumor model. Photochem Photobiol. 1997;66:847–852. doi: 10.1111/j.1751-1097.1997.tb03236.x. [DOI] [PubMed] [Google Scholar]
- 21.Gross S, Gilead A, Scherz A, Neeman M, Salomon Y. Monitoring photodynamic therapy of solid tumors online by BOLD-contrast MRI. Nat Med. 2003;9:1327–1331. doi: 10.1038/nm940. [DOI] [PubMed] [Google Scholar]
- 22.Kennedy SD, Szczepaniak LS, Gibson SL, Hilf R, Foster TH, Bryant RG. Quantitative MRI of Gd-DTPA uptake in tumors: Response to photodynamic therapy. Magn Reson Med. 1994;31:292–301. doi: 10.1002/mrm.1910310308. [DOI] [PubMed] [Google Scholar]
- 23.Huang Z, Haider MA, Kraft S, Chen Q, Blanc D, Wilson BC, Hetzel FW. Magnetic resonance imaging correlated with the histopathological effect of Pd-bacteriopheophorbide (Tookad) photodynamic therapy on the normal canine prostate gland. Lasers Surg Med. 2006;38:672–681. doi: 10.1002/lsm.20375. [DOI] [PMC free article] [PubMed] [Google Scholar]
- 24.Haider MA, Davidson SR, Kale AV, Weersink RA, Evans AJ, Toi A, Gertner MR, Bogaards A, Wilson BC, Chin JL, Elhilali M, Trachtenberg J. Prostate gland: MR imaging appearance after vascular targeted photodynamic therapy with palladium-bacteriopheophorbide. Radiology. 2007;244:196–204. doi: 10.1148/radiol.2441060398. [DOI] [PubMed] [Google Scholar]
- 25.Mattiello J, Evelhoch JL, Brown E, Schaap AP, Hetzel FW. Effect of photodynamic therapy on RIF-1 tumor metabolism and blood flow examined by 31P and 2H NMR spectroscopy. NMR Biomed. 1990;3:64–70. doi: 10.1002/nbm.1940030204. [DOI] [PubMed] [Google Scholar]
- 26.Bremner JC, Wood SR, Bradley JK, Griffiths J, Adams GE, Brown SB. 31P magnetic resonance spectroscopy as a predictor of efficacy in photodynamic therapy using differently charged zinc phthalocyanines. Br J Cancer. 1999;81:616–621. doi: 10.1038/sj.bjc.6690738. [DOI] [PMC free article] [PubMed] [Google Scholar]
- 27.Ceckler TL, Bryant RG, Penney DP, Gibson SL, Hilf R. 31PNMR spectroscopy demonstrates decreased ATP levels in vivo as an early response to photodynamic therapy. Biochem Biophys Res Commun. 1986;140:273–279. doi: 10.1016/0006-291x(86)91086-7. [DOI] [PubMed] [Google Scholar]
- 28.Ceckler TL, Gibson SL, Kennedy SD, Hill R, Bryant RG. Hetergeneous tumour response to photodynamic therapy assessed by in vivo localised 31P NMR spectroscopy. Br J Cancer. 1991;63:916–922. doi: 10.1038/bjc.1991.201. [DOI] [PMC free article] [PubMed] [Google Scholar]
- 29.Jiang Q, Chopp M, Hetzel FW. In vivo 31P NMR study of combined hyperthermia and photodynamic therapies of mammary carcinoma in the mouse. Photochem Photobiol. 1991;54:795–799. doi: 10.1111/j.1751-1097.1991.tb02092.x. [DOI] [PubMed] [Google Scholar]
- 30.Liu YH, Hawk RM, Ramaprasad S. In vivo relaxation time measurements on a murine tumor model–prolongation of T1 after photodynamic therapy. Magn Reson Imaging. 1995;13:251–258. doi: 10.1016/0730-725x(94)00107-e. [DOI] [PubMed] [Google Scholar]
- 31.Fei B, Wang H, Muzic RF, Flask C, Wilson DL, Duerk JL, Feyes DK, Oleinick NL. Deformable and rigid registration of MRI and microPET images for photodynamic therapy of cancer in mice. Med Phys. 2006;33:753–760. doi: 10.1118/1.2163831. [DOI] [PubMed] [Google Scholar]
- 32.Fei B, Muzic R, Lee Z, Flask C, Morris R, Duerk JL, Wilson DL. Registration of micro-PET and high resolution MR images of mice for monitoring photodynamic therapy. Proc SPIE Med Imaging: Physiol Funct Struct Med Images. 2004;5369:371–379. [Google Scholar]
- 33.Oleinick NL, Antunez AR, Clay ME, Rihter BD, Kenney ME. New phthalocyanine photosensitizers for photodynamic therapy. Photochem Photobiol. 1993;57:242–247. doi: 10.1111/j.1751-1097.1993.tb02282.x. [DOI] [PubMed] [Google Scholar]
- 34.Sobel RE, Sadar MD. Cell lines used in prostate cancer research: A compendium of old and new lines—Part 1. J Urol. 2005;173:342–359. doi: 10.1097/01.ju.0000141580.30910.57. [DOI] [PubMed] [Google Scholar]
- 35.Colussi VC, Feyes DK, Mulvihill JW, Li YS, Kenney ME, Elmets CA, Oleinick NL, Mukhtar H. Phthalocyanine 4 (Pc 4) photodynamic therapy of human OVCAR-3 tumor xenografts. Photochem Photobiol. 1999;69:236–241. [PubMed] [Google Scholar]
- 36.Castano AP, Mroz P, Hamblin MR. Photodynamic therapy and anti-tumour immunity. Nat Rev Cancer. 2006;6:535–545. doi: 10.1038/nrc1894. [DOI] [PMC free article] [PubMed] [Google Scholar]