Abstract
Real-time observation of cell growth provides essential information for studies such as cell migration and chemotaxis. A conventional cell incubation device is usually too clumsy for these applications. Here we report a transparent microfluidic device that has an integrated heater and a concentration gradient generator. A piece of indium tin oxide (ITO) coated glass was ablated by our newly developed visible laser-induced backside wet etching (LIBWE) so that transparent heater strips were prepared on the glass substrate. A polymethylmethacrylate (PMMA) microfluidic chamber with flow field rectifiers and a reagent effusion hole was fabricated by a CO2 laser and then assembled with the ITO heater so that the chamber temperature can be controlled for cell culturing. A variable chemical gradient was generated inside the chamber by combining the lateral medium flow and the flow from the effusion hole. Successful culturing was performed inside the device. Continuous long-term (>10 days) observation on cell growth was achieved. In this work the flow field, medium replacement, and chemical gradient in the microchamber are elaborated.
INTRODUCTION
Traditionally chemotaxis has been studied by approaches such as the Boyden chamber,1 capillary,2 under agarose,3 orientation,4 and collagen matrices,5 just to name a few. The concentration gradients in these approaches are not stable or cannot be easily controlled during experiment. Recently microfabricated devices have been applied for gradient generation.6, 7, 8
Chemical gradient generation in microfluidic devices has been achieved by several approaches. Complex mixing channels produce steady linear gradient transversal to flow direction.7, 9 Gradient generated at channel intersections has been shown by controlled flow.10 Membrane-based devices provide steady linear gradient with zero flow.11, 12 An effusion-type generator that provides symmetric radial gradient has been reported.13 Another approach utilizes multiple injectors to generate gradient in a microfluidic chamber.14 Here we report an alternative approach that combines lateral flow and central effusion to generate an asymmetric gradient.
For long-term observation on cell growth, autonomous microscopic cell-culture chambers have been developed by several groups.7, 15, 16, 17, 18, 19, 20, 21, 22, 23, 24, 25 Very recently, a transparent chamber with an integrated heater24 and flow equalization structure26 has been shown to support a stable cell culture for several weeks.
In our laboratory, we have developed several rapid-prototyping methods for fabricating microfluidic chips27, 28 and integrated transparent heaters.29, 30 In this work we report a simple design that provides a variably controllable chemical gradient for cell culturing. Combining a flow-equalization microstructure with an internal effusion inlet, a near-linear and complex chemical gradient in a microchamber was generated. Flow field and gradient buildup were simulated by computational fluidic dynamics (CFD) and verified experimentally. A successful cell culture was performed.
Experimental
Chip design and fabrication
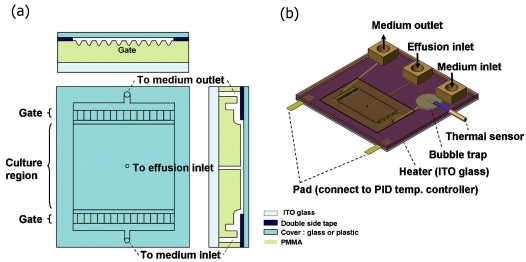
A competent culture chamber requires that cells can grow without significant shear interference while efficient medium refreshment can be achieved. A structure that provides flow equalization was adopted,26 as shown in Fig. 1. Our cell-culture chip consists of a polymeric layer [polymethylmethacrylate (PMMA) layer] that includes a bubble trap, microtrenches, and a flow equalization structure (the gate), a double-sided tape layer for bonding, and a cover layer made of glass or plastic film (AB Gene, model AB-0611) for sealing. The PMMA layer was fabricated by CO2 laser direct writing.27 A transparent indium tin oxide (ITO) heating layer is stacked beneath the PMMA layer. The ITO heater was patterned by laser-induced backside wet etching.29 Temperature control was achieved by connecting the ITO heater to a proportional-integral-derivative (PID) temperature controller (JETEC Electronics Co., Model TTM-J4-R-AB). A flat temperature sensor (Model TPK-02A, TECPEL) was put under the channel between the medium inlet and the culture chamber and then connected to the PID controller. The culture medium was pumped by a syringe pump to flow into the chamber through the medium inlet hole and out of the chamber to a waste via the outlet hole. The cell culture region is 14 mm×26 mm in area and 105 μm in depth. The calculated volume from the medium inlet to the outlet is 220 μL. The volume in the culture region is 38 μL. At the center of the chamber bottom a reagent effusion hole was fabricated. This hole is used for introducing chemicals such as chemoattractants used in chemotaxis studies into the culture region. Cells may be allowed to grow on the hole-side surface or on the cover-side surface.
Figure 1.
Configuration drawing of the transparent cell-culturing device. (a) Shows the cross-sectional top view, front view, and side view around the culture region. In the front view the cross section of the gate structure is shown. The arrangement of the upstream/downstream gate and the culture region is in the top view. In the side view the medium flow path and the effusion hole is shown. (b) The whole view of the entire device.
Flow field and chemical gradient observation
Rose Bengal (Acros, No. 189450050), a water soluble red xanthene dye, was used as a tracing dye for observing medium flow and chemical gradient generation. A consumer digital camera was used for long-term observation of the flow field inside the chamber. Photographs were taken every 4 to 10 min.
Flow simulation
The design of the equalization gates could create a large fluidic resistance in the gate channels. This has the advantage of creating a uniform flow profile inside the culture region to guarantee a uniform microenvironment. To verify this claim, we used a computational fluidic dynamics package, CFD-ACE+ (CFD Research Corp., Huntsville, AL), to model the three-dimensional (3D) velocity field inside the flow chamber. For medium replacement simulation, a fully developed velocity condition was first imposed at the point before the gate. A parabolic velocity profile with an average perfusion rate (10 μL∕h) was used. No-slip boundary conditions were set at the walls and zero back pressure conditions were set at the outlet. The fluidic density and dynamic viscosity of solution were set as 1000 kg∕m3 and 0.000855 kg∕m s, respectively.
Temperature distribution measurement
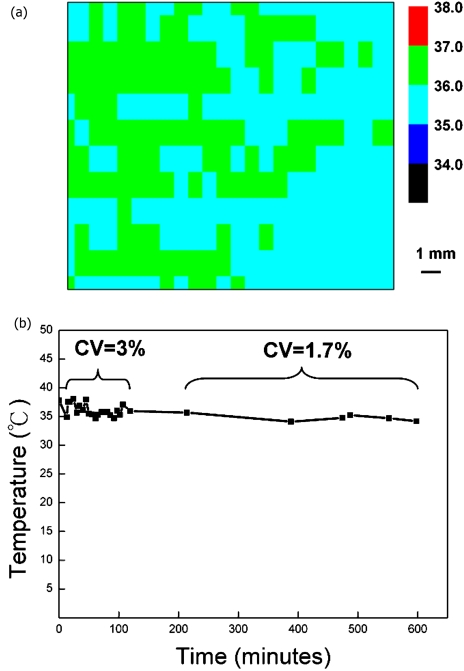
It is important to have homogeneous temperature in the entire cell culture region. Noncontact infrared thermometry is used for measuring the temperature distribution of the culture chamber. The culture chamber was heated and the culture medium was continuously pumped through the chamber at 100 μL∕h. The cover slip temperature was measured by an IR camera (IRCON, 100P). A 1 mm image resolution is achieved. A similar IR temperature measurement has been performed on a microfluidic chip before31 to obtain spatial temperature distribution. Long-term temperature stability is measured by time-lapsed IR photography.
Cell culture in microchamber
A lung adenocarcinoma cell, CL1-5, acquired from Dr. P.C. Yang of National Taiwan University,32 was used for cell culturing in this study. The cells were cultured in Dulbeco’s modified Eagle’s medium (DMEM) with 10% fetal bovine serum (FBS). Initially, the cells were cultured in sterilized tissue culture polystyrene (TCPS) flasks and dishes (Corning, USA) maintained at 37 °C in a humidified atmosphere containing 5% CO2. For on-chip cell-culturing experiments, the medium inlet of the chip was connected to a 10 mL sterile syringe by polytetrafluoroethylene (PTFE) tubing (outer diameter 1∕16 in., inner diameter 0.03 in.; Upchurch Scientific). Continuous media perfusion was done using a syringe pump (Model NE-1000; New Era Systems Inc.), generating a flow rate of 10 μL∕h. No CO2 flow is used for the cell culture in the microchamber. The chip was mounted on the stage of a standard phase-contrast microscope. Injection of cells was performed by connecting a 1 mL sterile syringe loaded with cells to the culture chip by PTFE tubing. CL1-5 cells were seeded at a density of 1×10⁶ cell∕ml. Cell culture images were digitally recorded using a charge-coupled device (CCD) camera (Unibrain, Fire-i 400) attached to the microscope at 5 min intervals. The images were time stamped and then converted into animation.
RESULT AND DISCUSSION
Medium flow and replacement
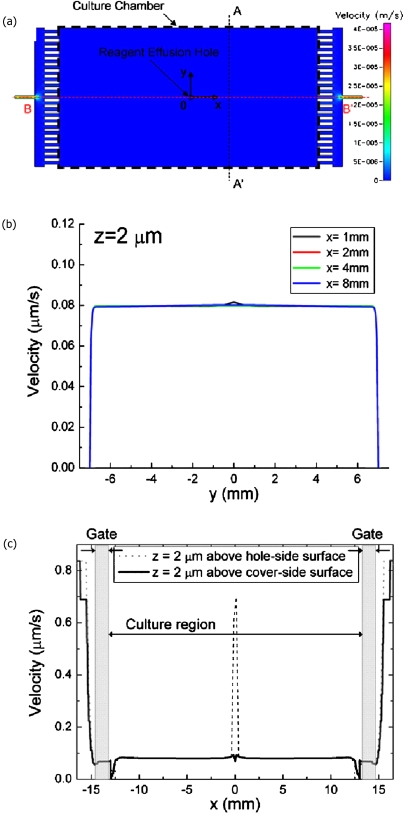
Flow simulation in the cell culture chamber was performed. The simulated velocity field is illustrated in Fig. 2. Similar to the equalization effect observed previously,26 the equalization structure yields a very uniform flow profile inside the culture region [Fig. 2a]. At the designated flow rate of 10 μL∕h, we observed that over 90% of the region transversally shows uniform flow velocity of about 0.08 μm∕sec at 2 μm above the surface [Fig. 2b]. The flow speed near the centerline and that near the sidewall was compared experimentally in Fig. 4 to confirm the simulation (see below). Only the transversal flow field distribution has been discussed before.26 Here we further check the longitudinal flow distribution. This is to identify the boundary where we can culture cells without shear stress variation since in our design the culture chamber is larger than previous studies. From the simulation as shown in Fig. 2c, longitudinal flow velocity is uniform in over 90% of the culture region. A prominent velocity jump was obtained at the effusion hole. This may be caused by the friction-free interface at the effusion hole used in flow modeling. Since cells do not grow directly on the hole the jump can be neglected. The cover-side surface simulation shows only a slight perturbation at the area right on top of the effusion hole.
Figure 2.
Flow simulation of the gated flow chamber at equilibrium. (a) Flow in the chamber with gates and velocity distribution in transversal (A-A’ (b)); longitudinal (B-B’ (c)) directions. The flow rate at the inlet is 10 μL∕h. Due to the gated design, the velocity profile inside the culture chamber is uniform over 90% of the culture area. The velocity was calculated at 2 μm above the hole-side and cover-side surface (z=2 μm).
Figure 4.
Experimental result of the medium replacement. (a) Start of the replacement, t=0 min. (b) Replacement progression at t=240 min and (c) t=270 min. (d) Complete replacement at t=860 min. The medium flow is 10 μL∕h from left to right. (e) Video showing the experimental medium replacement (enhanced online).
A classical flow cell, the Hele-Shaw33, 34 flow cell, has also been used to generate the flat-front flow. When the depth of the culture region is significantly smaller than the chamber width, the culture region resembles a Hele-Shaw flow cell. However, when the depth is comparable to the width, e.g., the depth∕width is larger than ∼1∕10, the gate structure is essential for generating the flat-front flow inside the culture region.
We further checked the time needed to replace the culture medium entirely by a medium replacement simulation. In Fig. 3 the progression of the medium replacement is shown. As shown in Fig. 3b, in about 4 h more than 50% of the culture region is in contact with a fresh medium. Complete medium replacement is achieved in about 10 h [Fig. 3c]. This indicates that in the chamber the culture medium is refreshed about every 10 h. The average cell multiplying time is 48 h. The simulation shows that cells can be kept in a fresh medium continuously.
Figure 3.
Simulation of the medium replacement. (a) Start of the replacement, t=0 min. (b) Replacement progression at t=240 min. (c) Complete replacement at t=800 min. Medium flow rate is 10 μL∕h from left to right. (d) Video showing the simulated medium replacement (enhanced online).
In summary, the CFD simulation shows that slow and uniform fields and efficient medium refreshment are obtained in the culture chamber.
An experiment was performed to verify medium replacement progression in the culture chamber. As shown in Fig. 4, medium replacement progresses similarly to that from the simulation. Complete replacement is achieved in about 14 h. The experimental medium replacement time is about 4 h longer than that from the simulation. It is possibly caused by dye dilution when the red dye was introduced through the bubble trap that was prefilled with clear water. This dilution results in early dye observation in the culture region while the water in the bubble trap was not replaced completely. It is the dilution in the bubble trap that causes the delayed medium replacement in the culture region.
Please notice that the parabolic front seen in Fig. 3b and Figs. 4b, 4c is flow front but not flow speed distribution. The flow speed inside the culture region can be estimated by Figs. 4b, 4c. From Figs. 4b, 4c, the shape of the flow front edge remains unchanged. The flow fronts were digitized (figures not shown) and the migration distance was measured to estimate flow speed. The result indicates that the difference between the speed at the centerline and that at the wall is about 7%, which is significantly smaller than a parabolic flow. This observation confirms the simulated flat-front flow.
Chemical gradient buildup and control
By using a different approach for generating gradient, we combine lateral medium flow and effusion flow from the reagent effusion hole to generate asymmetric gradient. CFD simulation of the gradient buildup is shown in Fig. 5. The effusion from the reagent effusion hole is not symmetric because of being flushed toward the right side by the lateral medium flow [Fig. 5b]. After about 2 h [Fig. 5c] a steady bell-shaped gradient is achieved. The simulation clearly shows that a steep gradient is present at the upstream of the effusion hole while a gradual gradient builds up at the downstream side of the hole. Analysis of the concentration distribution and the corresponding gradient transversal to the flow direction is shown in Fig. 5d. The gradient is steeper at a position closer to the effusion hole (e.g., x=1 mm versus x=8 mm). At x=1 the largest gradient obtained is ∼0.5 C∕mm while that at x=8 is ∼0.37 C∕mm, where C is normalized concentration. In addition, for each transversal concentration distribution the regions with the steepest concentration change have a near-linear gradient. Away from the near-linear region more gradual gradients are obtained. The above analysis is performed for direction transversal to medium flow. Longitudinal analysis can also be performed similarly. Apparently the complex gradient can be achieved in a single experiment using this simple device. Please notice that the concentration shown here is a normalized concentration and can be directly substituted by the actual concentration used in other experiments.
Figure 5.
Simulation of chemical diffusion in a pre-established flow field. The chemical effuses from the central effusion hole at the bottom of the cell-culture chamber at rate of 10 μL∕h. (a) Start of the effusion, t=0 min. (b) Gradient build-up progression at t=32 min. (c) Steady gradient at t=128 min. Medium flow is 10 μL∕h from left to right. (d) is the transversal gradient generated in (c). Wide segments denote the near-linear region. The “x” denotes the downstream distance from the effusion hole. (e) Video showing the animated simulation of the gradient progression (enhanced online).
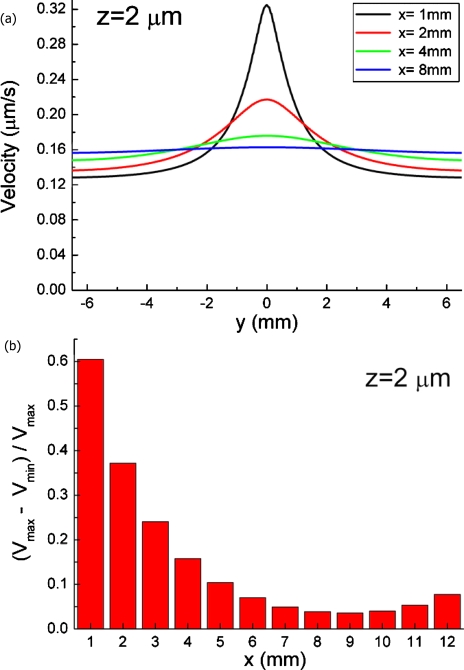
The flow field is disturbed when the underlying effusion hole is added in the cell culture region. Quantitative analysis of the simulated flow field is shown in Fig. 6. The velocity was calculated at 2 μm above the cell culture surface (z=2 μm) to match the height of the cells. At a position in proximity to the effusion hole, e.g., x=1 mm in Fig. 6a, the abrupt velocity increase was obtained near the hole. When the distance to the hole increases, the velocity variation diminishes gradually. At 5 mm downstream of the effusion hole, the velocity difference is below 10% [Fig. 6b].
Figure 6.
(a) Simulated flow velocity profile in transversal direction along the A-A’ line in Fig. 5a. The x and y directions are as depicted in Fig. 5a. (b) A plot showing that flow field variation is below 10% at 5 mm downstream away from the effusion hole (x=5). The flow speed variation is large near the effusion hole and stabilizes gradually as distance from the hole increases.
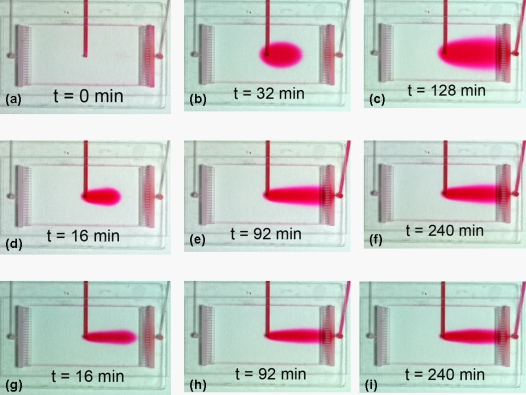
Experimentally the gradient progression inside the chamber was observed by time-lapse photography. The gradient starts to build up when the effusion starts [Figs. 7a, 7b]. Dye distribution starts as a point source at t=0 min and then progresses to build up a lobe-shaped distribution after about 0.5 h, and eventually equilibrates to a steady bell-shaped gradient after 2 h [Fig. 7c]. Experimentally the dye distributes almost identically to that from the simulation.
Figure 7.
Experimental result of chemical gradient progression. (a) t=0 min. (b) t=32 min. (c) t=128 min. The lateral medium flow is 10 μL∕h from left to right. Dye effusion from the inlet is 10 μL∕h. (d)–(f) Gradient with a larger medium flow of 30 μL∕h, showing a narrower dye distribution. (g)–(i) Gradient with a 50 μL∕h lateral medium flow.
A special feature provided by the device is that in the upstream of the effusion hole there is no chemical distributed. Hence, in a single experiment, cells in the upstream serve as a control group while cells in the downstream serve as a test group. In such a way batch-to-batch experimental variation can be reduced.
Another advantage of the gradient generation approach is that by varying the ratio between lateral medium flow and central effusion a variably controllable gradient is obtained. In Figs. 7d, 7e, 7f lateral medium flow was increased to 30 μL∕h while central effusion was maintained at 10 μL∕h. As a result the gradient distribution equilibrates earlier at about 1.5 h and, in addition, the width of the steady distribution was narrowed. Increasing the lateral flow∕central flow ratio to 5 reduces the steady width further [Figs. 7g, 7h, 7i]. It is demonstrated that the gradient distribution of the culture chamber is easily varied by controlling the lateral flow∕central flow ratio. The actual concentration distribution in the culture region can be measured by digitizing the images of the dye in the flow cell, similar to the procedure used for estimating the flow speed inside the culture region. The corresponding gradient can then be calculated based on the concentration distribution for individual applications.
In summary, the gradient simulation indicates that by combining the lateral flow and the central effusion flow, an asymmetric gradient can be easily built up. A steep and gradual gradient is obtained in a single device. Our flow experiment confirms the simulation.
Temperature homogeneity and cell culture
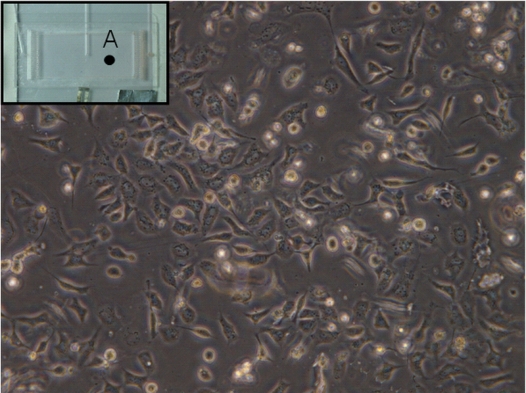
Another important characteristic about a cell culture device is the homogeneous temperature distribution encompassing the entire culture region. The temperature distribution was measured by an IR camera and is shown in Fig. 8a. It was observed that with a continuous 100 μL∕h medium flow, in an area of 10 mm×19 mm, temperature homogeneity is kept to be within ±1 °C. Our result is comparable to that reported by other groups, in which 1.5 °C is estimated.26 Long-term monitoring of the chamber temperature shows that in the first 2 h the variation is ±1.7 °C (CV=3%). Then the variation reduces to be ±0.8 °C (CV=1.7%). Our result verifies that this device is suitable for providing a homogeneous and stable environment for long-term cell culturing. A stable growth of the CL1-5 cell was achieved in this device and the microscopic cell image is shown in Fig. 9.
Figure 8.
(a) Temperature distribution in the cell-culture region recorded by an IR thermal imager. Steady medium flow (100 μL∕h) is pumped through the culture chamber. Temperature homogeneity is kept to be within ±1 °C in an area of 10 mm×19 mm. (b) Long-term temperature stability of the culture chamber.
Figure 9.
Image of lung cancer cells, CL1-5, cultured in the microfluidic device after 122 h. The medium flow rate is 10 μL∕h. The chamber temperature is kept at 37±1 °C. The inset shows the region where the image was taken.
The shear stress acting on the cultured cells by the medium flow is estimated. According to the cell-in-channel model,35 the maximum shear stress on the cells in our chip is calculated to be 0.02 dyne∕cm2 when the flow rate is set to 50 μL∕h. Comparing to the physiological condition36 of 0.75 dyne∕cm2, the estimated shear stress is negligible. It is concluded that the shear stress in the culture chip is not significant to the cultured cells.
CONCLUSION
A microchamber with an integrated heater and chemical gradient generator was reported. CFD simulation and flow experiment were performed to analyze the medium replacement and gradient generation. A steady gradient was generated by the simple design that combines lateral flow and effusion flow. Steady steep and gradual gradients were simultaneously provided in a single chip. Homogeneous temperature distribution encompassing the entire cell culture region was confirmed by IR photography. Long-term temperature stability was also verified. The device is useful for long-term cell growth study and may be very helpful for chemotaxis studies.
ACKNOWLEDGMENTS
The authors would like to thank Academia Sinica, Taiwan (Thematic Project AS-95-TP-B08) and National Science Council, Taiwan (Contract No. 95-2113-M-001-037-MY3) for financial support.
References
- Boyden S. V., J. Exp. Med. 10.1084/jem.115.3.453 115, 453 (1962). [DOI] [PMC free article] [PubMed] [Google Scholar]
- Adler J., Science 10.1126/science.166.3913.1588 166, 1588 (1969). [DOI] [PubMed] [Google Scholar]
- Nelson R. D., Quie P. G., and Simmons R. L., J. Immunol. 115, 1650 (1975). [PubMed] [Google Scholar]
- Zigmond S. H., J. Cell Biol. 10.1083/jcb.75.2.606 75, 606 (1977). [DOI] [PMC free article] [PubMed] [Google Scholar]
- Brown A. F., J. Cell Sci. 58, 455 (1982). [DOI] [PubMed] [Google Scholar]
- Dertinger S. K. W., Chiu D. T., Jeon N. L., and Whitesides G. M., Anal. Chem. 10.1021/ac001132d 73, 1240 (2001). [DOI] [Google Scholar]
- Jeon N. L., Baskaran H., Dertinger S. K. W., Whitesides G. M., Water L. V. D., and Toner M., Nat. Biotechnol. 10.1038/nbt712 20, 826 (2002). [DOI] [PubMed] [Google Scholar]
- Wu H., Huang B., and Zare R. N., J. Am. Chem. Soc. 10.1021/ja058530o 128, 4194 (2006). [DOI] [PubMed] [Google Scholar]
- Walker G. M., Sai J., Richmond A., Stremler M., Chung C. Y., and Wikswo J. P., Lab Chip 10.1039/b417245k 5, 611 (2005). [DOI] [PMC free article] [PubMed] [Google Scholar]
- Yang M., Yang J., Lia C. -W., and Zhaob J., Lab Chip 10.1039/b201021f 2, 158 (2002). [DOI] [PubMed] [Google Scholar]
- Abhyankar V. V., Lokuta M. A., Huttenlocher A., and Beebe D. J., Lab Chip 10.1039/b514133h 6, 389 (2006). [DOI] [PubMed] [Google Scholar]
- Diao J., Young L., Kim S., Fogarty E. A., Heilman S. M., Zhou P., Shuler M. L., Wu M., and DeLisa M. P., Lab Chip 10.1039/b511958h 6, 381 (2006). [DOI] [PubMed] [Google Scholar]
- Frevert C. W., Boggy G., Keenan T. M., and Folch A., Lab Chip 10.1039/b806769b 6, 849 (2006). [DOI] [PMC free article] [PubMed] [Google Scholar]
- Chung B. G., Lin F., and Jeon N. L., Lab Chip 10.1039/b512667c 6, 764 (2006). [DOI] [PubMed] [Google Scholar]
- Ince C., Beekman R. E., and Verschragen G., J. Immunol. Methods 10.1016/0022-1759(90)90214-G 128, 227 (1990). [DOI] [PubMed] [Google Scholar]
- Hediger S., Fontannaz J., Sayah A., Hunziker W., and Gijs M. A. M., Sens. Actuators B 10.1016/S0925-4005(02)00148-X 63, 63 (2000). [DOI] [Google Scholar]
- Blau A. W. and Ziegler C. M., J. Biochem. Biophys. Methods 10.1016/S0165-022X(01)00163-4 50, 15 (2001). [DOI] [PubMed] [Google Scholar]
- Jager E. W. H., Immerstrand C., Peterson K. H., Magnusson K. -E., Lundström I., and Inganäs O., Biomed. Microdevices 10.1023/A:1016092228965 4, 177 (2002). [DOI] [Google Scholar]
- Moriguchi H., Wakamoto Y., Sugio Y., Takahashi K., Inoue I., and Yasuda K., Lab Chip 10.1039/b202569h 2, 125 (2002). [DOI] [PubMed] [Google Scholar]
- Davidsson R., Boketoft A., Bristulf J., Kotarsky K., Olde B., Owman C., Bengtsson M., Laurell T., and Emneus J., Anal. Chem. 10.1021/ac035249o 76, 4715 (2004). [DOI] [PubMed] [Google Scholar]
- Kojima K., Kaneko T., and Yasuda K., J. Nanobiotechnol. 10.1186/1477-3155-2-92, 9 (2004). [DOI] [PMC free article] [PubMed] [Google Scholar]
- Prokop A., Prokop Z., Schaffer D., Kozlov E., Wikswo J., Cliffel D., and Baudenbacher F., Biomed. Microdevices 10.1023/B:BMMD.0000048564.37800.d6 6, 325 (2004). [DOI] [PubMed] [Google Scholar]
- Fiorini G. S. and Chiu D. T., Biotechniques 38, 429 (2005). [DOI] [PubMed] [Google Scholar]
- Ho C. L., Mou T. Y., Chiang P. S., Weng C. L., and Chow N. H., Biotechniques 38, 267 (2005). [DOI] [PubMed] [Google Scholar]
- Tourovskaia A., Figueroa-Masot X., and Folch A., Lab Chip 10.1039/b405719h 5, 14 (2005). [DOI] [PubMed] [Google Scholar]
- Petronis S., Stangegaard M., Christensen C. B. V., and Dufva M., Biotechniques 40, 368 (2006). 10.2144/000112122 [DOI] [PubMed] [Google Scholar]
- Cheng J. Y., Wei C. W., Hsu K. H., and Young T. H., Sens. Actuators B 10.1016/j.snb.2003.10.022 99, 186 (2004). [DOI] [Google Scholar]
- Cheng J. Y., Yen M. H., Wei C. W., Cheang Y. C., and Young T. H., J. Micromech. Microeng. 10.1088/0960-1317/15/6/005 15, 1147 (2005). [DOI] [Google Scholar]
- Cheng J. -Y., Yen M. -H., Hsu W. -C., Jhang J. -H., and Young T. -H., J. Micromech. Microeng. 10.1088/0960-1317/17/11/019 17, 2316 (2007). [DOI] [Google Scholar]
- Cheng J. -Y., Yen M. -H., Hsu W. -C., and Young T. -H., in The 8th International Symposium on Laser Precision Microfabrication, LPM2007, Vienna, Austria 2007. (2007).
- Cheng J. -Y., Hsieh C. -J., and Chuang Y. -C., Analyst (Cambridge, U.K.) 10.1039/b501061f130, 931 (2005). [DOI] [PubMed] [Google Scholar]
- Shih J. Y., Yang S. C., Hong T. M., Yuan A., Chen J. J. W., Yu C. J., Chang Y. L., Lee Y. C., Peck K., Wu C. W., and Yang P. C., J. Natl. Cancer Inst. 10.1093/jnci/93.18.1392 93, 1392 (2001). [DOI] [PubMed] [Google Scholar]
- Hele-Shaw H. S., Nature (London) 10.1038/058034a0 58, 34 (1898). [DOI] [Google Scholar]
- Gondret P., Rakotomalala N., Rabaud M., Salin D., and Watzky P., Phys. Fluids 10.1063/1.869301 9, 1841 (1997). [DOI] [Google Scholar]
- D. P.GaverIII and Kute S. M., Biophys. J. 75, 721 (1998). [DOI] [PMC free article] [PubMed] [Google Scholar]
- Cinamon G. and Alon R., J. Immunol. Methods 10.1016/S0022-1759(02)00418-0 273, 53 (2003). [DOI] [PubMed] [Google Scholar]


