Abstract
Sound localization requires comparison between the inputs to the left and right ears. One important aspect of this comparison is the differences in arrival time to each side, also called interaural time difference (ITD).A prevalent model of ITD detection, consisting of delay lines and coincidence-detector neurons, was proposed by Jeffress (J Comp Physiol Psychol 41:35–39, 1948). As an extension of the Jeffress model, the process of detecting and encoding ITD has been compared to an effective cross-correlation between the input signals to the two ears. Because the cochlea performs a spectrotemporal decomposition of the input signal, this cross-correlation takes place over narrow frequency bands. Since the cochlear tonotopy is arranged in series, sounds of different frequencies will trigger neural activity with different temporal delays. Thus, the matching of the frequency tuning of the left and right inputs to the cross-correlator units becomes a ‘timing’ issue. These properties of auditory transduction gave theoretical support to an alternative model of ITD-detection based on a bilateral mismatch in frequency tuning, called the ‘stereausis’ model. Here we first review the current literature on the owl’s nucleus laminaris, the equivalent to the medial superior olive of mammals, which is the site where ITD is detected. Subsequently, we use reverse correlation analysis and stimulation with uncorrelated sounds to extract the effective monaural inputs to the cross-correlator neurons. We show that when the left and right inputs to the cross-correlators are defined in this manner, the computation performed by coincidence-detector neurons satisfies conditions of cross-correlation theory. We also show that the spectra of left and right inputs are matched, which is consistent with predictions made by the classic model put forth by Jeffress.
Keywords: Barn owl, Interaural time difference, Cross-correlation, Coincidence detection, Cochlear delays, Sound localization, Nucleus laminaris, Stereausis
1 Introduction
Both mammals and birds use interaural time difference (ITD) as a cue to determine the horizontal position of a sound source in space (Heffner and Heffner 1992; Moiseff 1989). The process of detecting ITD has been modeled as a system implemented by coincidence-detector neurons and axonal delay lines (Jeffress 1948). Coincidence detectors respond when impulses from the left and right sides arrive at the same time. Systematic variation in the neural delays produces a topographic representation of ITD that covers the range of ITD normally experienced by the animal. ITD is signalled by the preferred delay of the neurons with the maximum firing rate. Sixty years later, the discussion about whether or not the Jeffress model applies to how ITD is detected and encoded is still vibrant (Joris and Yin 2007). The main reason for this endurance has been the difficulty in collecting unequivocal and conclusive datasets. Due to the technical challenge in recording these neurons, very few early studies were able to measure response properties of coincidence detector neurons (Goldberg and Brown 1969; Yin and Chan 1990; Carr and Konishi 1990; Spitzer and Semple 1995). To make things even more complicated, recent data appear inconsistent with early studies (McAlpine et al. 2001; Brand et al. 2002). A large dataset on the owl’s ITD detection system has been collected using multiple techniques (Sullivan and Konishi 1986; Carr and Konishi 1988, 1990; Peña et al. 1996; Peña et al. 2001; Christianson and Peña 2007; Fischer et al. 2008). Below, we first review this evidence, which is consistent with the Jeffress model. We then use reverse correlation to test an alternative model to Jeffress’, the ‘Cochlear-delays’ theory (Schroeder 1977; Shamma et al. 1989), which requires that the binaural inputs to coincidence detector neurons show a systematic mismatch in frequency selectivity. Our results are inconsistent with the cochear-delays model.
1.1 Evidence for delay lines and coincidence detectors in the owl
In the owl’s nucleus laminaris (NL), phase locked impulses from each side of the brain are conveyed by myelinated axons of relatively low-conduction velocity. The delays from one and the other side vary dorso-ventrally in opposite directions. Such arrangement was demonstrated by Carr and Konishi (1990) using sharp glass electrodes to obtain quasi-intracellular recording of the axonal projections from the cochlear nuclei of both sides into NL. The left versus right delay differences found fell within a range that appears to overlap with the ITDs that the owl’s interaural distance can generate (Carr and Konishi 1990). Carr and Konishi (1990) also showed, for the first time, that NL neurons respond maximally when the conduction time from each side exactly balances the difference in the arrival time of the sound to each ear, which is the ITD. Given their position in the nucleus, NL neurons should thus be tuned to a place-dependent ITD. Although early studies showed an ordered sequence of ITD tuning of field potentials (Sullivan and Konishi 1986) and neural delays (Carr and Konishi 1990) in the dorso-ventral axis of NL, it remained to be shown that the tuning of actual neurons reflected such topography. This is especially important in a region where field potentials can easily be confused with single units. The confirmation of this came when it was possible to record NL neurons sequentially, along a single electrode tract (Peña et al. 2001). These studies used patch clamp electrodes to record the elusive NL neurons. By applying suction through the electrodes, a significant improvement in recording isolation was achieved and units could be held for longer periods of time (Peña et al. 1996). This technique, later called ‘loose patch’, made the recording of NL neurons more likely and stable in a single path. Consistent with Carr and Konishi (1990), the ITD tuning of individual neurons recorded using the loose patch could be predicted by differences in the length of the ipsilateral and contralateral delay lines (Peña et al. 2001), i.e., a map of ITD appears to exist along the penetration plane of the neural delay lines. A topographic arrangement of ITD tuning has also been found in avian species that detect ITD in a frequency range similar to mammals (Köppl and Carr 2008). Recently, Wagner et al. (2007) conclusively showed that the ITD tuning of downstream neurons uniformly spreads over the owl’s physiological range. These data are consistent with the Jeffress model of detecting and encoding ITDs.
1.2 Coincidence detectors perform cross-correlation
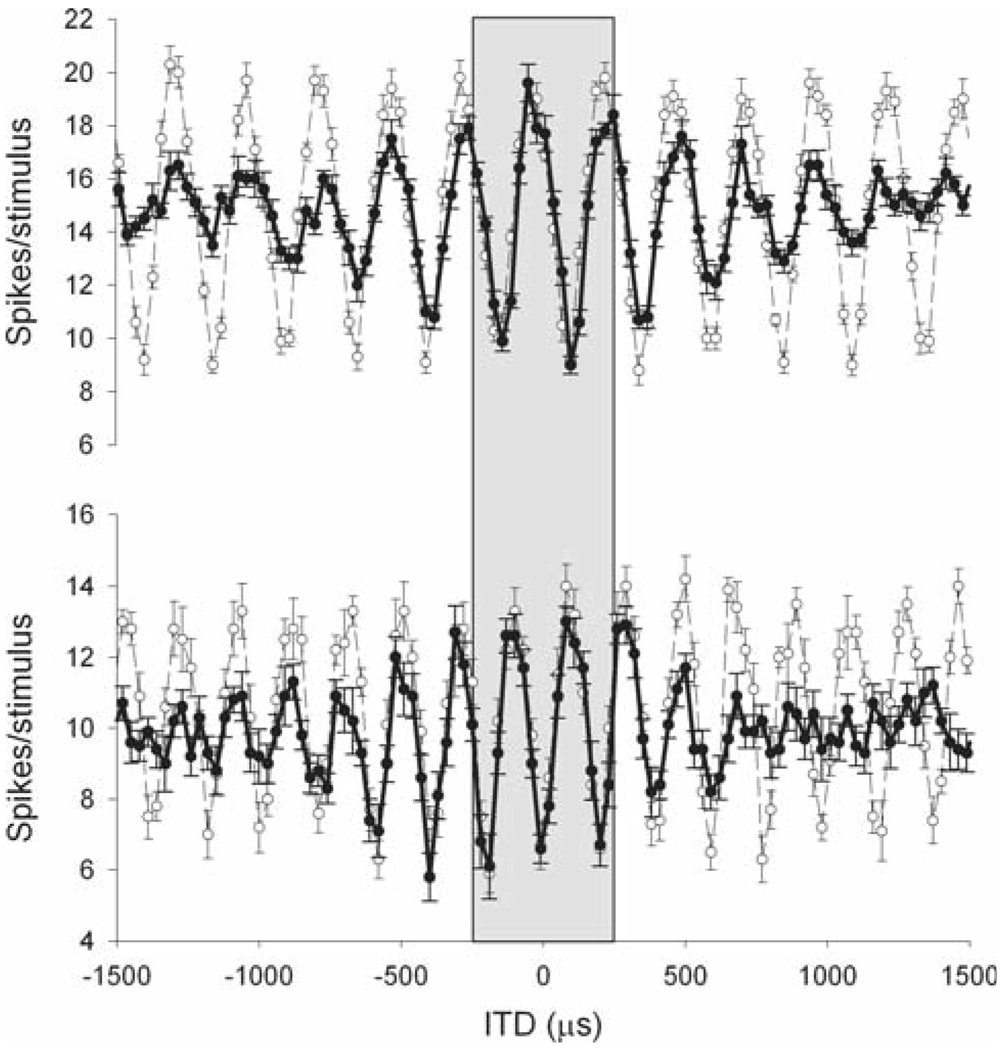
When the acoustic signal is periodic, the response of an NL neuron as a function of ITD is naturally periodic. However, broadband signals elicit nonperiodic rate-ITD curves. Depending on the frequency, rate-ITD curves in NL may present more than one peak within the physiological range (Fig. 1). This type of behavior, observed not only in NL neurons but also in the mammalian superior olivary complex (Goldberg and Brown 1969; Yin and Chan 1990), resembles a running cross-correlation. Although it has been demonstrated that a running cross-correlation can be derived from coincidence detection (Licklider 1959), how much of a cross-correlation this process is has been a matter of debate (Yin et al. 1987;Yin and Chan 1990; Batra and Yin 2004). The ‘loose patch’ technique permitted us to address the topic of cross-correlation more formally; experiments could explore the relationship between the spectral composition of the input and the output using broadband signals. Specifically, the Cross-Correlation theorem could be tested in NL neurons.
Fig. 1.
Example of long-range ITD-curves for two laminaris neurons. When the range of ITDs presented is expanded, a more complex structure becomes evident. Whereas the response is periodic for tonal stimulation (thin line), the amplitude of the peaks decays in response to a broadband sound as a result of the bandpass filtering of signals in the cochlea (bold line). However, for the physiological range of ±250 µs (Keller et al. 1998; Poganiatz et al. 2001; von Campenhausen and Wagner 2006) the responses to tones and broadband signals can be practically indistinguishable (gray area). This becomes significant at higher frequencies, when peaks of similar amplitude occur in the physiological range. Tonal stimulation: 4 kHz (top), 5.1 kHz (bottom)
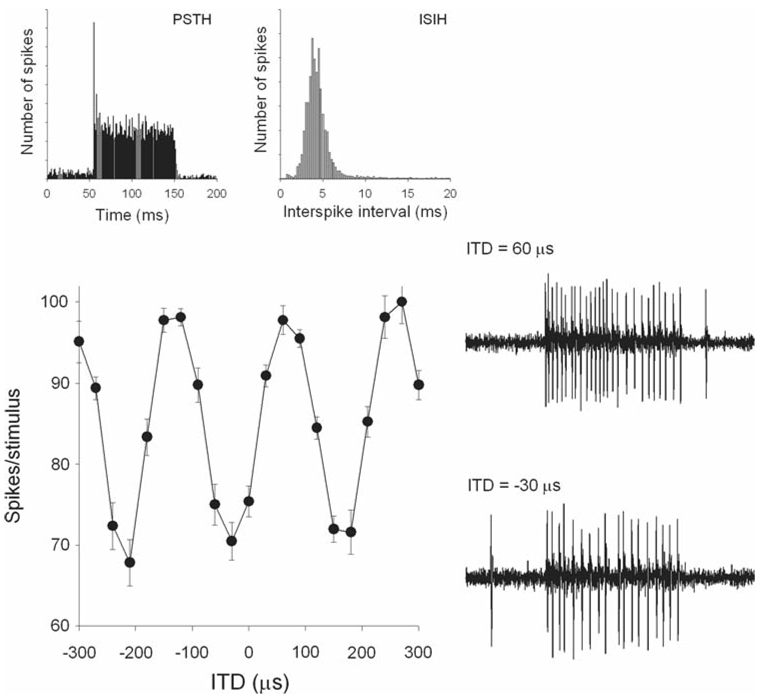
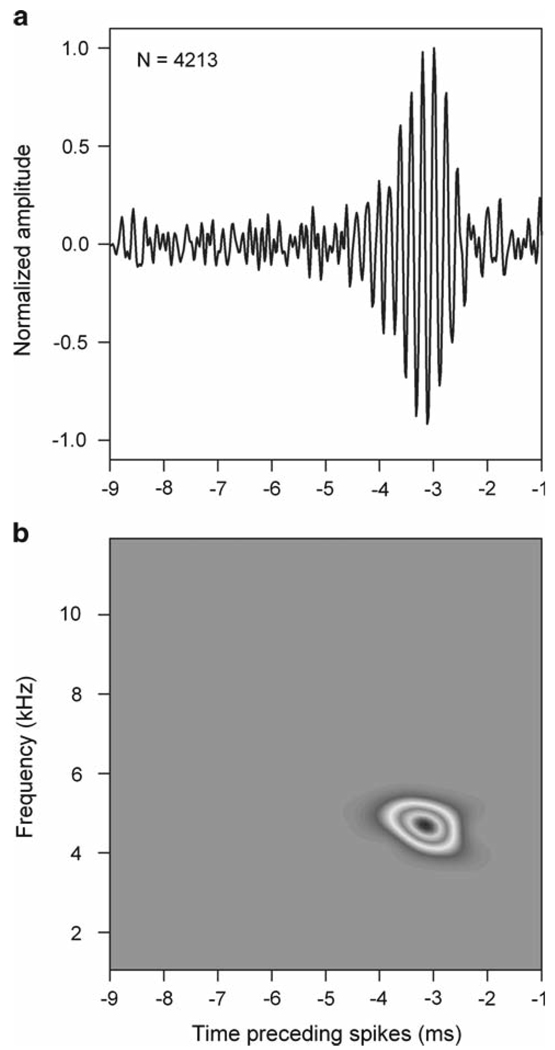
Reverse correlation analysis was used to test the hypothesis that coincidence detector neurons perform cross-correlation. The loose-patch technique yielded the quality and stability of recording necessary for reverse correlation. The recording isolation was controlled by visual inspection of the spikes and by a continuous monitoring of the inter-spike intervals histogram (Fig. 2). Reverse correlation is very often used in sensory physiology to determine the stimulus selectivity of a neuron (de Boer and de Jongh 1978). By stimulating with white noise and averaging the stimulus signal that precedes thousands of spikes, it is possible to extract the components of the white noise that are most often temporally related to the occurrence of spikes. Reverse correlation of NL neurons shows that 2–3 ms before the spikes, frequencies within a narrow band were present in the sound (Christianson and Peña 2007). The unusual phase-locking ability of the owl’s auditory neurons (Köppl 1997) produced robust and coherent spike-triggered averages (STA) at high frequencies (Fig. 3a). The spectral analysis of the STAs showed the portion of the acoustic signal that passes the cochlear and neural filters and drives the responses of NL neurons (Fig. 3b). The STA was the estimate of the input used to investigate if the Cross-Correlation theorem applied in NL neurons. To simplify the analysis, it was assumed that the left and right monaural input signals were identical and could be captured by the binaural STA. This assumption was supported by the similarity of monaural iso-intensity frequency response curves of NL neurons (Peña et al. 2001). These data were used to test the prediction of a special case of the Cross-Correlation theorem, the Wiener Khinchin theorem, that the power spectrum of the ITD curve is equal to the square of the power spectrum of the binaural STA.
Fig. 2.
Laminaris neuron recorded with ‘loose patch’. The firing rate is plotted as a function of ITD in response to a broadband stimulus. Two example traces show the response to favorable (60 µs) and unfavorable (−30 µs) ITDs. The post-stimulus time histogram (PSTH) and interspike interval histogram (ISIH) are shown above. Modified from Fischer et al. (2008)
Fig. 3.
Spike-triggered average (STA) and spectrogram in NL. a Example STA in NL. The abscissa indicates time preceding the spike. The number of spikes used to compute the STA is indicated on the plot. b Spectrogram of the STA shown in a, showing the frequency range and latency of aspects of the sound linked to the generation of spikes
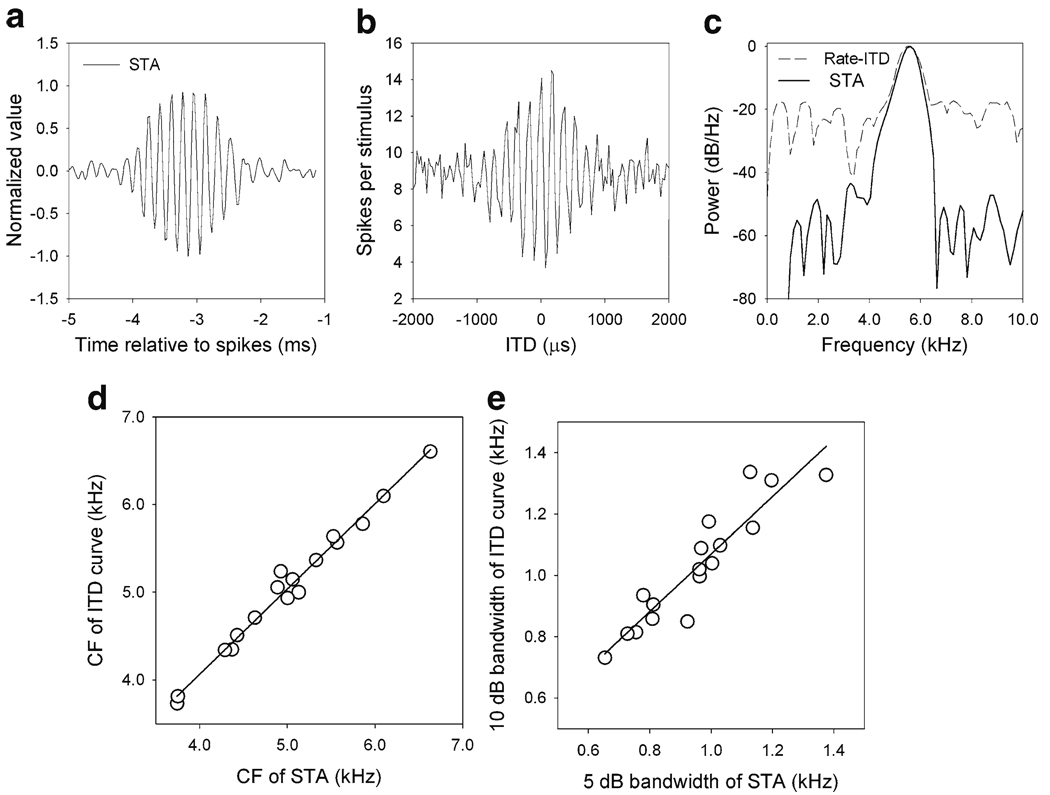
The response of a coincidence detector neuron to broad-band noise is quasi-periodic, but the amplitude of the response decays as the ITD becomes large (Fig. 1). Whether this decay was determined entirely by the spectral properties of the input or by nonlinearities that were added to the processing was the question that initially drove this research. If the neurons were performing a cross-correlation, the spectral analysis of the rate-ITD curve should yield the same band as the spectrum of the STA squared. The study showed that they overlap rather well (Fischer et al. 2008; Fig. 4). Thus, the Wiener– Khinchin theorem appears to apply in NL neurons and the processing behaves as linear in the frequency domain, much like cross-correlation. Further, studies of reverse correlation using uncorrelated sound permitted estimation of the effective monaural inputs and how they interact to produce the neural response (Fischer et al. 2008). Not only did these results reveal that the binaural interaction is consistent with cross-correlation but they also shed light on an important property of ITD detection in NL. They indicated that an unrectified representation of the effective monaural stimulus is reconstructed in the membrane potential, a prediction made by recent models of the owl’s NL (Ashida et al. 2007). Lastly, this work contributed a means to approach coincidence detector neurons in species where inhibition appears to have a role in ITD detection (Brand et al. 2002); if the inhibitory input distorts the shape of the ITD curves, the Wiener–Khinchin relationship could no longer apply to the response of these neurons.
Fig. 4.
Spike-triggered average and ITD tuning. a Spike-triggered average (STA) in response to noise. b ITD response curve (error bars are omitted for clarity). c The power spectral density (PSD) of the STA (solid line) corresponds well with the power spectra of the ITD curve (dashed line). d The center frequency (CF) of the PSD of the STA is highly correlated with the CF of the PSD of the ITD curve (n = 17). The solid line is the regression line. e The 5 dB bandwidth of the PSD of the STA, with sampling rate compensation, is well correlated with the 10 dB bandwidth of the ITD curve (n = 17). The solid line is the regression line. Modified from Fischer et al. (2008)
1.3 Binaural frequency matching
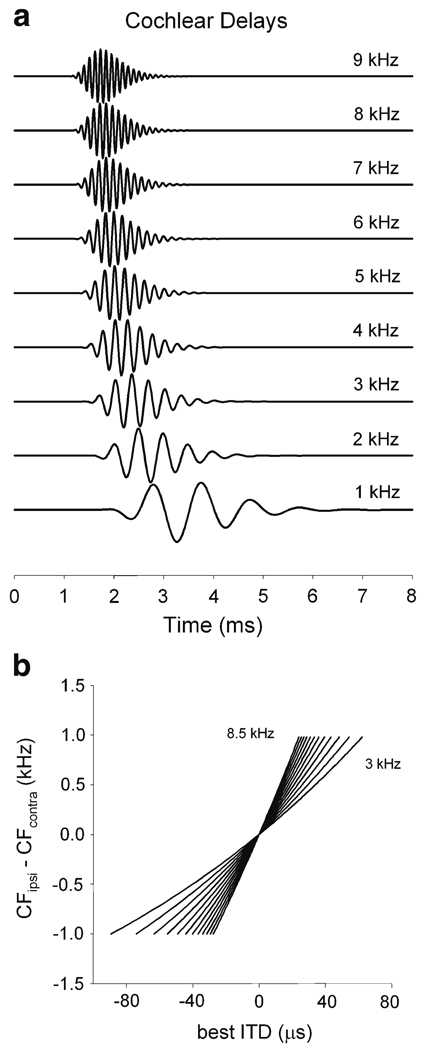
Fischer et al. (2008) assumed that the spectrum of the ipsilateral and contralateral inputs to NL neurons were identical. Whether or not this is true has implications not only for the cross-correlation model but also on how ITD is detected. The ‘cochlear-delays’ theory proposes the existence of interaural disparities in the cochlear loci from which coincidence detectors receive left and right inputs (Schroeder 1977; Shamma et al. 1989). Shamma et al. (1989) suggested that the differences in wave propagation along the cochlea could provide the delays necessary for coincidence detection, if the coincidence detectors receive input from fibers innervating different loci on the left and right basilar membranes. The propagation time of the traveling wave along the basilar membrane causes sites near the oval window (high-characteristic frequency) to respond first and regions further away to respond at later times (von Bekesy 1960). Since cochlear loci translate into frequencies, each coincidence detector in the cochlear-delays model receives left and right inputs from different frequency channels. These spectral disparities determine the ITD to which the coincidence detectors are tuned. If this theory were valid, the ITD tuning of coincidence detectors should be correlated with the magnitude of mismatches in frequency tuning between the two sides. For example, coincidence detectors that receive inputs from left and right auditory neurons tuned to the same frequency would be selective for ITD = 0, because their propagation delays are the same for the two sides. On the other hand, a coincidence detector tuned to a lower frequency on the left side should be tuned to sound with an ITD such that the left ear leads the right ear by the amount of time it takes the cochlear travelling wave to move from the cochlear site that is most sensitive to the frequency on the right to the site of the frequency on the left. Information about the frequency and ITD selectivity of the coincidence detectors is necessary to test this hypothesis. There are reports of unpublished observations in mammals suggesting that there exists some degree of frequency convergence in the cat‘s inferior colliculus (Yin and Kuwada 1983) and indirect evidence that this could also be the case in neurons of the superior olivary complex (Crow et al. 1978). Also, theory predicts that if neurons received frequency-mismatched input from the cochlea, then the distribution of best ITDs observed in mammals could be accounted for (Joris et al. 2006).
The owl’s nucleus laminaris is particularly useful to address the issue of binaural frequency matching because NL neurons perform coincidence detection in a much higher frequency range than neurons of the chicken’s nucleus laminaris or the mammalian medial nucleus of the superior olive. Since cochlear delays show smaller changes per Hz at higher frequencies (Köppl 1997; Fig. 5), larger frequency mismatches are necessary at higher frequencies to measure the same ITD (Shamma et al. 1989). Previous reports showed little interaural disparities in frequency tuning in NL (Peña et al. 2001). Additionally, those neurons with interaural disparities in frequency tuning did not show correlation between their best ITDs and frequency mismatches. However, iso-intensity frequency response curves are a poor estimate of the spectral selectivity of neurons when presented with broad-band sound (Spezio and Takahashi 2003; Fischer et al. 2008). We therefore used reverse correlation to study the bilateral tuning of coincidence detectors. Using uncorrelated sound, we were able to extract the spectrotemporal tuning of the input to auditory coincidence detectors that come from each side. We show here a match in the bilateral frequency tuning that contradicts the prediction of cochlear-delays models.
Fig. 5.
Cochlear delays. Estimates were computed from frequency-dependent latencies of primary auditory fibers of barn owls (reported for group delays in Köppl (1997), in conjunction with the cochlear model of Carney and Yin (1988). a The cochlear delay changes as a function of BF (indicated for each plot). Note that the change in delay is smaller for higher frequencies. b Prediction of how best ITD must change as a function of frequency mismatch and BF using frequency-dependent latencies of primary auditory fibers for the owl (Köppl 1997). BF was changed in steps of 0.5 kHz and is indicated for the lower (3 kHz) and upper (8.5 kHz) limits. Modified from Peña et al. (2001)
2 Methods
Methods for surgery, stimulus delivery, and electrophysiology have been described previously (Fischer et al. 2008).
2.1 Data collection
Previous work (Carr and Konishi 1990; Fischer et al. 2008), and the lack of evidence of phase-locked inhibition in the avian NL (Yang et al. 1999) suggest that, in the owl, the characteristic delay (CD; Rose et al. 1966) should fall at or near peaks of the rate-ITD function. Therefore, for the sake of consistency between neurons we used tonal ITD-rate functions to estimate a frequency-independent ITD, as described in Peña et al. (2001). This method will reliably produce the CD when the CD falls at a peak (Yin and Kuwada 1984), and we refer to this ITD as the estimated CD.
Data for monaural reverse correlation were obtained by presenting binaurally uncorrelated 100 ms band-limited Gaussian white noise (0.5–12,000 kHz) signals over head-phones; stimuli were presented with an inter-stimulus interval of 500 ms. For each stimulus presentation, the signals were synthesized de novo to avoid correlation artifacts.
2.2 Analysis
The window of the reverse correlation (i.e., the amount of stimulus preceding each spike that was considered in the analysis) was 15 ms; manual examination indicated that none of the neurons in our population had a response function whose temporal extent exceeded that limit. To ensure that segments of the inter-stimulus interval and the rise period of the stimulus were not included in the reverse correlation analysis (or, in other words, to guarantee that the reverse correlation was done on a signal with stationary statistics), spikes that occurred in the 20 ms immediately following stimulus onset were excluded; this exclusion was also sufficient to guarantee that the onset transient was excluded and that the neuron had reached a stable firing rate, and we encountered no neurons that had onset-only responses. After this exclusion, a large number of spikes remained for consideration (average number of spikes used in the reverse correlation analysis per neuron: 9, 907 ± 3, 214).
By estimating the effective monaural inputs using binaurally uncorrelated stimuli, rather than with monaural stimulation, we avoid any possible confound arising from leaving the unstimulated side in an undefined state of spontaneous firing. This approach ensures that the stimulus is uncorrelated across both time and input channels. The coincidence detector model predicts that the resulting spike train contains spikes that can be grouped into one of three categories: those resulting from coincidences between spikes from the left-side monaural input population, those elicited by coincidences in the right-side monaural input population, and those arising from coincidences between the two channels. In a spike-triggered average of the left-side stimulus, only the first category of spikes will contribute in a consistent manner; all other spikes are uncorrelated with the left-side stimulus by construction, and will be eliminated by the averaging process.
We tested the prediction of the Cross-Correlation theorem by comparing the power spectral density (PSD) of the ITD response curve and the product of the PSDs of the monaural STAs (see supplementary materials, Fischer et al. 2008). We compared the locations of the peaks in the PSDs using the center frequency of the 10 dB bandwidth. Power spectral density was estimated with the MATLAB implementation of Thomson’s multi-taper method. The reverse correlation was done with a 15 ms window at a sampling rate of 48,077 Hz, while the ITD curve was sampled with 30 ms resolution over a range of no more than 4.8 ms. To remove the effects due to the differences in sampling rate and temporal extent, the reverse correlation data was down-sampled to the sampling rate of the ITD curve, and then a time window matching that of the ITD curve was chosen about the maximum absolute value of the STA.
3 Results
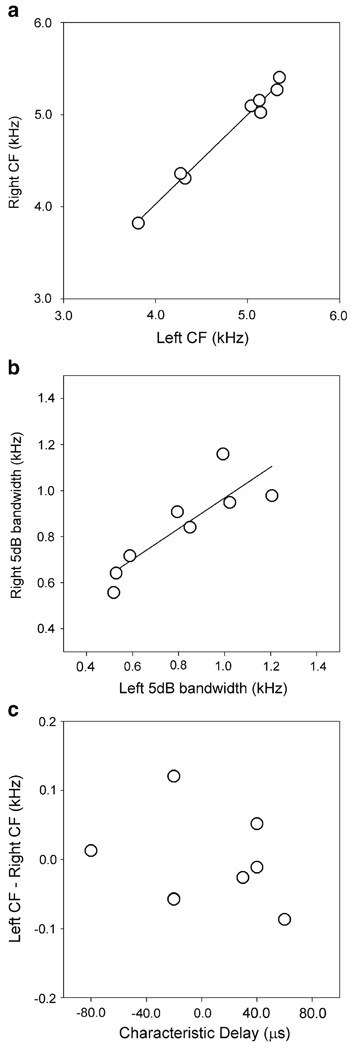
Reverse correlation analysis showed that themonaural inputs to the auditory coincidence detectors have well matched frequency selectivity (Fig. 6, Fig 7).We computed monaural STAs for eight neurons using responses to binaurally uncorrelated stimuli. The size of the sample is due to difficulty in collecting these data, which included estimating the characteristic delay, measuring the iso-intensity frequency–response, measuring ITD tuning for a long range of ITDs, and collecting data for reverse correlation with correlated and uncorrelated sound stimulation. Although we could perform these recordings only in a small subset of neurons, the trend seems clear. The center frequency (CF) of the power spectral density (PSD) of the monaural STAs on the left and right sides were highly correlated (regression 0.97x ± 0.14 kHz; r2 = 0.99) (Fig. 6a). The difference between the left and right CFs was in the range −87–121 Hz for the eight neurons. The range of differences between the left and right CFs fell within the range computed for monaural iso-intensity frequency–response curves (−514–188.2 Hz) in a previous study (Peña et al. 2001). We also found correlation between the left and right 5 dB-bandwidths of the PSDs of the monaural STAs (regression 0.67x + 0.30 kHz; r2 = 0.74; Fig. 6b).
Fig. 6.
Bilateral frequency mismatch and ITD tuning. The center frequencies (a) and the 5 dB bandwidths (b) of the PSDs of the left and right STAs were highly correlated. However, the difference between the left and right center frequencies was not correlated with the CD of the coincidence detector (c). Two points overlap in plot c near (−20,−0.06). Linear regressions are shown for a and b
Fig. 7.
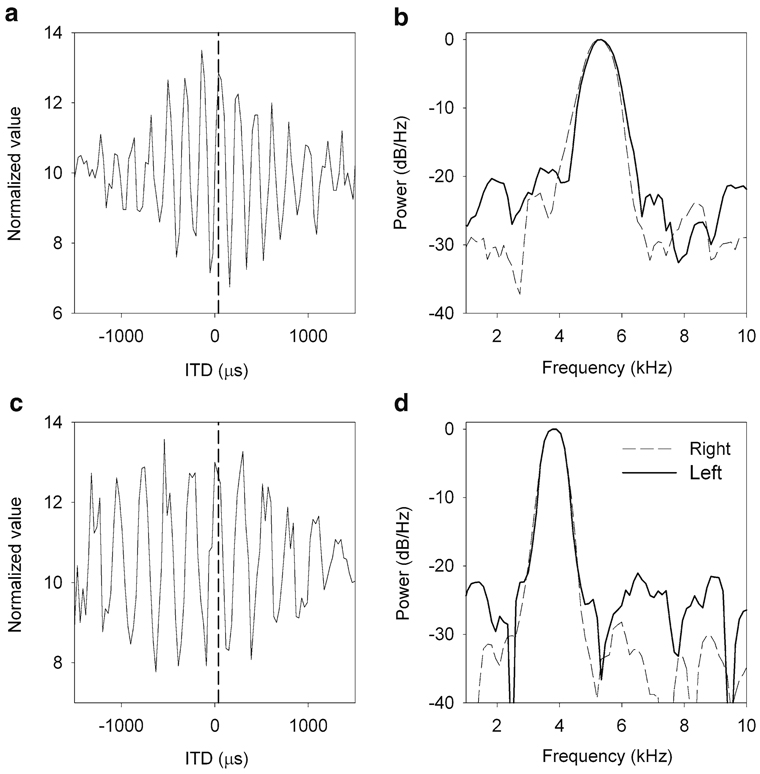
Examples ITD tuning and monaural frequency tuning. a, c Rate–ITD curves (error bars are omitted for clarity) of two neurons exhibiting a similar characteristic delay (indicated by dashed vertical lines). b, d Power spectra of monaural STAs for the left (dashed line) and right (solid line) side corresponding to the neurons in a and c
The difference between the left and right CFs was not correlated with the preferred ITD of the coincidence detector. An essential prediction of models that use cochlear delays to explain ITD tuning is that neurons with identical frequency tuning should have characteristic delays (CD) near zero (Shamma et al. 1989). Even though the sample is small, it is possible to see that neurons with a nearly perfect match of bilateral frequency tuning show CDs that are different from 0 and vice versa (Fig. 6c). Specifically, Fig. 7 shows two examples of neurons with CDs of 40 µs, right ear leading the left one. The CF of the PSD of the binaural STA of the neuron on the top is 5.3 kHz. According to the cochlear delay theory (Schroeder 1977; Shamma et al. 1989) and previous measurements of cochlear delays in barn owls (Köppl 1997), this neuron should show a mismatch of around 990 Hz with the right side being lower than the left side (Peña et al. 2001). However, the CF on the right side is only 51.5 Hz lower than the CF on the left side. Similarly, the CD of the neuron at the bottom of Fig. 7 is 40 µs, right side leading, but a center frequency of 3.8 kHz. The cochlear delays theory would predict a mismatch of 758 Hz, right side lower. However, the left side is 11.1 Hz lower than the right.
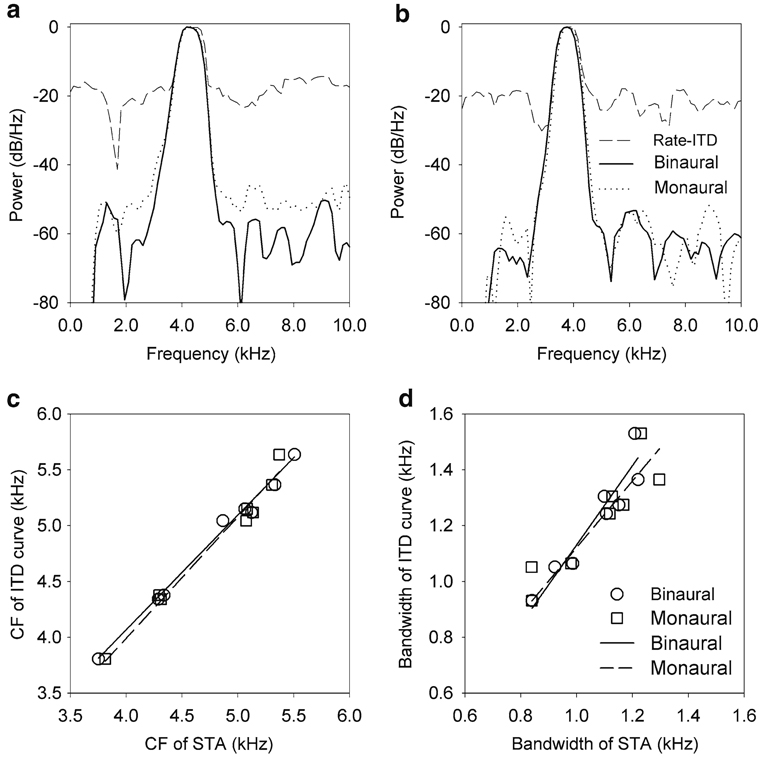
We tested the prediction of the Cross-Correlation theorem that the power spectrum of the ITD response curve is equal to the product of the power spectra of the effective monaural stimuli. This is a generalization of our previous test of the Wiener Khinchin theorem where we showed that the power spectrum of the ITD response curve is well described by the square of the power spectrum of the binaural STA (Fischer et al. 2008). By using binaural STAs, Fischer et al. (2008) made the implicit assumption that left and right inputs were identical and that therefore the cross-correlation could be treated as an autocorrelation. In this paper we go further to show that when left and right filters are specified, cross-correlation applies. Using the monaural spike triggered averages as the effective monaural stimuli we find that the power spectrum of the ITD response curve is consistent with the product of the power spectra of the monaural STAs (Fig. 8), as predicted by the Cross-Correlation theorem. Furthermore, the product of the power spectra of the monaural STAs is consistent with the square of the power spectrum of the binaural STA (Fig. 8a, b), thus confirming our previous assumption of binaural frequency matching. While the product of the power spectra of the monaural STAs and the square of the power spectrum of the binaural STA were very similar, the product of the power spectra of the monaural STAs better matched the power spectrum of the ITD response curve than did the square of the power spectrum of the binaural STA; the root-mean-square (RMS) difference between the log-PSD of the ITD curve and the log of the product of the PSDs of the monaural STAs was smaller than the RMS difference between the log-PSD of the ITD curve and the log of the squared PSD of the binaural STA for all but one neuron (median 2.0 dB/Hz smaller in the monaural condition dB/Hz, interquartile range 2.3 dB/Hz). The CFs of the PSD of the ITD response curve and the product of the power spectra of the monaural STAs were highly correlated (regression 1.06x–229.36 Hz, n = 8; r2 = 0.98) (Fig. 8c, squares). As shown previously for a larger population (Fischer et al. 2008), the CFs of the PSD of the ITD response curve and the square of the PSD of the binaural STA were also highly correlated (regression 1.02x–27.87 Hz, n = 8; r2 = 0.99) (Fig. 8c, circles). The 10 dB bandwidths of the ITD response curve and the product of the power spectra of the monaural STAs were highly correlated (regression 1.03x–108.61 Hz, n = 8; r2 = 0.84) (Fig. 8d, squares). Consistent with our previous report (Fischer et al. 2008), the 10 dB bandwidth of the ITD response curve and the 5 dB bandwidth of the binaural STA were also highly correlated (regression 1.34x– 211.20 Hz, n = 8; r2 = 0.90) (Fig. 8d, circles). Note that for both monaural and binaural cases, the reverse correlation data was down-sampled to account for the fact that the ITD response curve was sampled at much lower resolution than the reverse correlation data (see Sect. 2; Fischer et al. 2008). Thus, within our experimental resolution, the Cross-Correlation theorem applies to coincidence detection in NL.
Fig. 8.
Testing the Cross Correlation theorem using monaural STAs. a, b Two examples showing that the power spectrum of the ITD response curve (dashed lines) is consistent with both the product of the power spectra of the effective monaural stimuli (dotted lines) and the square of the power spectrum of the effective binaural stimulus (solid line). c The center frequencies (CF) of the PSD of the ITD curves were highly correlated with the CFs of the product of the power spectra of the monaural STAs (squares), as well as with the CFs of the squared power spectra of the binaural STAs (circles). d Similarly, the 10 dB bandwidth of the ITD response curves were well correlated with the product of the power spectra of the monaural (squares) and the squared power spectra of the binaural (circles) STAs. Linear regressions for each dataset are shown in c and d
4 Discussion
The bilateral frequency tuning of coincidence detector units is a critical issue in sound localization. It is not only relevant for how ITD is detected, but also for how information from both ears is combined and conveyed to higher order centers.
One important aspect of the bilateral frequency tuning is its implications on the cross-correlation process that takes place in NL neurons. A running cross-correlation was derived for coincidence detectors by Licklider (1959) and has later been used in several models of sound localization (Sayers and Cherry 1957; Jeffress and Robinson 1962; Blauert and Cobben 1978; Stern et al. 1988; Saberi 1996). Cross-correlation indicates the degree of similarity between the left and right input signals, which is useful for many aspects of spatial hearing. We have previously demonstrated that this process describes the response of NL neurons, to the extent that the Wiener Khinchin theorem can be shown to apply (Fischer et al. 2008). Here we show a high level of matching in the frequency tuning of monaural STAs. As expected, the more general Cross-Correlation theorem, which does not make the assumption of equality between both inputs, also applies to the response of NL neurons. More-over, testing the Cross-Correlation theorem and the Wiener Khinchin theorem yield similar results. The reverse correlation data presented here indicates that the monaural input signals driving coincidence detectors are effectively identical, except for differences imposed by direction-dependent filtering.
In the cochlear-delays model, the equality of left and right inputs to a coincidence detector could still hold even if the cochlear loci of the left and right inputs differed. In principle, a sound of a given frequency may induce basilar membrane vibrations that spread into neighbouring regions of the cochlea. These regions would not be responding to a signal at their best frequency but could produce an output with essentially the same spectrum on the left and right sides though coming from different cochlear loci. A conflict arises, however, because in order to detect an ITD of 100 µs at a frequency range of 5 kHz, the inputs from both sides would have to stimulate areas of the cochlea with center frequencies in the range of 2 kHz away from each other. Such a mismatch is unlikely to drive the response in NL neurons, which exhibit mean iso-intensity frequency–response curve widths of 1.43 kHz (Peña et al. 2001).
Several elements play against the likelihood of the cochlear-delays model being implemented in the owl’s auditory system. Most NL neurons represent sound directions in the frontal and contralateral hemifield, i.e., neurons prefer ITDs in which sounds reach the contralateral ear synchronously or earlier than the ipsilateral ear. In the cochlear-delays model, this would require that the frequency tuning of a coincidence detector be always the same or higher (a cochlear locus nearer to the base) on the ipsilateral side than on the contralateral side. Letting aside the developmental complexities that wiring up such network would bring about, the downstream processing would have to decode an ITD-dependent shift in frequency tuning from the coincidence detectors output, i.e., coincidence detectors that respond to more laterally located stimuli would be more broadly tuned to frequency. Also, the cochlear-delays model does not consider the effects of sound level on ITD detection. The timing of phase locked impulses changes with both sound level and frequency in nucleus magnocellularis and NL neurons (Sullivan and Konishi 1984; Viete et al. 1997). Shifts in phase increase at a rate of 0.0021 µs/dB Hz−1 as the stimulating frequency departs from the neuron’s best frequency (BF; Viete et al. 1997). The direction of phase shifts depends on the sign of frequency differences with respect to the neuron’s BF. Thus, a frequency higher than BF in one ear and a frequency lower than BF in the other ear may result in a large shift in the neuron’s best ITD. However, NL neurons do not change their best ITDs in response to variation in sound intensity when it is the same for the two sides (Peña et al. 1996). Taken together, NL neurons do not behave as if cochlear-delays played a significant role in their processing.
In conclusion, reverse correlation analysis using binaurally uncorrelated stimuli supports the claim that binaural inputs to coincidence detectors in NL are matched for frequency selectivity. This provides further evidence that the computation of ITD in the owl is consistent with both the Jeffress model and its extension, the cross-correlation model.
Acknowledgments
We are grateful to Mark Konishi, for his mentor-ship and support, and to Bjorn Christianson, for his collaboration with data analysis. This work was funded by the NIH grant DC007690 to J.L.P.
Contributor Information
Brian J. Fischer, Division of Biology, California Institute of Technology, Pasadena, CA 91125, USA
José Luis Peña, Dominick P. Purpura Department of Neuroscience, Albert Einstein College of Medicine, Bronx, NY 10461, USA, e-mail: jpena@aecom.yu.edu.
References
- Ashida G, Abe K, Funabiki K, Konishi M. Passive soma facilitates submillisecond coincidence detection in the owl’s auditory system. J Neurophysiol. 2007;97:2267–2282. doi: 10.1152/jn.00399.2006. [DOI] [PubMed] [Google Scholar]
- Batra R, Yin TCT. Cross correlation by neurons of the medial superior olive: a reexamination. JARO. 2004;5:238–252. doi: 10.1007/s10162-004-4027-4. [DOI] [PMC free article] [PubMed] [Google Scholar]
- Blauert J, Cobben W. Some consideration of binaural cross-correlation analysis. Acustica. 1978;39:96–104. [Google Scholar]
- Brand A, Behrend O, Marquardt T, McAlpine D, Grothe B. Precise inhibition is essential for microsecond interaural time difference coding. Nature. 2002;417:543–547. doi: 10.1038/417543a. [DOI] [PubMed] [Google Scholar]
- Carney LH, Yin TCT. Temporal coding of resonances by low-frequency auditory nerve fibers: Single fiber responses and a population model. J Neurophysiol. 1988;60:1653–1677. doi: 10.1152/jn.1988.60.5.1653. [DOI] [PubMed] [Google Scholar]
- Carr CE, Konishi M. Axonal delay lines for the time measurement in the owl’s brainstem. Proc Natl Acad Sci USA. 1988;85:8311–8315. doi: 10.1073/pnas.85.21.8311. [DOI] [PMC free article] [PubMed] [Google Scholar]
- Carr CE, Konishi M. A circuit for detection of interaural time differences in the brain stem of the barn owl. J Neurosci. 1990;10:3227–3246. doi: 10.1523/JNEUROSCI.10-10-03227.1990. [DOI] [PMC free article] [PubMed] [Google Scholar]
- Christianson GB, Peña JL. Preservation of spectrotemporal tuning between the nucleus laminaris and the inferior colliculus of the barn owl. J Neurophysiol. 2007;97:3544–3553. doi: 10.1152/jn.01162.2006. [DOI] [PMC free article] [PubMed] [Google Scholar]
- Crow G, Rupert A, Moushegian G. Phase-locking in monaural and binaural medullary neurons: implications for binaural phenomena. J Acoust Soc Am. 1978;64:493–501. doi: 10.1121/1.381999. [DOI] [PubMed] [Google Scholar]
- de Boer E, de Jongh HR. On cochlear encoding: potentialities and limitations of the reverse-correlation technique. J Acoust Soc Am. 1978;63:115–135. doi: 10.1121/1.381704. [DOI] [PubMed] [Google Scholar]
- Fischer BJ, Christianson GB, Pena JL. Cross-correlation in the auditory coincidence detectors of owls. J Neurosci. 2008;28:8107–8115. doi: 10.1523/JNEUROSCI.1969-08.2008. [DOI] [PMC free article] [PubMed] [Google Scholar]
- Goldberg JM, Brown PB. Response of binaural neurons of dog superior olivary complex to dichotic tonal stimuli: some physiological mechanisms for sound localization. J Neurophysiol. 1969;32:613–636. doi: 10.1152/jn.1969.32.4.613. [DOI] [PubMed] [Google Scholar]
- Heffner RS, Heffner EH. Evolution of sound localization in mammals. In: Webster DB, Fay RR, Popper AN, editors. The evolutionary biology of hearing. New York: Springer; 1992. pp. 691–715. [Google Scholar]
- Jeffress LA. A place theory of sound localization. J Comp Physiol Psychol. 1948;41:35–39. doi: 10.1037/h0061495. [DOI] [PubMed] [Google Scholar]
- Jeffress LA, Robinson DA. Formulas for coefficient of interaural correlation for noise. J Acoust Soc Am. 1962;34:1658. [Google Scholar]
- Joris P, Yin TCT. A matter of time: internal delays in binaural processing. Trends Neurosci. 2007;30:70–78. doi: 10.1016/j.tins.2006.12.004. [DOI] [PubMed] [Google Scholar]
- Joris PX, Van de Sande B, Louage DH, van der Heijden M. Binaural and cochlear disparities. Proc Natl Acad Sci. 2006;103:12917–12922. doi: 10.1073/pnas.0601396103. [DOI] [PMC free article] [PubMed] [Google Scholar]
- Keller CH, Hartung K, Takahashi TT. Head-related transfer functions of the barn owl: measurement and neural responses. Hear Res. 1998;118:13–34. doi: 10.1016/s0378-5955(98)00014-8. [DOI] [PubMed] [Google Scholar]
- Köppl C. Frequency tuning and spontaneous activity in the auditory nerve and cochlear nucleus magnocellularis in the barn owl Tyto alba. J Neurophysiol. 1997;77:364–377. doi: 10.1152/jn.1997.77.1.364. [DOI] [PubMed] [Google Scholar]
- Köppl C, Carr CE. Maps of interaural time difference in the chicken’s brainstem nucleus laminaris. Biol Cybern. 2008;98:541–559. doi: 10.1007/s00422-008-0220-6. [DOI] [PMC free article] [PubMed] [Google Scholar]
- Licklider JCR. Three auditory theories. In: Koch S, editor. Psychology: a study of a science. New York: McGraw-Hill; 1959. pp. 41–144. [Google Scholar]
- McAlpine D, Jiang D, Palmer AR. A neural code for low-frequency sound localization in mammals. Nat Neurosci. 2001;4:396–401. doi: 10.1038/86049. [DOI] [PubMed] [Google Scholar]
- Moiseff A. Bi-coordinate sound localization by the barn owl. J Comp Physiol A. 1989;164:637–644. doi: 10.1007/BF00614506. [DOI] [PubMed] [Google Scholar]
- Peña JL, Viete S, Albeck Y, Konishi M. Tolerance to sound intensity of binaural coincidence detection in the nucleus laminaris of the owl. J Neurosci. 1996;16:7046–7054. doi: 10.1523/JNEUROSCI.16-21-07046.1996. [DOI] [PMC free article] [PubMed] [Google Scholar]
- Peña JL, Viete S, Funabiki K, Saberi K, Konishi M. Cochlear and neural delays for coincidence detection in owls. J Neurosci. 2001;21:9455–9459. doi: 10.1523/JNEUROSCI.21-23-09455.2001. [DOI] [PMC free article] [PubMed] [Google Scholar]
- Poganiatz I, Nelken I, Wagner H. Sound-localization experiments with barn owls in virtual space: influence of interaural time difference on head-turning behavior. J AssocRes Otolaryngol. 2001;2:1–21. doi: 10.1007/s101620010039. [DOI] [PMC free article] [PubMed] [Google Scholar]
- Rose JE, Gross NB, Geisler CD, Hind JE. Some neural mechanisms in the inferior colliculus of the cat which may be relevant to localization of a sound source. J Neurophysiol. 1966;29:288–314. doi: 10.1152/jn.1966.29.2.288. [DOI] [PubMed] [Google Scholar]
- Saberi K. An auditory illusion predicted from a weighted cross-correlation model of binaural interaction. Psychol Rev. 1996;103:137–142. doi: 10.1037/0033-295x.103.1.137. [DOI] [PubMed] [Google Scholar]
- Sayers B, Cherry EC. Mechanism of binaural fusion in the hearing of speech. J Acoust Soc Am. 1957;29:973–987. [Google Scholar]
- Schroeder MR. New viewpoints in binaural interactions. In: Evans EF, Wilson JP, editors. Psychophysics and physiology of hearing. New York: Academic Press; 1977. pp. 455–467. [Google Scholar]
- Shamma SA, Shen N, Gopalaswamy P. Stereausis: binaural processing without neural delays. J Acoust Soc Am. 1989;86:989–1006. doi: 10.1121/1.398734. [DOI] [PubMed] [Google Scholar]
- Spezio ML, Takahashi TT. Frequency-specific interaural level difference tuning predicts spatial response patterns of space-specific neurons in the barn owl inferior colliculus. J Neurosci. 2003;23:4677–4688. doi: 10.1523/JNEUROSCI.23-11-04677.2003. [DOI] [PMC free article] [PubMed] [Google Scholar]
- Spitzer MW, Semple MN. Neurons sensitive to interaural phase disparity in gerbil superior olive: diverse monaural and termporal response properties. J Neurophysiol. 1995;73:1668–1690. doi: 10.1152/jn.1995.73.4.1668. [DOI] [PubMed] [Google Scholar]
- Stern RM, Zeiberg AS, Trahiotis C. Lateralization of complex binaural stimuli: a weighted-image model. J Acoust Soc Am. 1988;84:156–165. doi: 10.1121/1.396982. [DOI] [PubMed] [Google Scholar]
- Sullivan WE, Konishi M. Segregation of stimulus phase and intensity coding in the cochlear nucleus of the barn owl. J Neurosci. 1984;4:1787–1799. doi: 10.1523/JNEUROSCI.04-07-01787.1984. [DOI] [PMC free article] [PubMed] [Google Scholar]
- Sullivan WE, Konishi M. Neural map of interaural phase difference in the owl’s brainstem. Proc Natl Acad Sci. 1986;83:8400–8404. doi: 10.1073/pnas.83.21.8400. [DOI] [PMC free article] [PubMed] [Google Scholar]
- Viete S, Peña JL, Konishi M. Effects of interaural intensity difference on the processing of interaural time difference in the owl's nucleus laminaris. J Neurosci. 1997;17:1815–1824. doi: 10.1523/JNEUROSCI.17-05-01815.1997. [DOI] [PMC free article] [PubMed] [Google Scholar]
- von Bekesy G. Experiments in hearing. NewYork: McGraw-Hill; 1960. [Google Scholar]
- von Campenhausen M, Wagner H. Influence of the facial ruff on the sound-receiving characteristics of the barn owl’s ears. J Comp Physiol A. 2006;192:1073–1082. doi: 10.1007/s00359-006-0139-0. [DOI] [PubMed] [Google Scholar]
- Wagner H, Asadollahi A, Bremen P, Endler F, onderschen K, Campenhausen Mvon. Distribution of interaural time difference in the Barn Owl’s inferior colliculus in the low- and high-frequency ranges. J Neurosci. 2007;27:4191–4200. doi: 10.1523/JNEUROSCI.5250-06.2007. [DOI] [PMC free article] [PubMed] [Google Scholar]
- Yang L, Monsivais P, Rubel EW. The superior olivary nucleus and its influence on nucleus laminaris: A source of inhibitory feed-back for coincidence detection in the avian auditory brainstem. J Neurosci. 1999;19:2313–2325. doi: 10.1523/JNEUROSCI.19-06-02313.1999. [DOI] [PMC free article] [PubMed] [Google Scholar]
- Yin TCT, Chan JCK. Interaural time sensitivity in the medial superior olive of the cat. J Neurophysiol. 1990;64:465–488. doi: 10.1152/jn.1990.64.2.465. [DOI] [PubMed] [Google Scholar]
- Yin TCT, Chan JCK, Carney LH. Effects of interaural time delays of noise stimuli on low-frequency cells in the cat’s inferior colliculus. III. Evidence for cross-correlation. J Neurosci. 1987;58:562–583. doi: 10.1152/jn.1987.58.3.562. [DOI] [PubMed] [Google Scholar]
- Yin TCT, Kuwada S. Binaural interaction in low-frequency neurons in inferior colliculus of the cat. III. Effects of changing frequency. J Neurophysiol. 1983;50:1020–1042. doi: 10.1152/jn.1983.50.4.1020. [DOI] [PubMed] [Google Scholar]
- Yin TCT, Kuwada S. Neuronal mechanisms of binaural interaction. In: Edelman GM, Gall WE, Cowan WM, editors. Dynamic aspects of neocortical function. New York: Wiley; 1984. pp. 263–313. [Google Scholar]


