Abstract
Ultrasound contrast agents (UCAs) are designed to be used below 10 MHz, but interest is growing in studying the response of agents to high-frequency ultrasound. In this study, the subharmonic response of polymer-shelled UCAs with a mean diameter of 1.1 μm excited with 40-MHz tone-bursts of 1–20 cycles was analyzed. UCAs were diluted in water and streamed through a flow phantom that permitted single-bubble backscatter events to be acquired at peak-negative pressures from 0.75 to 5.0 MPa. At each exposure condition, 1000 single-bubble-backscatter events were digitized. Subharmonic content at 20 MHz was screened using a conventional and a singular-value-decomposition (SVD) method. The conventional method evaluated each event spectrum individually while the SVD method treated the 1000-event data set at one time. A subharmonic score (SHS) indicative of how much subharmonic content a 1000-event data set contained was computed for both methods. Empirical-simulation results indicated that SHSs obtained from the two methods were linearly related. Also, experimental data with both methods indicated that subharmonic likelihood increased with pulse duration and peaked near 2 MPa. The SVD method also yielded quantitative information about subharmonic events not available with the conventional method.
INTRODUCTION
Conventional ultrasound contrast agents (UCAs) are designed for clinical use at frequencies below 10 MHz. Typical UCAs usually have a mean diameter of 2–4 μm where a larger bubble typically has a lower resonance frequency.1 Only recently, UCAs specifically designed for high-frequency ultrasound (HFU) (>20 MHz) have started to become available. For example, VisualSonics (Toronto ON, Canada) now has three types of commercially-available UCAs called MicroMarker™, and studies are being conducted to investigate angiogenesis in animal models of cancers.2, 3 Nevertheless, many existing and experimental UCAs originally designed for conventional frequencies are currently under investigation for use with HFU. Interest is growing in this field because high-frequency UCAs can be valuable for clinical and pre-clinical studies where HFU is routinely used. For example, high-frequency UCAs could allow evaluating microcirculation for ophthalmic disease diagnosis.4 UCAs could also be used in small-animal imaging applications to evaluate the normal and abnormal cardiovascular development of genetically-engineered mouse embryos.5
The earliest HFU studies of UCAs were conducted using broad-band excitations,6, 4, 7 but the results typically showed backscatter centered at the transducer center frequency and no significant harmonic content was detected. The lack of harmonic content makes clinical use of UCAs with HFU limited because conventional non-linear imaging methods cannot be used to separate UCA echoes from tissue echoes. More recently, Goertz et al.8, 9 reported generation of harmonic and subharmonic backscatter components for Definity® (Bristol-Myers Squibb, New York, NY) when excited with narrow-band HFU signals. Specifically, Definity® was excited with a tone-burst consisting of 4–10 cycles at either 20 or 30 MHz. The observation of harmonics was unexpected because few UCAs in the submicron size range are expected to exist in a given dose, and, from the theory of free bubbles, the expectation is that relatively high pressures would be required to excite a bubble nonlinearly with HFU. In subsequent studies, Goertz et al.10, 11 also observed harmonic backscatter from Optison™ (GE Healthcare, Chalfont St. Giles, UK) and a Bracco agent (Princeton, NJ), although at a much weaker pressure level than observed with Definity®. Theoretical work by Allen et al.12 suggested that shell waves may contribute to high-frequency backscatter components in lipid-shelled UCAs. The apparent unexpected strong harmonic backscatter produced by Definity® and the lack of similar observations for other agents point to the need to better understand UCA response to HFU excitation. In particular, the physical origin of the subharmonic emissions is still unclear and, more importantly, the optimal excitation conditions to generate them are therefore difficult to determine.
More recently, subharmonic responses of Definity® were used for intravascular ultrasound (IVUS) imaging.13 The results of this study indicated that because subharmonic signals can originate only from UCAs, subharmonic contrast IVUS has potential as a new method for vasa vasorum imaging. The same property was also exploited in a pulse-wave Doppler study using UCAs and HFU14 to suppress tissue echo signals by appropriate band-pass filtering in the subharmonic band of the UCA response. Such filtering was shown to allow higher frame rates and better sensitivity to microvascular flow.
In a previous study,15 we reported experimental and theoretical results for three types of polymer-shelled UCAs [POINT Biomedical (POINT Biomedical is no longer in operation), San Carlos, CA] with mean diameters of 0.56, 1.1, and 3.4 μm.16, 17 UCAs were excited with tone-bursts from 1 to 20 cycles using a 40-MHz, spherically-focused transducer. Results showed that subharmonic responses could be observed for the three types of UCAs.
In the present study, we investigate new methods and report new results for the polymer-shelled UCAs having a mean diameter of 1.1 μm. The UCAs were excited with tone-bursts from 1 to 20 cycles using the same 40-MHz, spherically-focused transducer, and peak-rarefactional pressure was varied from 0.7 to 5 MPa. A new experimental system was developed to allow acquiring backscatter signals from a single UCA under controlled conditions. Single-bubble-backscatter signals were examined for subharmonic content with two different methods. The first, or conventional, method consisted of screening the spectrum of the backscattered signals for energy near 20 MHz, and the second, or singular-value-decomposition (SVD), method used advanced statistical methods.
The rationale for SVD is that under the same experimental conditions (i.e., UCA, peak-rarefactional pressure, excitation duration, etc.) single-bubble events can be interpreted as the realizations of a random process (i.e., bubble oscillations under the same exposure conditions). Therefore, this study proposes implementing SVD to analyze and classify the subharmonic response of UCAs in a statistically optimal fashion.18, 19, 20 We investigated whether SVD could serve as a valuable tool for understanding bubble dynamics because of its ability to decompose bubble events into an optimal orthonormal base of eigenvectors. The decomposition of UCA echoes onto this SVD-derived base is statistically optimal in the sense that the greatest variance by any projection of the data comes to lie on the first eigenvector, the second greatest variance on the second eigenvector, and so on. The rationale will be to examine the first few eigenvectors for their spectral content and we anticipate that the first eigenvector will correspond to the linear, or normal, response of the bubble. The remaining eigenvectors will be analyzed for the presence of strong spectral content at 20 MHz. We expect SVD processing to be very robust because it will be applied to data sets composed of 1000 events (i.e., realizations). In particular, unwanted data (e.g., adjacent bubbles, moving bubble, excitation failures, etc.) can be easily discarded because these events, unlike the valid events, will have very low energy in the first (and most significant) eigenvector.
The aim of this study was to validate the SVD method as a tool to detect and characterize subharmonic emissions from HFU excitation of UCAs. While the proposed SVD method could be applied at any frequency and for the detection of higher-order harmonics, we are interested in HFU because of the fine-scale image resolution that HFU provides and in subharmonics because tissue generates significant levels of high-order harmonics which makes it difficult to distinguish between UCA and tissue harmonics. Subharmonics are not generated in tissue and, therefore, any subharmonic emissions are related to the nonlinear oscillations of UCAs.
MATERIAL AND METHODS
Contrast agents
The UCAs used in this study were nitrogen-filled, polycaprolactone-shelled agents with a mean diameter of 1.1 μm (POINT Biomedical, model No. 1466). These agents were termed P2 in the previous study.15 The UCAs were received in a dry form, and a small amount of agent was reconstituted in water for each experiment. Therefore, the gas content of the agents diffused into air over time because the agents were not stored with a nitrogen head after the vial was opened. Experiments were performed by mixing a small amount of agent into 100 ml of deionized, filtered water. The mass of the agents utilized for each experiment was not quantified, but was chosen to provide a consistent rate of single-agent-backscatter events. The water had been briefly degassed by gently stirring 1 l under vacuum for 1 min. The 1-l solution was then returned to atmospheric pressure for at least 12 h. The purpose was not to achieve partial saturation, but to ensure normal 100% gas saturation without the buildup of bubbles on surfaces that typically occurs when water is poured into a container. During experiments, the water was stirred with a magnetic stirring bar to ensure mixing and to reduce the likelihood of the agents sorting themselves by size over time due to buoyancy effects.
Flow system
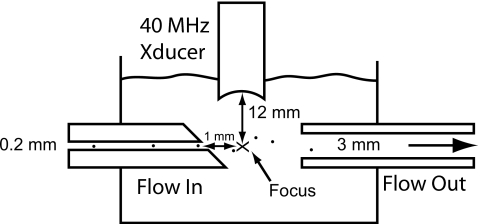
Contrast agents were passed through a flow system and injected into the focal zone of the transducer. The intent of the system was to excite the contrast agents under unconstrained conditions in open fluid. The flow system consisted of a dual-channel tubing pump (REGLO Digital MS-2/8, Ismatec, Glattbrugg, Switzerland) and a flow phantom (Fig. 1). The flow phantom measured 55×77×38 mm3 and had an input and output channel separated by 5 mm. The tubing pump was used with 2.06-mm inner diameter (ID) tubing (CP-95608-42, Cole-Parmer, Vernon Hills, IL) in a push-pull configuration, and the flow volume was set to the minimum value of 0.328 ml∕min. One line of the pump drew the diluted mixture of contrast agent from a 100-mL reservoir and injected agents into the flow phantom through a 3-cm-long, 200-μm ID channel (Masterflex Tygon EW-95609-10, Cole-Parmer). The input channel was cut at an angle to provide a specular surface that could be aligned with the transducer focal zone. The flow velocity within the 200-μm channel was 174 mm∕s (assuming plug flow), but the actual flow velocity after injection into the bulk fluid would be lower. A second line of the pump drew liquid out of the phantom into a waste reservoir.
Figure 1.
Flow phantom schematic. The input port had a 200-μm ID and the output port had a 3-mm ID. A tubing pump controlled the flow in and out of the phantom. The input channel was cut at an angle to facilitate alignment of the transducer focal zone with the opening.
Exposure conditions
The contrast agents were exposed to 40-MHz tone-bursts of 1, 3, 5-10, 15, and 20 cycles. Experiments were conducted with a 40-MHz transducer (PI 50-2 Panametrics, Waltham, MA) having a focal length of 12 mm and an aperture of 6 mm. The depth-of-field (∼1 mm) and lateral beamwidth (∼70 μm) were measured by scanning a 12-μm-diameter tungsten wire using a pulser/receiver (Panametrics 5900, Olympus NDT, Waltham, MA). The transducer was excited by the output of a power amplifier (1040L ENI, Rochester, NY) driven by an arbitrary-waveform generator (Tabor 1281, Tel Hanan, Israel). The transducer was used for pulse and receive measurements by employing a custom transmit/receive transmit having an inline crossed-diode pair (1N4148, Fairchild Semiconductor Corp., South Portland, ME) between the power amplifier and transducer, and a crossed-diode pair to ground between the receive amplifier and transducer.21 The receive echo was digitized at 500 MHz with an 8-bit peripheral component interconnect (PCI)-based digitizer (DP110, Acqiris, Monroe, NY) after undergoing 46 dB of amplification (AU-1313, Miteq, Hauppauge, NY). The transducer was calibrated for the various exposure settings using a 40-μm hydrophone (HPM04/1, Precision Acoustics Ltd., Dorset, UK). The transducer was mounted to a motorized positioning system in order to align the transducer with the 200-μm flow channel accurately. After alignment, the transducer was displaced downstream by 1 mm.
While the −6-dB depth-of-field of the transducer (1 mm) was much larger than the 200-μm injection channel, the −6-dB lateral beamwidth of the transducer (70 μm) was smaller than the injection channel. Thus, the axial location of the agent may not necessarily coincide with the peak pressure of the sound field. However, this uncertainty exists for any experiment that uses tightly focused transducers or experiments that wait for a random UCA to pass through the transducer focal zone. We have reduced this uncertainty by carefully injecting UCAs into the transducer focal zone and increasing the acquisition rate of single-agent backscatter events. We also acquired large sets of data for each exposure condition in order to assist in identifying statistical trends.
Data acquisition
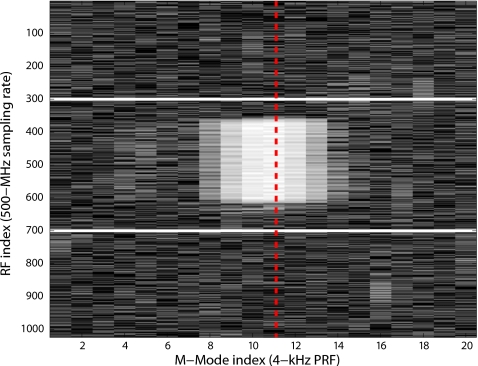
The data-acquisition system was controlled using a custom software package (LabVIEW, National Instruments, Austin, TX) and was configured to screen consecutively acquired M-mode data sets for valid backscatter events. Once the transducer was aligned with the 200-μm input channel and moved downstream, M-mode data sets of 20 lines with 1000 points/line were acquired at a pulse-repetition frequency (PRF) of 4 kHz and a sampling rate of 500 MHz. The center of the data window was placed at the focal length of the transducer. Figure 2 displays a typical 20-line M-mode data set containing a valid event. With this data-acquisition approach, each UCA was exposed to about six to eight pulses (eight pulses in case of Fig. 7). Multiple exposures per agent guaranteed capturing a backscatter event as the UCA moved through a local maximum pressure whereas a single backscatter event per agent could represent any of the eight lines in Fig. 7. However, even with multiple exposures per agent, we had no guarantee that the agent had passed directly through the peak pressure at the geometric focus.
Figure 2.
M-mode image of a valid event. The image contains 20 A-lines acquired with a PRF of 4 kHz. In this example, the excitation toneburst was a 20-cycle pulse with a peak-rarefactional pressure of 2.1 MPa. A-lines 8–14 contain echoes from the same agent. The valid event is symbolized by the dashed line. The solid lines symbolize the 400-rf points centered at the focus of the transducer.
Figure 7.
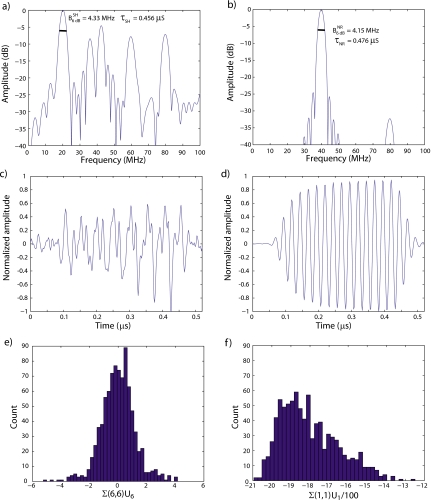
Spectra of the subharmonic (a) and normal-response (b) eigenvectors. Time waveforms of the subharmonic (c) and normal-response (d) eigenvectors. Histograms of the coefficients of the events on the subharmonic (e) and normal-response eigenvectors (f).
The M-mode data were initially scanned in real time to determine whether (1) the maximum value of the M-mode signal was above a noise threshold, (2) the maximum value was below saturation, and (3) the M-mode line with the maximum value was not the first or last M-mode line. In the example of Fig. 2, these conditions are all true and the M-mode with the maximum value (dashed line) was the 11th M-mode line. If conditions (1)–(3) were true, then the line with the maximum value was correlated with an ideal excitation waveform (i.e., number of 40-MHz cycles convolved with the transducer impulse response). If a single correlation peak occurred and that peak was within ±200 points (solid lines in Fig. 2) of the data window center (i.e., the geometric focus), then the processed M-mode line was logged, along with a time stamp, as a valid single-agent backscatter event. This screening process was repeated until 1000 valid backscatter events were acquired for an individual data run. A typical data run would yield valid events for roughly 10–20% of all M-mode acquisitions.
Experiments were performed by selecting a set of drive voltages and excitations; then all aspects of data collection and processing were automated. In order to optimize the voltage range of the digitizer as the drive voltages were incremented during experiments, the peak values of all M-modes above the noise threshold were logged along with a running tally of the total number of acquired M-mode sets. These parameters were used to determine whether the voltage range of the digitizer should be altered. If <0.5% of all acquired M-modes led to a valid backscatter event, then the voltage scale of the digitizer was reduced. If >5% of the cases with a peak above the noise threshold were saturated, then the voltage range was increased. If >95% of the cases with a peak above the noise threshold used only 7 of the available 8 bits, then the voltage range was decreased. Each time a voltage range was changed by the software, the data collection was re-initiated starting at a zero count. In addition, as the voltage range changed, the noise threshold was appropriately scaled to maintain a constant voltage threshold rather than a constant binary threshold.
Conventional and SVD subharmonic detection
In this study, two methods were investigated for detecting subharmonic events. The first method, the conventional method, decides whether each event (of a 1000-event data set) was a valid subharmonic event independent of the other events. The second method, the SVD method, does not individually select subharmonic events but processes the 1000-event data set at one time. Both subharmonic detection methods are described below.
Conventional method
Data sets were post-processed to screen for subharmonic components in the backscatter. In the conventional subharmonic detection method, the data lines were correlated with an ideal excitation waveform (S) in order to window only the backscatter component of the data. The correlation scores were recorded, and events having a correlation that was below the average correlation minus one standard deviation were discarded as outliers. This screening procedure usually led to the discard of about 10% of the events. The windowed backscatter event was then passed through a Hamming window, zero padded to 2048 points, and a power spectrum was calculated. Finally, three qualitative comparisons were employed to determine whether the spectrum contained a subharmonic component (Fig. 3).
-
(1)
The 40-MHz sub-band of the backscatter event and S were normalized to ±1, and the mean-square error (MSE) between the two curves was calculated. If the MSE was <0.1, then the fit was declared good. This check provided a simple means to determine if the duration of the backscatter event was less than the ideal excitation waveform. A shorter-duration signal would have resulted in a wider bandwidth and an increase in the MSE. A shorter-duration backscatter signal could have resulted from the destruction of the agent during the acoustic excitation or from an agent that moved out of the sound field during the exposure.
-
(2)
The 20-MHz sub-band of the backscatter event was fitted to a second-order polynomial after normalizing the sub-band to ±1. If the MSE was <0.1, then the fit was declared good. This check ensured that the 20-MHz band had structure consistent with a subharmonic signal.
-
(3)
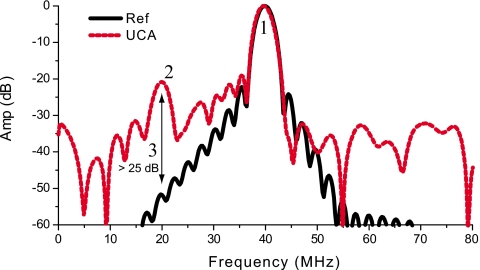
The difference in decibels between the 20-MHz peaks of S and the backscatter power spectrum was calculated after normalizing the 40-MHz components of the two signals to the same value. If the difference between the 20-MHz components was >25 dB, then the backscatter spectrum was declared to contain a subharmonic component. This check ensured that a significant 20-MHz component existed in the backscatter signal.
Figure 3.
Criteria to determine if a subharmonic was present. (1) 40-MHz sub-band was a good fit to sub-band of S, (2) 20-MHz sub-band was a good fit to a second-order polynomial, and (3) 20-MHz backscatter value was >25 dB of S peak after the 40-MHz components were normalized. The example shows a 10-cycle reference spectrum (solid) compared to a valid backscatter event (dashed).
The screening method that we employed led to some false-positives and false-negatives, but it provided a consistent and uniform approach to screening acquired data. Visual inspection of some test cases showed that this approach was fairly robust at identifying subharmonic events.
SVD method
The SVD detection approach is fundamentally different from the conventional method for two reasons. First, each 1000-event data set is processed at one time (i.e., events are not screened individually). Second, the SVD approach does not produce a yes/no answer for subharmonic presence for each individual event whereas the conventional method does.
The outliers of the 1000-event data set were discarded using the same approach as in the conventional method; then, a preprocessing step was conducted to synchronize the remaining events precisely so that their start time was at the same radio-frequency (rf) point. Synchronization was done by equaling the phases of the Fourier transforms of all events at 40 MHz. The synchronization step was necessary because otherwise the SVD processing would consider the lack of synchronization as a property of the agent response, which would be misleading for physical interpretation. Following the synchronization, the events were divided by their respective peak-envelope magnitudes. Then, a matrix, M, was constructed by filling each column with the rf data of each synchronized, normalized, and gated event. (The events were gated by correlation with S just as in the conventional method.) The resulting matrix M had a size m×n, where n was the number of rf points of each gated event and m (<1000) was the number of remaining events after discarding outliers. The SVD of M was then computed:
| (1) |
where U was of size m×m, Σ was of size m×n, and V was of size n×n. The ′ symbol refers to the matrix-transposition operation. The matrix Σ was diagonal and its non-zero elements are termed “singular values;” the singular values are real and positive. While it is not directly implied by the SVD definition of Eq. 1, singular values are assumed to be ordered by decreasing order in Σ (i.e., the top-left element of Σ is the largest). The matrix V contains the eigenvectors, and U can be considered to contain the coordinates of the events in the new basis defined by the eigenvectors divided by their corresponding singular values. Note that the eigenvectors corresponding to the largest singular values contain the most information about the complete data set in a minimum-variance sense.
Based on these observations, we interested ourselves in two eigenvectors: the “normal-response” and “subharmonic-response.” The normal-response eigenvector, V1, can be physically interpreted as the normal-response of the agent and it contained the most information about the complete data set. The subharmonic-response eigenvector is hypothesized to contain the most information about the subharmonic events in the data set. To find this eigenvector, the spectrum of each eigenvector was computed and the first eigenvector (i.e., corresponding to the largest singular value) whose spectrum peaked between 19.5 and 20.5 MHz was selected as the most significant eigenvector to describe the subharmonic response of the UCAs within this specific data set. This eigenvector (Vl) was termed the “subharmonic-response eigenvector,” and its index was denoted by l (l>1).
Subharmonic scores
From each data set of 1000 events and for both subharmonic detection methods, a subharmonic score (SHS), indicative of “how much” subharmonic occurrences were present, was computed. SHSC, the SHS computed using the conventional method, was defined to be the percentage (between 0 and 100) of events detected as valid subharmonic events. SHSSVD, the SHS computed using the SVD method, was defined as the peak amplitude of the spectrum of the subharmonic-response eigenvector multiplied by the mean of the absolute value of the scaling coefficient of each event on the subharmonic-response eigenvector. Visually,
| (2) |
where Σ(l,l) is the lth diagonal element of Σ, FT is the Fourier transform operator, the overbar represents the ensemble mean, and Vl and Ul are the lth columns of matrices V and U, respectively. Vl is the subharmonic response of the data set and Ul is the coefficient of each event on the subharmonic response. Therefore, from Eq. 2, SHSSVD represents the mean “energy” of the entire data set in the specific subharmonic band defined only by the subharmonic response. During preprocessing, the events are normalized to unit amplitude and because Vl is part of the orthonormal basis deduced by SVD, all the terms in Eq. 2 are unitless making SHSSVD unitless. (SHSC is also unitless because it is defined as a percentage.)
Empirical simulations
Ideally, the rationale behind the computations of SHSC and SHSSVD is to give physical understanding to the more intricate SVD processing. In particular, the following empirical simulations should help with the physical interpretation of the subharmonic- and normal-response eigenvectors. The conventional method is easier to understand because each event is classified independent of the others, and the selection criteria all have physical meaning, whereas in the SVD method, the entire data set is processed at once and Eqs. 1, 2 are more difficult to physically interpret. Therefore, we designed simulations to investigate whether SHSC and SHSSVD could be linearly related, i.e., the expression SHCSVD≈aSHSC+b valid for some constants a and b.
For these simulations, and for each exposure condition (i.e., time-duration and peak-rarefactional pressure), we built two libraries of events. One library contained only subharmonic events detected by the conventional method and the other contained no subharmonic events. Then, for each value of SHSC, we built a 1000-event data set by randomly selecting events of both libraries to reach the prescribed value for SHSC. Then, the SVD method was conducted on the simulated 1000-event data set and SHSSVD was computed. For each prescribed value of SHSC, 20 data sets with 1000 events were simulated to compute mean and standard deviations of SHSSVD. Afterward, SHSSVD values were obtained for SHSC values ranging from 1 to 25 with 0.5 increments, and a least-squares straight-line fit was computed.
Time-durations and subharmonic delay
Several quantities were estimated based on the normal-response and subharmonic-response eigenvectors. These quantities were hypothesized to be related to the physical nature of subharmonic emissions occurring when UCAs are under HFU insonification. The rationale here was to exploit the results of the SVD processing and to understand how a single UCA behaves in a HFU field.
The first two quantities are the time-duration of the normal (τNR) and subharmonic (τSH) responses. They were estimated using the following equations:
| (3) |
| (4) |
where (40 MHz) and (20 MHz) are the −6-dB bandwidths of the Fourier transform of the normal-response (i.e., column vector V1) and subharmonic-response (i.e., column vector Vl) eigenvectors centered at 40 and 20 MHz, respectively. The constant α was equal to 1.976 and was found by multiplying the actual known duration of a Hanning-weighted tone-burst by its −6-dB bandwidth. (Based on this estimation method, α is independent of frequency.) We used Eqs. 3, 4 to estimate time-durations instead of a more straightforward time-domain-based method because the noise level in the subharmonic-response eigenvector always was much greater than the level in the normal-response eigenvector.
The next quantity estimated was the subharmonic delay, dSH. The subharmonic delay was meant to quantify whether a delay existed between the initiation of the subharmonic response and the normal response. It was estimated as the difference between the time stamps at which the envelope of filtered versions of the subharmonic- and the normal-response eigenvector envelopes reached 75% of their maximal value the first time. The filters were pass-band with identical design except for the pass-band center frequencies of 40 and 20 MHz for the normal and subharmonic responses, respectively. The use of linear filters was necessary because of the significant noise in the subharmonic-response eigenvector.
The final quantity estimated was the time-duration difference, Δ=τNR−τSH. It was computed to determine whether the subharmonic response was shorter or longer than the normal response. Also, Δ could be compared to dSH to indicate whether the time-duration difference could be associated with a delay in subharmonic response.
RESULTS
Transducer characterization
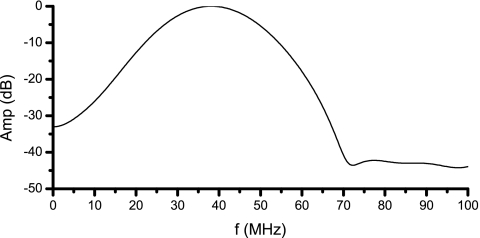
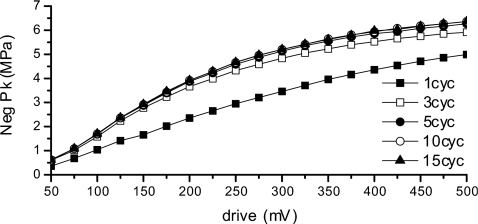
The transmit/receive frequency response of the transducer for an impulse excitation (Panametrics 5900, Olympus, Waltham, MA) is shown in Fig. 4. Echo-signal data were acquired from the surface of a quartz plate positioned normal to and in the focal plane of the transducer. The peak sensitivity of the transducer was at 40 MHz and the 20-MHz sensitivity was 12 dB lower. The peak negative pressures at the transducer geometric focus versus drive voltage for a series of tone-bursts are shown in Fig. 5. The pressure showed an initial linear increase with drive signal, but it tended to plateau at high drive voltages. As the number of cycles increased from 1 to 5 cycles, the peak pressure increased slightly for a fixed drive signal. For tone-bursts beyond 5 cycles, the peak pressure remained constant for a fixed drive signal.
Figure 4.
Glass-plate pulse/echo spectrum. The 20-MHz sensitivity is 12 dB below the peak sensitivity at 40 MHz.
Figure 5.
Peak negative pressures as a function of drive voltage for 1–15-cycle pulse durations.
Illustrative results
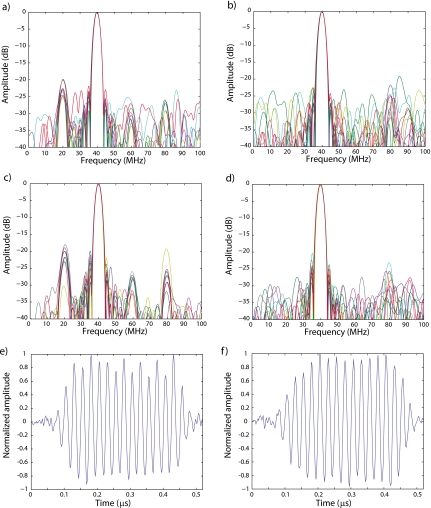
In this section, the results obtained using the conventional and SVD methods on an illustrative 1000-event data set are presented. In this illustrative data set, UCAs were excited with 15-cycle tone-bursts with a peak-rarefactional pressure of 2.1 MPa. The conventional subharmonic detection method yielded SHSC=4.23 (i.e., 4.23%, or 37 out of 874 events; 126 events were discarded as outliers). Figure 6a displays the spectra of ten randomly-selected subharmonic events detected by the conventional method. For comparison, Fig. 6b displays the spectra of ten non-subharmonic events. Comparing these two figures, the spectra of Fig. 6a clearly have significant spectral energy near 20 MHz while the spectra of Fig. 6b clearly do not. Furthermore, Fig. 6a also gives a hint of ultra-harmonic energy near 60 MHz.
Figure 6.
Illustration of the conventional and SVD methods applied to a 1000-event data set acquired with 15-cycle tone-bursts with a peak-rarefactional pressure of 2.1 MPa. Spectra of ten randomly-selected subharmonic events (a) and non-subharmonic events (b) based on the conventional method. Spectra of the ten most (c) and ten least (d) subharmonic events based on the SVD method. Time signals of the most (e) and least (f) subharmonic events based on the SVD method.
The same data set then was processed using the SVD method, which yielded SHSSVD=5.95. The subharmonic-response eigenvector was V6 (i.e., l=6). Figure 6c displays the spectra of the ten events with the largest coefficients on V6 in absolute value. These events correspond to the ten greatest elements of ∣U6∣. Therefore, based on our interpretation of the SVD-method results, these ten events are the “most subharmonic.” For comparison, Fig. 6d displays the spectra of the ten events with the smallest coefficients on V6; therefore, these events can be interpreted as being the “least subharmonic” and correspond to the ten smallest elements of ∣U6∣. The spectra shown in Figs. 6c, 6d share similarities with those shown in Figs. 6a, 6b, but some differences also are apparent. The ultra-harmonic energy at 60 MHz, which was arguably hinted at in Fig. 6a, is clearly visible in Fig. 6c. Also, a second-harmonic frequency component at 80 MHz is visible. Figure 6d shows essentially the same spectral content as Fig. 6b; the difference is in the level of the noise plateau. A simple estimation concluded that the average signal-to-noise ratio (SNR) of the spectra of Fig. 6d was about 9 dB greater than the average SNR of the spectra of Fig. 6b. Overall, these small differences start to illustrate the strength of the SVD method over the conventional method. With the SVD method, we were able to separate the “most” and “least” subharmonic events easily. The conventional method did not provide any means of doing that accurately.
Figures 6e, 6f display the normalized time waveforms of the most- and least-subharmonic events of the data set based on the results provided by the SVD method. The subharmonic content of the waveform in Fig. 6e is visible after 0.25 μs where the peak positive amplitudes periodically alternate between about 0.7 and 0.9. The waveform in Fig. 6f does not show the variation in peak amplitudes.
Figure 7 provides a deeper insight into the SVD method and also further illustrates its strength over the conventional method. Figures 7a, 7b display the spectra of the subharmonic-response eigenvector (i.e., V6) and of the normal-response eigenvector (i.e., V1), respectively. These figures illustrate how τSH and τNR were estimated from Eqs. 3, 4. In this case, the estimation results yielded a slightly longer time-duration for the normal response, specifically, τNR=0.476 μs and τSH=0.456 μs (and Δ=20.1 ns). These spectra demonstrated that the normal-response frequency content was strongly concentrated near 40 MHz. The normal-response spectrum also displayed a weak second-harmonic component centered at 80 MHz with a relative amplitude of −32 dB. The spectrum of V6 was more structured with a strong component near 20 MHz, but with energy in the harmonics of 20 MHz (i.e., 40, 60, and 80 MHz with relative amplitudes of −5, −8, and −7 dB, respectively). This type of spectrum is typical of a finite-duration signal that is nearly periodic with a period of 50 ns (i.e., 1/20 MHz). In addition, the spectra revealed that the SNRs of V1 and V6 were very different. The normal-response SNR was at least 40 dB, whereas a crude SNR estimate for the subharmonic response would be 28 dB based on the spectra between 90 and 100 MHz.
Figures 7c, 7d display the time signals of V6 and V1, respectively. V6 appears noisy but arguably periodic. For example, the last four negative peaks (first one at 0.28 μs) and the last five positive peaks (first one at 0.25 μs) were evenly spaced by 50 ns from each other. The positive peaks have almost-equal amplitudes near 0.55 whereas the negative-peak amplitudes increased from −0.52 to −1.0 (which explains the spectral components at 40, 60, and 80 MHz). Figure 7c also illustrates why τSH was estimated in the spectral domain and not in the time domain. Figure 7d shows a noiseless signal, very similar to what would be expected in a linear regime from a glass-plate reflection when the transducer is excited by a 15-cycle tone-burst. The modest non-linear content of this waveform is visible in the slightly asymmetric first cycles of the waveform.
Finally, Figs. 7e, 7f display the histograms of Σ(6,6)U6 and Σ(1,1)U1, respectively. The distribution of Σ(6,6)U6 was very narrow and centered around 0. The actual mean value was virtually 0 (i.e., ≈−3.5×10⁻³) and the standard deviation was 1.18. Furthermore, 88% of the elements were between −1.18 and 1.18. This distribution indicates that most of the bubble events had a small subharmonic content. An interesting observation was that events can contain either a positive or negative subharmonic component; this property is physically interesting and is discussed further in Sec. 3E. The distribution of Σ(1,1)U1 was fundamentally different; its mean value was −1.80×10³ and its standard deviation was 150 and all the values had the same sign. Therefore, each event had a strong component on V1 which was expected because it was the first eigenvector returned by the SVD processing. Also, eigenvectors have unit norm; therefore, a coefficient of −1.80×10³ on V1 is effectively 340 times greater than a coefficient of −5.3 [i.e., the smallest values of Σ(6,6)U6] in V6. This difference corresponded to the subharmonic component being about 25 dB below the fundamental component for the most subharmonic events of the data set. This value was consistent with the spectra in Fig. 6c.
Another element of information given by the SVD method is dSH. For this specific example, dSH=48 ns, suggesting that the subharmonic response initiated itself about 48 ns after the normal response. Interestingly, 48 ns was about 1 cycle at 20 MHz or 2 cycles at 40 MHz. Also, results led to Δ=20.1 ns, suggesting that the subharmonic response outlasted the normal response by about 27.9 ns (i.e., about 1 cycle at 40 MHz).
Empirical-simulation results
In this section, the relationship between SHSC and SHSSVD is investigated. The conventional method is fairly intuitive to understand and SHSC is physically interpretable as the probability of a subharmonic event under certain excitation conditions. Therefore, using empirical simulations, we investigated whether SHSSVD and SHSC can be related in a straightforward fashion.
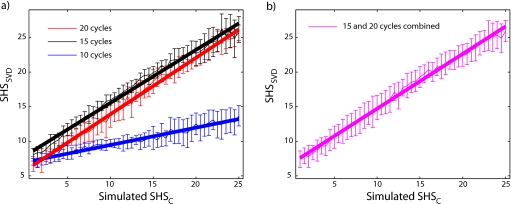
Figure 8a displays the results of the empirical simulations for prescribed SHSC values ranging from 1 to 25 by 0.5 increments. For each duration, the data-point is the mean of 20 simulations and error bars represent standard deviations. Solid lines symbolize the optimal least-squares fit by a straight line to the data, and Table 1 provides optimal fit parameters. For all three pulse durations, SHSSVD increased with SHSC. This is a strong indication that SHSSVD is a reliable means of quantifying subharmonic likelihood and content within a 1000-event data set. Furthermore, the MSEs quoted in Table 1 indicate that straight-line fits were able to track data accurately for the three different pulse durations.
Figure 8.
Empirical-simulation results: (a) SHSSVD as a function of simulated SHSC for 10-, 15-, and 20-cycle excitations. Each data-point is the mean of 20 simulations, and error bars represent standard deviations. (b) SHSSVD as a function of simulated SHSC for combined 15- and 20-cycle excitations. Each data-point is the mean of 40 simulations (20 with 15-cycle excitation and 20 with 20-cycle excitation). Bold lines represent least-squares straight-line fits to the results.
Table 1.
Straight-line least-squares-fit parameters for empirical simulations. (The numbers in Table 1 are unitless.)
| Duration cycles | Slope | Intercept | Mean-squared error |
|---|---|---|---|
| 10 | 0.250 | 6.96 | 1.67 |
| 15 | 0.767 | 7.87 | 2.14 |
| 20 | 0.817 | 5.73 | 2.13 |
| 15 and 20 | 0.792 | 6.80 | 2.72 |
The results obtained for 15- and 20-cycle excitations were fairly similar: the values for SHSSVD greatly overlap, and the optimal least-squares-fit parameters were nearly identical (Table 1). These results suggest that for 15- and 20-cycle excitations, SHSSVD could be reliably inverted to estimate SHSC with the same formula. Figure 8b displays the empirical-simulation results and optimal straight-line fit when simulation results for 15 and 20 cycles were combined. Again, Fig. 8b and the last row of Table 1 suggest that SHSSVD can be modeled accurately as an affine function of SHSC. Nevertheless, the MSE value for the 15- and 20-cycle combined cases was about 30% greater than the MSE value for each pulse-duration alone.
The 10-cycle results were different than the 15- and 20-cycle results. SHSSVD only increased from about 7 to 13 when SHSC was varied from 1 to 25. This slight increase of 6 is about double the average standard deviation. Also, the slope of the optimal least-squares fit was only 0.250 and much smaller than that of the 15- and 20-cycle pulse durations (Table 1). These results might suggest that only modest subharmonic activity exists for 10-cycle excitations.
Overall, the empirical-simulation results allowed us to conclude that SHSSVD was a valid quantifier of subharmonic activity because its trend was the same as that of SHSC. Furthermore, straight-line fits provided very good fit to the data for the three pulse durations. However, the results also indicated that a different formula should be used for a 10-cycle excitation than for 15- and 20-cycle excitations to predict SHSC based on values obtained from SHSSVD.
Pressure threshold
The next step of the study was to determine the optimal exposure conditions to obtain subharmonic events and whether both methods provide essentially the same answer. Knowledge of these conditions will be critical for in vivo studies because UCA echoes could be separated from tissue echoes easily by using a band-pass filter centered in the subharmonic band.
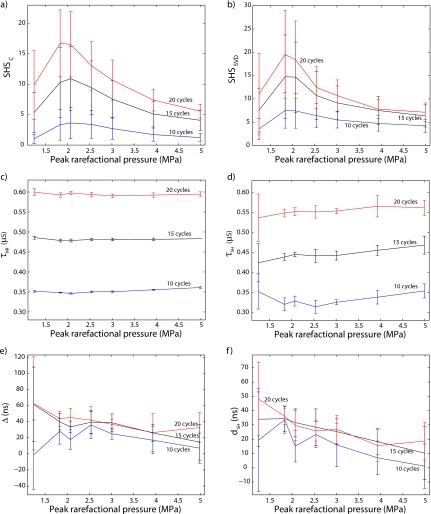
Figures 9a, 9b display SHSC and SHSSVD as a function of peak-rarefactional pressure for 10-, 15-, and 20-cycle tone-bursts. Each exposure condition experiment was repeated 11 times (except 9 times for 3.9 and 5 MPa); data-points represent means and error bars symbolize standard deviations. Figure 9a indicates that SHSC increased with pulse duration independent of the peak-rarefactional pressure. Further, for all pulse durations, the trend of the curves was the same: SHSC was low at low (<1.5 MPa) and high (>3 MPa) pressures and reached its maximum near 2 MPa. Overall, SHSC remained small, with a peak value of 17 for 20-cycle tone-bursts with 1.9 MPa. In particular, 10-cycle tone-bursts produced no mean value of SHSC greater than 3.5 whereas 15- and 20-cycle tone-bursts produced no mean value of SHSC smaller than 5. Also, 8- and 9-cycle results (not shown) always led to SHSC values smaller than 1.5. All these results tend to indicate that a 10-cycle pulse duration was the “turn-on” point for significant subharmonic generation which is consistent with the empirical-simulation results (Fig. 8). Finally, Fig. 9a illustrates the inherent randomness of the results because of the large standard deviations. The data were collected from the same vial of contrast agents on four different days over 4 months and results showed the same trends every day. (We did not report the results obtained between 0.7 and 1.2 MPa peak-rarefactional pressure because no subharmonic activity was seen for any exposure conditions.)
Figure 9.
Conventional- and SVD-method results. In all the panels, data-points are the means and error bars represent standard deviations. Results are presented as a function of peak-rarefactional pressure for 10-, 15-, and 20-cycle excitations. (a) SHSC and (b) SHSSVD. (c) τNR and (d) τSH. (e) Δ and (f) dSH.
The results presented in Fig. 9b were very similar to those of Fig. 9a. SHSSVD increased with pulse duration at all pressures, peaked near 2 MPa for all pulse durations, and large standard deviations were observed. Overall, Figs. 9a, 9b add to the argument that the SVD method provides reliable results because SVD results show the same trends as the conventional method.
Figures 9c, 9d display estimates of τNR and τSH as a function of pressure and pulse duration, respectively. Estimates of τNR showed no variation as a function of pressure, but naturally increased with pulse duration and the standard deviation of the estimates remained small (<8 ns). The situation was slightly different for the estimates of τSH. With the exception of the unreliable estimates at 1.1 MPa (i.e., large standard deviations) and of the estimates at 2.1 MPa where SHSSVD reached its maximum, estimates of τSH indicated a small trend of increase with peak-rarefactional pressure. Standard deviations were larger than that of τNR. Finally, comparing Figs. 9c, 9d indicates that overall τNR>τSH, i.e., the normal response lasts longer than the subharmonic response.
To quantify this observation more carefully, Fig. 9e displays estimates of Δ=τNR−τSH as a function of pressure and pulse duration. Estimates of Δ were overall positive (because τNR>τSH) and showed a decreasing trend with increasing peak-rarefactional pressure (because estimates of τSH showed an increasing trend). However, estimates of Δ provided new information: estimates of Δ did not vary significantly with pulse duration and numerical values decreased from about 45 ns at 1.8 MPa to about 20 ns at 5 MPa (estimates at 1.1 MPa appear to be unreliable). Physically, this decreasing trend indicated that as pressure increases, the subharmonic-response time-duration becomes closer to the normal-response time-duration (independent of the pulse duration of the excitation).
Finally, Fig. 9f displays estimates of dSH. These estimates showed a decreasing trend with increasing peak-rarefactional pressure. In addition, there was arguably no dependence on pulse duration. Physically, this behavior means that as peak-rarefactional pressure increases, the subharmonic response initiates itself quicker after the normal response initiates itself (independent of the pulse duration of the excitation).
Positive and negative subharmonic responses
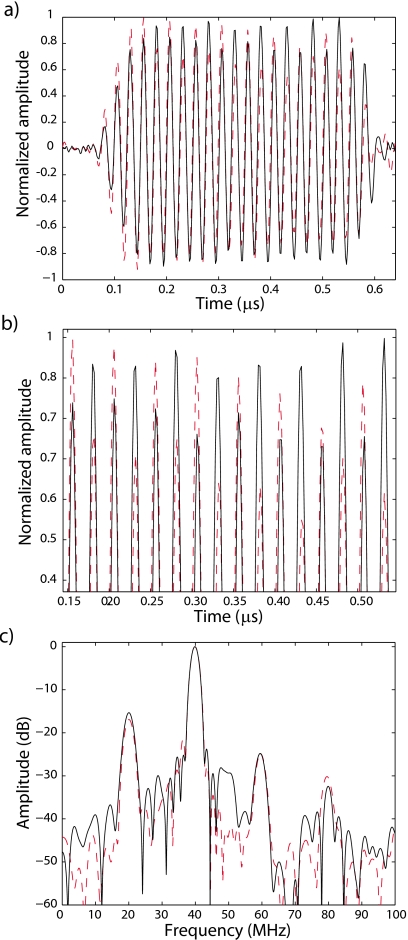
Figures 7e, 7f indicate that for the presented example, the coefficients of the decomposition on the normal-response eigenvector always have the same sign while those on the subharmonic-response eigenvector could be positive or negative. Figure 10 displays two recorded events of a data set obtained with a 20-cycle excitation at 2.1-MPa peak-rarefactional pressure. The waveforms were normalized for easier comparison. The dashed curve corresponds to the “most-positive” (i.e., largest positive coefficient on the subharmonic response) and the solid curve to the “most-negative” (i.e., largest negative coefficient on the subharmonic response) subharmonic events of the data set. Figure 10a indicates that the two events had similar waveforms and were well synchronized with positive peaks, negative peaks, and zero-crossings occurring at nearly the same time points. Furthermore, the amplitudes of the positive peaks were periodic for both waveforms, indicating, as in Fig. 6e, a strong subharmonic content. Nevertheless, a striking difference was apparent in the positive-peak amplitudes of the two waveforms: they seemed to alternate with the dashed curve peaking when the solid curve was at its lowest, as can be better observed in Fig. 10b. Figure 10b clearly indicates that the peak amplitudes were achieved alternatively by the most-positive and most-negative subharmonic events. Although differences between the two events could be observed in the time domain, only small differences were apparent in the frequency domain [Fig. 10c]. The spectra of both events had strong components at 40 and 20 MHz and some energy at 60 and 80 MHz. The only difference was the presence of a small component at 50 MHz for the most-negative subharmonic event, but not for the most-positive subharmonic event.
Figure 10.
Illustration of positive and negative subharmonic events. (a) Time waveform of the most-positive (dash) and most-negative (solid) subharmonic events of a 1000-event data set obtained with 20-cycle excitation and a peak-rarefactional pressure of 2.1 MPa. (b) Magnified version of (a). (c) Spectra of the most-positive (dash) and most-negative (solid) subharmonic events.
Figure 10 again emphasizes the strength of the SVD method over the conventional method. Based on the conventional-method criteria of Sec. 2E1, both waveforms would be detected by the conventional method as valid subharmonic events. However, only the SVD method gives us the information necessary to track positive and negative subharmonic events.
DISCUSSION AND CONCLUSION
This study investigated a SVD method of analyzing large data sets of single-bubble-backscatter events in order to draw physical insights about bubbles in HFU fields and to provide an approach to detecting and quantifying subharmonic events. The SVD method was compared to a conventional method that utilized individual-event spectra. The conventional method was easier to interpret from a physical standpoint and was used as a baseline reference to evaluate the effectiveness of the SVD method. The experimental [Figs. 9a, 9b] and empirical-simulation [Figs. 8a, 8b] results confirmed that the SVD method had performance similar to the conventional method. The SVD method also provided information about the bubble oscillation properties that were not available with the conventional method. For example, the SVD method showed that the subharmonic response of the bubble initiated itself after, and had a shorter time-duration, than the normal response.
The SVD method also provided means of finding the events with the most- and least-subharmonic contents. The conventional subharmonic detection method only provided a yes/no qualitative evaluation and therefore did not provide a means to quantify how much an event was subharmonic. The SVD approach was fundamentally quantitative because it yielded the coefficient of each event on the subharmonic-response eigenvector. For physicists studying bubble oscillations in a HFU field, quantifying the subharmonic events is invaluable. Therefore, the results of this study indicated that the SVD method is a valid and useful tool to study and quantify single-bubble oscillations.
The focus of this study was on the development and the validation of the SVD method. Physical interpretation of the results, to date, is limited and is under current investigation. In particular, we are designing simulations using previous models.15 The simulations will be conducted to generate 1000-event data sets by varying simulation parameters following experimentally-derived distributions of experimental parameters such as UCA size, incident pressure, and other UCA properties. Size distributions can be obtained from measurements, and pressure distributions can be obtained by estimating the distance of the UCA from the focus of the transducer. In particular, we hope to determine optimal excitation conditions for generating strong subharmonic events and then evaluating these conditions experimentally using the SVD method. If the simulations were able to match the experimental results, then exposure conditions could be further optimized for subharmonic generation. Also, finding only positive subharmonic events based on the SVD processing of the simulations could indicate that the bubble oscillations were not spherical and, thus, a model that assumed spherical oscillation would not be appropriate.
The shell of the UCAs used in this study was stiffer than that of lipid-shelled agents (e.g., Definity®) for which subharmonic events have been reported for much lower pressures and larger bandwidths (i.e., shorter excitation durations).8, 9 Stiffer-shell UCAs typically require higher pressures and longer time-duration exposures to break. The observations of subharmonics at higher pressures and exposure durations that we observed for polymer-shelled agents are consistent with the hypothesis that the polymer-shelled agents need to break before generating subharmonics. It is not clear whether the SVD approach would work as well for lipid-shelled UCAs when they are excited with broadband emissions (e.g., time-durations shorter than 10 cycles). Theoretically, the SVD approach will be able to accurately separate the normal and subharmonic responses of the UCAs as long as they correspond to different singular values.
One of our interests is to evaluate the SVD method when the UCAs are insonified at pressures high enough to lead to inertial cavitation and the resulting broadband backscatter emissions. The conventional method or a band-pass filtering method would be unable to differentiate the subharmonic signal from the part of the broadband emission in the subharmonic band. However, we anticipate that the SVD method could potentially outperform the conventional method because the nature of the subharmonic signal in the time and frequency domains is fundamentally different from the broadband noise. Therefore, the broadband emission and noise should correspond to different singular values and eigenvectors of the SVD and be easily separable. Even in this more challenging situation, the normal-response and subharmonic-response eigenvectors would be correctly separated. Furthermore, the SVD is statistically more robust because it uses the complete 1000-event data set to derive the eigenvectors used for characterization.
Similarly, we are investigating how a band-pass filtering approach would perform compared to the SVD method to estimate τNR, τSH, dSH, and Δ. For this task, we also anticipate the SVD method to perform better because it should be able to differentiate actual subharmonic emissions from noise and other contributors to the subharmonic band. A band-pass filter approach would use the entire energy in the subharmonic band to estimate time-durations and time delays which would result in errors. Also, the SVD method should be more robust because the SVD eigenvectors used for the estimation of τNR, τSH, dSH, and Δ are deduced from the 1000-event data set automatically. Many parameters would need to be carefully adjusted to design a satisfactory band-pass filter, and each set of parameters would lead to different and somewhat arbitrary estimates of τNR, τSH, dSH, and Δ.
The next stages of this study will focus on better monitoring of valid events. We propose to accomplish this by combining acoustical and optical methods. The acoustical method will utilize a passive-cavitation detector (PCD) very similar to that of a previous study22 except that the passive transducer will have a center frequency approximately half that of the exciting transducer. The PCD will provide better selectivity to valid events by guaranteeing in real time that both transducers receive valid signals. Furthermore, better sensitivity in subharmonic detection should be achieved because the receiving transducer will be more sensitive in the subharmonic band. The optical method will use a high-magnification digital camera triggered at the same PRF as the exciting transducer. The focal plane of the camera will be aligned with the focal region of the transducer. The camera will provide a real-time means of estimating the size of UCAs. Therefore, we anticipate that we will be able to link bubble size and subharmonic content and to answer important questions about which sizes are most likely to produce strong subharmonic events.
One of the potential clinical applications of UCAs at high frequencies is imaging of circulation in small veins and arteries (i.e., microcirculation imaging) for ophthalmologic and small-animal applications. SVD studies could determine optimal conditions to excite a non-linear response from UCAs. Then, SVD-based detection methods could permit a more-powerful approach to localizing UCAs and imaging flow when UCAs are nonlinearly excited. Microcirculation typically involves slow-moving, low-volume blood flow and is difficult to detect with current Doppler and HFU instrumentation.
In the eye, conventional ultrasonic instrumentation operating at or below 10 MHz is able to visualize and measure flow in the major orbital vessels supplying the eye,23, 24, 25 but such systems are unable to detect microcirculatory flow in the anterior or posterior segments of the eye. UCA-SVD imaging could prove to be a valuable fine-resolution means to detect this microcirculation using HFU. In developmental biology, the study of vascular development is critical for normal embryonic maturation and currently is the focus of numerous research efforts using a variety of genetically-engineered mouse models. Genetic mechanisms that have gone awry are involved in a number of vascular pathologies, including tumor angiogenesis, so that understanding embryonic vascular development has a broad range of important clinical implications. Direct in vivo visualization of the developing embryonic vascular system is an attractive option for analyzing the complex three-dimensional patterns of vessel growth and patterning in normal mouse embryos and in mice with mutations in genes that affect vascular development. We anticipate that UCAs combined with SVD-based detection methods would be extremely valuable for studying vascular-system development in mouse embryos, potentially in three dimensions.
ACKNOWLEDGMENTS
This research was supported in part by NIH Grant No. EB006372 and the Riverside Research Institute Fund for Biomedical Engineering Research. The authors wish to thank POINT Biomedical and T. Ottoboni for making available the polymer-shelled agents used in these studies. The authors thank S. Ramachandran for her assistance in data collection and Dr. E. J. Feleppa for his help in preparing the manuscript.
References
- Deng C. X. and Lizzi F. L., “A review of physical phenomena associated with ultrasonic contrast agents and illustrative clinical applications,” Ultrasound Med. Biol. 28, 277–286 (2002). 10.1016/S0301-5629(02)00475-1 [DOI] [PubMed] [Google Scholar]
- Lyshchik A., Fleischer A. C., Huamani J., Hallahan D. E., Brissova M., and Gore J. C., “Molecular imaging of vascular endothelial growth factor receptor 2 expression using targeted contrast-enhanced high-frequency ultrasonography,” J. Ultrasound Med. 26, 1575–1586 (2007). [DOI] [PMC free article] [PubMed] [Google Scholar]
- Willmann J. K., Paulmurugan R., Chen K., Gheysens O., Rodriguez-Porcel M., Lutz A. M., Chen I. Y., Chen X., and Gambhir S. S., “US imaging of tumor angiogenesis with microbubbles targeted to vascular endothelial growth factor receptor type 2 in mice,” Radiology 246, 508–518 (2008). 10.1148/radiol.2462070536 [DOI] [PMC free article] [PubMed] [Google Scholar]
- Deng C. X., Lizzi F. L., Silverman R. H., Ursea R., and Coleman D. J., “Imaging and spectrum analysis of contrast agents in the in vivo rabbit eye using very-high-frequency ultrasound,” Ultrasound Med. Biol. 24, 383–394 (1998). 10.1016/S0301-5629(97)00288-3 [DOI] [PubMed] [Google Scholar]
- Turnbull D. H. and Foster F. S., “Ultrasound biomicroscopy in developmental biology,” Trends Biotechnol. 20, S29–S33 (2002). 10.1016/S0167-7799(02)02003-6 [DOI] [Google Scholar]
- Morgan K., Dayton P., Klibanov A., Brandenburger G., Kaul S., Wei K., and Ferrara K., “Properties of contrast agents insonified at frequencies above 10 MHz,” Proc.-IEEE Ultrason. Symp. 2, 1127–1130 (1996). [Google Scholar]
- Moran P. M., Al-Uzri M. M., Watson J., and Reveley M. A., “Reduced kamin blocking in non paranoid schizophrenia: Associations with schizotypy,” J. Psychiatr. Res. 37, 155–163 (2003). 10.1016/S0022-3956(02)00099-7 [DOI] [PubMed] [Google Scholar]
- Goertz D. E., Cherin E., Needles A., Karshafian R., Brown A. S., Burns P. N., and Foster F. S., “High frequency nonlinear B-scan imaging of microbubble contrast agents,” IEEE Trans. Ultrason. Ferroelectr. Freq. Control 52, 65–79 (2005). 10.1109/TUFFC.2005.1397351 [DOI] [PubMed] [Google Scholar]
- Goertz D. E., Needles A., Burns P. N., and Foster F. S., “High-frequency, nonlinear flow imaging of microbubble contrast agents,” IEEE Trans. Ultrason. Ferroelectr. Freq. Control 52, 495–502 (2005). 10.1109/TUFFC.2005.1417273 [DOI] [PubMed] [Google Scholar]
- Goertz D. E., Frijlink M. E., de Jong N., and van der Steen A. F., “High frequency non-linear scattering from a micrometer to submicrometer sized lipid encapsulated contrast agent,” Ultrasound Med. Biol. 32, 569–577 (2006). 10.1016/j.ultrasmedbio.2006.01.002 [DOI] [PubMed] [Google Scholar]
- Goertz D. E., Frijlink M. E., de Jong N., and van der Steen A. F., “Nonlinear intravascular ultrasound contrast imaging,” Ultrasound Med. Biol. 32, 491–502 (2006). 10.1016/j.ultrasmedbio.2006.01.001 [DOI] [PubMed] [Google Scholar]
- Allen J. S., Kruse D. E., and Ferrara K. W., “Shell waves and acoustic scattering from ultrasound contrast agents,” IEEE Trans. Ultrason. Ferroelectr. Freq. Control 48, 409–418 (2001). 10.1109/58.911723 [DOI] [PubMed] [Google Scholar]
- Goertz D. E., Frijlink M. E., Tempel D., Bhagwandas V., Gisolf A., Krams R., de Jong N., and van der Steen A. F., “Subharmonic contrast intravascular ultrasound for vasa vasorum imaging,” Ultrasound Med. Biol. 33, 1859–1872 (2007). 10.1016/j.ultrasmedbio.2007.05.023 [DOI] [PubMed] [Google Scholar]
- Needles A., Goertz D. E., Karshafian R., Cherin E., Brown A. S., Burns P. N., and Foster F. S., “High-frequency subharmonic pulsed-wave Doppler and color flow imaging of microbubble contrast agents,” Ultrasound Med. Biol. 34, 1139–1151 (2008). 10.1016/j.ultrasmedbio.2007.12.011 [DOI] [PubMed] [Google Scholar]
- Ketterling J. A., Mamou J., Allen J. S., Aristizábal O., Williamson R. G., and Turnbull D. H., “Excitation of polymer-shelled contrast agents with high-frequency ultrasound,” J. Acoust. Soc. Am. 121, EL48–EL53 (2007). 10.1121/1.2401270 [DOI] [PMC free article] [PubMed] [Google Scholar]
- Patel D., Dayton P., Gut J., Wisner E., and Ferrara K. W., “Optical and acoustical interrogation of submicron contrast agents,” IEEE Trans. Ultrason. Ferroelectr. Freq. Control 49, 1641–1651 (2002). 10.1109/TUFFC.2002.1159844 [DOI] [PubMed] [Google Scholar]
- Patel D. N., Bloch S. H., Dayton P. A., and Ferrara K. W., “Acoustic signatures of submicron contrast agents,” IEEE Trans. Ultrason. Ferroelectr. Freq. Control 51, 293–301 (2004). 10.1109/TUFFC.2004.1320785 [DOI] [PubMed] [Google Scholar]
- Gentle J. E., Numerical Linear Algebra for Applications in Statistics, Statistics and computing (Springer, New York, 1998). [Google Scholar]
- Di Pietro Paolo D., Muller H. P., Nolte G., and Erne S. N., “Noise reduction in magnetocardiography by singular value decomposition and independent component analysis,” Med. Biol. Eng. Comput. 44, 489–499 (2006). 10.1007/s11517-006-0055-z [DOI] [PubMed] [Google Scholar]
- Van Baren P. and Ebbini E. S., “Multipoint temperature control during hyperthermia treatments: Theory and simulation,” IEEE Trans. Biomed. Eng. 42, 818–827 (1995). 10.1109/10.398643 [DOI] [PubMed] [Google Scholar]
- Lockwood G. R., Hunt J. W., and Foster F. S., “The design of protection circuitry for high-frequency ultrasound imaging systems,” IEEE Trans. Ultrason. Ferroelectr. Freq. Control 38, 48–55 (1991). 10.1109/58.67834 [DOI] [PubMed] [Google Scholar]
- Ammi A. Y., Cleveland R. O., Mamou J., Wang G. I., Bridal S. L., and O’Brien W. D., “Ultrasonic contrast agent shell rupture detected by inertial cavitation and rebound signals,” IEEE Trans. Ultrason. Ferroelectr. Freq. Control 53, 126–136 (2006). 10.1109/TUFFC.2006.1588398 [DOI] [PMC free article] [PubMed] [Google Scholar]
- Greenfield D. S., Heggerick P. A., and Hedges T. R., “Color Doppler imaging of normal orbital vasculature,” Ophthalmology 102, 1598–605 (1995). [DOI] [PubMed] [Google Scholar]
- Lieb W. E., “Color Doppler imaging of the eye and orbit,” Radiol. Clin. North Am. 36, 1059–1071 (1998). 10.1016/S0033-8389(05)70231-1 [DOI] [PubMed] [Google Scholar]
- Tanquart F., Berges O., Koskas P., Arsene S., Rossazza C., Pisella P., and Pourcelot L., “Color Doppler imaging of orbital vessels: Personal experience and literature review,” J. Clin. Ultrasound 31, 258–273 (2003). 10.1002/jcu.10169 [DOI] [PubMed] [Google Scholar]


