Abstract
Tg2576 mice produce high levels of beta-amyloid (Aβ) and develop amyloid deposits, but lack neurofibrillary tangles and do not suffer the extensive neuronal cell loss characteristic of Alzheimer's disease. Protection from Aβ toxicity has been attributed to up-regulation of transthyretin (TTR), a normal component of plasma and cerebrospinal fluid. We compared the effect of TTR purified from human plasma (pTTR) with that produced recombinantly (rTTR) on Aβ aggregation and toxicity. pTTR slowed Aβ aggregation but failed to protect primary cortical neurons from Aβ toxicity. In contrast, rTTR accelerated aggregation, while effectively protecting neurons. This inverse correlation between Aβ aggregation kinetics and toxicity is consistent with the hypothesis that soluble intermediates rather than insoluble fibrils are the most toxic Aβ species. We carried out a detailed comparison of pTTR with rTTR to ascertain the probable cause of these different effects. No differences in secondary, tertiary or quaternary structure were detected. However, pTTR differed from rTTR in the extent and nature of modification at Cys10. We hypothesize that differential modification at Cys10 regulates TTR's effect on Aβ aggregation and toxicity.
Keywords: Alzheimer's disease, beta-amyloid, post-translational modification, transthyretin
Introduction
Alzheimer's disease (AD) is the most common age-associated neurodegenerative disease, affecting over 5 million people in the USA. Characteristic features of the disease include extracellular senile plaques, intraneuronal neurofibrillary tangles and extensive neuronal cell death. The plaques contain insoluble amyloid deposits composed primarily of the 4 kDa peptide beta-amyloid (Aβ), which is generated by proteolytic cleavage of the membrane-bound amyloid precursor protein (APP) by β- and γ-secretases (Kang et al., 1987). Alternative cleavage of APP by α-secretase generates the soluble fragment sAPPα. Upon release from APP, Aβ spontaneously self-assembles through a multistep pathway into soluble oligomers and fibrillar aggregates. According to the ‘amyloid cascade hypothesis’, aggregation of Aβ is an early and essential step leading to the intraneuronal neurofibrillary tangles and neuronal cell death that are characteristic of AD (Hardy and Higgins, 1992).
The Swedish mutation of APP, APPSw, leads to enhanced Aβ deposition and early onset AD. Transgenic mice overexpressing APPSw (Tg2576) produce high levels of Aβ and develop amyloid deposits (Kawarabayashi et al., 2001) but lack neurofibrillary tangles and, although gliosis and dystrophic neuritis are observed, do not suffer significant neuronal cell loss (Irizarry et al., 1997), in seeming contradiction to the amyloid cascade hypothesis. Through DNA microarray experiments and immunohistochemical analysis, Johnson and coworkers discovered that transthyretin (TTR) expression was increased dramatically in Tg2576 mice (Stein and Johnson, 2002). Increased TTR expression in Tg2576 mice at 2, 6 or 10 months was recently confirmed (Tsai et al., 2009); those authors reported a decrease in TTR levels in aged (24 months) mice, possibly due to death of the epithelial cells of the choroid plexus. Increased TTR expression was linked to neuroprotection from Aβ, as administration of anti-TTR antibody led to increased tau phosphorylation and neuronal cell death (Stein et al., 2004). Similarly, expression of human TTR was protective in an APP23 transgenic mouse model, while silencing of the endogeneous murine TTR accelerated neuropathology (Buxbaum et al., 2008). Choi et al. (2007) observed accelerated Aβ deposition in APPSw mice with heterozygous TTR deletions. In direct contradiction, however, Wati et al. (2009) found reduced vascular Aβ deposition in TTR-null mice. Interestingly, TTR levels in the cerebrospinal fluid (CSF) of AD patients are lower than in healthy controls (Riisoen, 1988; Serot et al., 1997; Castano et al., 2006; Gloeckner et al., 2008).
TTR, a 55 kDa homotetrameric protein, is synthesized in the liver and choroid plexus and is present in both blood (170–420 µg/ml) and CSF (5–20 µg/ml) (Vatassaery et al., 1991); it is the major protein component of CSF. The protein serves as one of three thyroxine transport proteins and also transports vitamin A via binding to retinol binding protein (Branch et al., 1971). TTR, like Aβ, is amyloidogenic: wild-type TTR amyloid deposits are found in patients with senile systemic amyloidosis, a disease affecting over 20% of the elderly (Westermark et al., 1990). Several TTR mutants have been identified that aggregate more aggressively than the wild-type and are associated with familial amyloid polyneuropathy and other lethal diseases (Hou et al., 2007a). In the generally accepted model of TTR fibrillogenesis, tetrameric TTR dissociates into monomer, and the monomer undergoes subtle conformational changes. Dissociation to monomer occurs readily only at moderately acidic conditions and is believed to precede TTR aggregation (Quintas et al., 2001; Foss et al., 2005).
That TTR interacts with Aβ was demonstrated several years ago (Schwarzman et al., 1994; Tsuzuki et al., 1996). However, there are discrepancies in the reported strength and nature of the binding interaction: TTR has been variously reported to bind to Aβ monomers (Schwarzman et al., 2005), to immobilized Aβ independent of monomer, oligomer or fibril status (Costa et al., 2008), or preferentially to aggregates and not monomer (Liu and Murphy, 2006; Buxbaum et al., 2008). Schwarzman et al. observed that TTR inhibited Aβ aggregation based on dye-binding assays and electron microscopy (Schwarzman et al., 2004), and Costa et al. observed by electron microscopy a decrease in the number and density of Aβ fibrils upon the addition of TTR (Costa et al., 2008). A few studies have demonstrated TTR inhibition of Aβ toxicity (Giunta et al., 2005; Costa et al., 2008).
We previously reported that TTR purified from human plasma (pTTR) at substoichiometric ratios markedly decreased the rate of Aβ aggregation, likely by binding to small Aβ aggregates and arresting their further growth (Liu and Murphy, 2006). In this manuscript, we developed a recombinant expression system for TTR (rTTR) and report unexpected differences between pTTR versus rTTR and the protein's effect on Aβ. We examined the physicochemical cause, and biological consequence, of these differences.
Materials and methods
Recombinant transthyretin
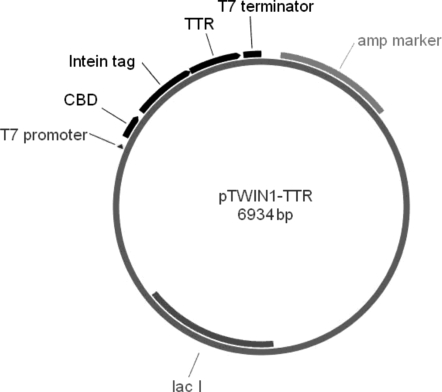
The IMPACT-TWIN system was chosen because it allows for expression of protein with fully human sequence with native N- and C-termini and purification by single-step affinity adsorption without the need for proteases. A gene encoding human wild-type TTR was amplified by PCR from the pDNR-Dual vector (Open Biosystems, Huntsville, AL, USA) with primers 5′-GCTGCTGCTCTTCTAACGGCCCTAC-GGGCACCGG-3′ and 5′-TGTATCCTGCAGCTATTCCTT-GGGATTGGTGA-3′ (Biosource, Camarillo, CA, USA) which were designed with SapI and PstI digestion sites. The PCR product was cleaved with SapI and PstI (NEB, Beverly, MA, USA). pTWIN1-TTR (Fig. 1) was obtained by ligation of the PCR product with analogously double-digested pTWIN1 from the IMPACT-TWIN system (NEB) and transformed into ER2566 cells (Strategene, LaJolla, CA, USA). The TTR gene fragment was confirmed by sequencing. One liter of LB media supplemented with 0.1 mg/ml ampicillin was inoculated with 3 ml of freshly grown culture. The culture was incubated at 37°C until an OD600 of 0.5–0.7 was reached (5–7 h), at which time protein expression was induced with 0.3 mM isopropyl-β-d-thiogalactopyranoside. After overnight growth at room temperature, cells were harvested by centrifugation at 5000g for 15 min at 4°C, resuspended in lysis buffer (20 mM Tris–HCl, 500 mM NaCl, 1 mM EDTA, 20 µM PMSF, 0.1% Tween-20, pH 9.0) containing 8 M urea, and sonicated for 10 min on ice. Tween was not used in lysis buffer when samples were prepared for mass spectrometry. The expressed protein is a fusion of TTR with a self-cleavable affinity tag. The lysis conditions were chosen to maximize solubilization of protein from inclusion bodies while minimizing premature cleavage of the fusion protein. Cell lysate was centrifuged at 19 000g and the supernatant was diluted in half with lysis buffer without urea (Humphries et al., 2002); this step facilitated refolding and binding of the fusion protein to the chitin beads. The solution was clarified by centrifugation at 19 000g for 30 min, and stored at 4°C. Twenty milliliter chitin beads (NEB) were equilibrated with 200 ml column buffer (20 mM Tris–HCl, 500 mM NaCl, 1 mM EDTA, pH 9.0), loaded with clarified cell lysate, washed with 140 ml column buffer and flushed quickly with 60 ml cleavage buffer (20 mM Tris–HCl, 500 mM NaCl, 1 mM EDTA, pH 6.5), all at 4°C. After overnight incubation at room temperature, the target protein was eluted with cleavage buffer, dialyzed against 20 mM NH4HCO3 at 4°C overnight, lyophilized and stored at −20°C. Protein concentration was determined by absorbance at 280 nm, using an extinction coefficient of 77 600 M−1cm−1 (Ferrao-Gonzales et al., 2000).
Fig. 1.
Map of pTWIN-TTR plasmid. The chitin-binding domain is placed downstream of the T7 promoter and provides an affinity handle for purification. The intein tag is a mini-intein that is engineered to undergo pH- and temperature-dependent self-cleavage at its C-terminus. Cleavage releases the target protein (TTR) with native N-terminus.
Plasma-derived TTR
pTTR was purchased as a lyophilized powder from Sigma-Aldrich (St Louis, MO, USA; Cat. No. P1742) and used without further purification.
Electrophoresis
For SDS–PAGE, solutions of rTTR or pTTR in 2.5% (w/v) SDS and 5% β-mercaptoethanol were loaded on a PhastGel Gradient 10–15 gel (GE Healthcare, Piscataway, NJ, USA) with the EZ-Run protein ladder (Fisher BioReagents, Houston, TX, USA) and electrophoresed using SDS buffer strips on a PhastSystem separation unit (Pharmacia, Piscataway, NJ, USA). For isoelectric focusing, samples were loaded on PhastGel IEF4–6.5 gels with standard pI samples (pI ranges from 2.5 to 6.5) from IEF calibration kit. Gels were stained with 0.25% silver nitrate.
Circular dichroism
Solutions of pTTR or rTTR were prepared at 0.1 mg/ml in 10 mM phosphate, 100 mM NaF, pH 7.4. The far-UV spectra (185–260 nm) were recorded on an Aviv 62A DS spectrometer (Lakewood, NJ, USA) at 25°C using a step size of 1 nm and path length of 0.1 cm. Background signals were subtracted and the resulting spectra were analyzed using CONTINLL and three reference protein sets to quantify secondary structure elements.
Tryptophan fluorescence
Solutions of pTTR or rTTR were prepared at 0.1 mg/ml in 10 mM phosphate, 100 mM NaCl and 1 mM EDTA, pH 7.4. Fluorescence spectra were collected by a QuantaMaster Series spectrofluorometer (PTI, Birmingham, NJ, USA), with excitation at 290 nm and emission spectra recorded from 300 to 420 nm. For each sample, three serial spectra were averaged, and the background signal was subtracted.
Size exclusion chromatography
TTR solutions (pTTR or rTTR) at 0.22 mg/ml in PBSA were injected onto a Superdex 75 (Pharmacia) size exclusion column on an HPLC system (Waters Corporation, Milford, MA, USA). PBSA flow rate was set at 0.05 ml/min, and elution peaks were detected by absorbance at 280 nm. The column was calibrated using bovine serum albumin (67 kDa), ovalbumin (43 kDa), β-lactoglobulin (36 kDa) and ribonuclease (14 kDa).
ANS fluorescence
Thyroxine was dissolved in 0.01 M NaOH and its concentration determined by absorbance at 325 nm using an extinction coefficient of 6185 M−1cm−1 (Miroy et al., 1996). pTTR or rTTR (1 µM in PBSA) was mixed with 1-anilinonaphthalene-8-sulfonic acid (ANS, AnaSpec, San Jose, CA, USA), or with ANS and thyroxine (Acros Organics, Morris Plains, NJ, USA). ANS concentration was measured by absorbance at 350 nm using an extinction coefficient of 4950 M−1cm−1 (Nilsson et al., 1975). Fluorescence spectra were collected with excitation at 370 nm and emission spectra recorded from 440 to 500 nm. For each sample, three serial measurements were collected, and the background signal was subtracted from the average of the three measurements.
Mass spectrometry
TTR solutions (rTTR or pTTR) were desalted with 10 000 MWCO Microcon centrifugal filters (Millipore Corporation, Billerica, MA, USA), and reconstituted in acetonitrile/water/acetic acid (50:50:1). The sample was introduced with an automated nano-ESI source, the Triversa NanoMate (Advion BioSciences, Ithaca, NY, USA) with a spray voltage of 1.2–1.6 kV versus the inlet of the mass spectrometer, resulting in a flow rate of 50–200 nl/min. Intact protein molecular ions were analyzed with a linear trap/FT-ICR MS (LTQ FT Ultra) hybrid mass spectrometer (Thermo Fisher Scientific, Bremen, Germany), with the resolving power set at 100 000 m/Δm50% at m/z 400. For MS/MS, the precursor ions were isolated, followed by fragmentation by collisionally activated dissociation (CAD) at 20–25% collision energy and electron capture dissociation (ECD) using 2–3% ‘electron energy’ and a 50–70 ms duration time with no delay. All FT-ICR spectra were processed with ManualXtract Software (FT programs 2.0.1.0.6.1.4, Xcalibur 2.0.5, Thermo Scientific Inc., Bremen, Germany) using a signal-to-noise threshold of 1.5 and fit factor of 60% and validated manually. The resulting fragmentation mass lists were further assigned using in-house ‘Ion Assignment’ software.
Laser light scattering
Light scattering measurements were collected as described in more detail elsewhere (Pallitto and Murphy, 2001; Liu and Murphy, 2006). Briefly, PBSA (0.01 M Na2HPO4/NaH2PO4, 0.15 M NaCl, 0.02% w/v NaN3, pH 7.0) and urea–glycine buffer (10 mM glycine–NaOH, pH 10, 8 M urea) were double filtered through 0.22 µm filters. For TTR alone, total scattered intensities at three different concentrations of pTTR (1.0, 0.75, 0.5 mg/ml) and rTTR (1.0, 0.79, 0.66 mg/ml) in PBSA and at 24 angles from 20° to 135° were obtained; each measurement was repeated five times and averaged. Average scattered intensity of the buffer was measured in the same manner and subtracted from the sample scattering intensity; the result was then normalized by using the scattering intensity of the reference solvent toluene to obtain the Rayleigh ratio as a function of scattering angle. Molecular weight M was determined by double extrapolation to zero angle and zero concentration. Autocorrelation data were collected at 90° scattering angle and fitted to a third-order cumulants expression to determine the inverse z-average apparent hydrodynamic radius Rhz.
For Aβ alone or with pTTR or rTTR, Aβ [Aβ (1–40), Anaspec, Inc.] was dissolved in urea–glycine buffer at 20 mg/ml to ensure a monomeric and unfolded initial state (Pallitto and Murphy, 2001). pTTR or rTTR was dissolved at 0.2 mg/ml (3.6 µM) in PBSA. The Aβ stock solution was diluted 20-fold into filtered PBSA or PBSA with pTTR or rTTR, to a final Aβ concentration of 1.0 mg/ml (230 µM). Residual urea was 0.4 M, and pH of the final solution was 7.0. Samples were rapidly filtered through 0.45 µm filters directly into thermostatted cuvettes. Data collection was initiated ∼10 min after sample preparation. The average scattered intensity Is at 90° was measured repeatedly over a 10 h interval. Autocorrelation data were collected at 90° scattering angle and fitted to a third-order cumulants expression to determine the inverse z-average apparent hydrodynamic radius Rhz. After 10 h, multiangle (20°–135°) scattering data were collected and analyzed assuming a semiflexible particle morphology to determine the weight-average molar mass <M>w of all particles in solution as well as the average contour length Lc, Kuhn statistical segment length lk and average root-mean-square radius of gyration Rg as described previously (Liu and Murphy, 2006).
Transmission electron microscopy
Aβ alone or with 0.2 mg/ml pTTR or rTTR was incubated for 4 days at room temperature, stained with NanoW negative stain (Nanoprobes.com, Yaphank, NY, USA), placed on a pioloform coating grid support film (Ted Pella Inc., Redding, CA, USA), and imaged with a Philips CM120 Transmission Electron Microscope (FEI Corp., Eindhoven, The Netherlands).
Cellular toxicity
At E15, female B6SJL mice were euthanized with isoflurane followed by cervical dislocation. The embryos were removed and their cortices dissected and dissociated via incubation in 0.05% trypsin in Hanks balanced salt solution (Gibco-Invitrogen, Madison, WI, USA) followed by trituration with a 10 ml pipette in CMEM (Minimum Essential Medium supplemented with: 10% horse serum, 10% fetal bovine serum, 500 µM l-glutamine, 1% penicillin/streptomycin, Gibco-Invitrogen). The pooled cell suspension was filtered through a 70 µm filter, and cell viability was determined by trypan blue exclusion. These progenitor cells were diluted in CMEM and seeded on poly-d-lysine-coated 96-well plates at a live-cell density of 2.8 × 10⁵ cells/cm2. The cells were allowed to adhere for 1 h in the 37°C, 5% CO2/5% O2 incubator after which the media was replaced with NBM + B27 w/AO (Neurobasal media with 20 µl/ml B27 supplement with antioxidants, 500 µM l-glutamine, 1% penicillin/streptomycin). The cells were cultured for 7–10 days; 50% of NBM media was changed every 2 days. Aβ(1–42) (American Peptide Company, Sunnyvale, CA, USA) was dissolved in hexafluoroisopropanol at 1 mg/ml, aliquoted into siliconized microfuge tubes, vacuum-dried and stored as a dried film at −80°C. Immediately prior to use, the peptide was thawed and dissolved in PBS at 1 mg/ml, incubated for 20 min at room temperature, diluted with NBM + B27 w/o AO and added to primary cortical neurons. For TTR protection assays, Aβ stock solution was diluted into NBM containing pTTR or rTTR and incubated for 1 h at 37°C prior to addition to primary cortical neurons. After 48 h, cell viability was assayed using the CellTiter 96® Aqueous Non-radioactive Cell Proliferation assay (Promega, Madison, WI, USA). Cell viability was normalized relative to vehicle-treated neurons.
Results
Characterization of pTTR and rTTR
SDS–PAGE analysis under denaturing conditions (protein heated for 10 min at 95°C prior to electrophoresis) revealed a single band migrating at 14 kDa for rTTR (not shown). pTTR also migrated as a 14 kDa band, but a very weak band near 31 kDa was occasionally detected in some gels. This band was eluted and trypsin-digested, and the fragments analyzed by mass spectrometry; through a database search, the band was identified as human TTR and is therefore not a protein contaminant but a TTR dimer. This is consistent with another report in which it was observed that TTR is unusually resistant to SDS denaturation (Manning and Colon, 2004). No bands were detected other than those attributable to TTR. By isoelectric focusing, the two sources of TTR were indistinguishable, with pI of 5–5.2 (data not shown), compared with the theoretical pI of 5.3 (Bowler et al., 2004).
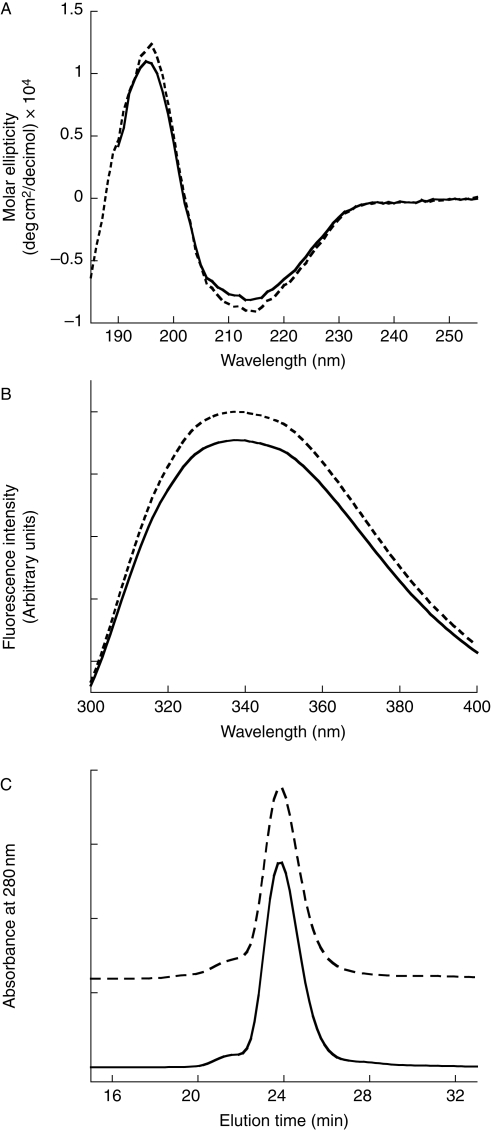
Circular dichroism (CD) spectra taken of both rTTR and pTTR were very similar (Fig. 2A), and quantitative analysis revealed virtually identical secondary structural elements for pTTR and rTTR: 35% β-sheet, 17% α-helix and 21% turn for rTTR and 36% β-sheet, 16% α-helix and 21% turn for pTTR. These results are consistent with TTR's known crystal structure (Blake et al., 1978). Trp fluorescence spectra of both proteins were measured and found to be virtually identical (Fig. 2B), with maximum emission intensity at 338 nm, consistent with native tertiary structure for both rTTR and pTTR, and identical solvent exposure of Trp-41 for the two proteins (Hammarstrom et al., 2001).
Fig. 2.
Comparison of secondary, tertiary and quaternary structure of pTTR (solid) and rTTR (dashed). (A) CD spectra of 0.1 mg/ml protein, pH 7.4. (B) Tryptophan fluorescence emission spectra, with excitation at 290 nm. (C) Elution profiles from chromatography on Superdex 75 size exclusion column. The rTTR curve baseline was displaced for clarity.
To confirm correct assembly of the protein into tetramers, rTTR and pTTR were analyzed by SEC. A single peak eluting at 23.7 min was observed, corresponding to the expected molecular weight of 55 kDa based on column calibration (Fig. 2C). From Zimm analysis of static light scattering data, Mw was determined to be 50 ± 4 kDa for pTTR and 57 ± 4 kDa for rTTR, both consistent with tetramer formation within experimental error. Native PAGE analysis revealed single bands migrating as tetramers for both pTTR and rTTR (not shown). Functional TTR tetramers form a channel that binds hydrophobic probes such as ANS as well as the natural ligand thyroxine. pTTR or rTTR (1 µM) was mixed with 25.9 µM ANS, a concentration sufficient to occupy ∼95% of the thyroxine binding sites. ANS fluorescence increased significantly for both protein samples, with a broad maximum at ∼465–470 nm, indicating binding (Quintas et al., 1999). Addition of 25.9 µM thyroxine quenched ANS fluorescence of both pTTR and rTTR, indicating assembly into functional tetramers (Nilsson et al., 1975).
We next compared the acid stability of pTTR and rTTR. By dynamic light scattering, we observed no aggregation of rTTR at pH 7 or 5.5 but rapid aggregation at pH 4.4 and 37°C (not shown); precipitates were visible within 10 h. In contrast, pTTR at both pH 7 and pH 4.4 remained unaggregated for hours, with a hydrodynamic radius of 4 nm, typical for tetrameric TTR (Hou et al., 2007b). SDS–PAGE analysis of protein samples prepared at pH 3.5 also indicated a difference in acid stability: most (>75%) rTTR dissociated to monomers, whereas most (∼80%) pTTR remained tetrameric (not shown). Interestingly, older literature had indicated that pTTR is unusually stable at low pH, remaining tetrameric and resistant to aggregation to pH < 3.6 (Branch et al., 1971). Other studies, using rTTR, report little to no aggregation of TTR above pH 5.5 but significant aggregation at pH 4.5 (Lashuel et al., 1998).
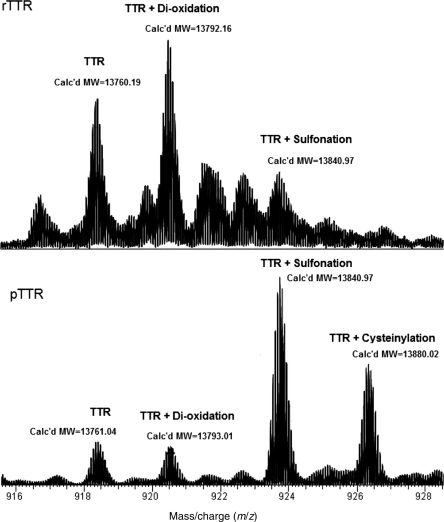
We analyzed rTTR and pTTR by high-resolution mass spectrometry (Fig. 3). For rTTR, we observed major peaks at 13 760.19, corresponding to unmodified TTR (expected 13 760.91), and at 13 792.16 (+32). We also identified a minor peak at 13 840.97 (+80). pTTR had multiple peaks, with major peaks at 13 840.97 (+80) and 13 880.02 (+119), and minor peaks at 13 761.04 and 13 793.01 (+32).
Fig. 3.
Mass spectra (+15 charge state) obtained for rTTR and pTTR. For rTTR, m/z ratios are 918.4181 (‘TTR’), 920.4831 (‘TTR + di-oxidation’) and 923.7497 (‘TTR + Sulfonation’). For pTTR, m/z ratios are 918.4097 (‘TTR’), 920.5416 (‘TTR+di-oxidation’), 923.7384 (‘TTR+Sulfonation’) and 926.3419 (‘TTR + Cysteinylation’). Calculated molecular masses are shown on the corresponding peaks.
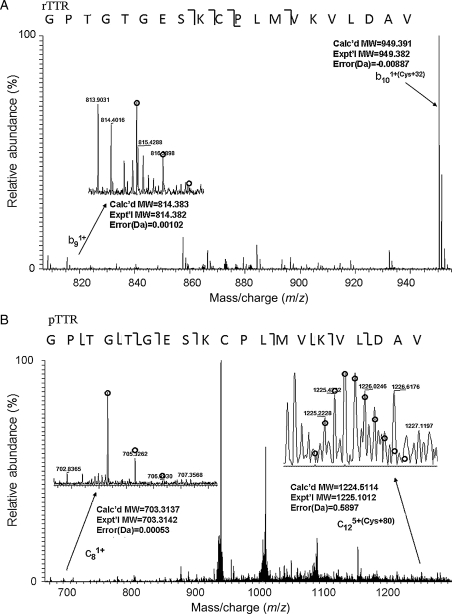
Further tandem mass spectrometry analysis unambiguously localized the site of modification to Cys10 (Fig. 4). Specifically, for rTTR, analysis of the b9 fragment (residues 1–9) arising from the 13 792 Da peak showed the expected molecular mass based on the primary amino acid sequence, whereas the molecular mass of b10 (residues 1–10) was 32 Da greater than expected. For pTTR, the 13 840.07 ion was fragmented; c8 (residues 1–8) had the expected molecular mass based on the primary sequence and c12 (residues 1–12) was 80 Da larger than expected. Therefore, we conclude that the modification site for both rTTR and pTTR is at Cys10, that rTTR is partially modified by di-oxidation to sulfinic acid (-CH2-SO2H, expected 13 792.91) and that pTTR is heavily modified, mainly by S-sulfonation (-CH2-S-SO3H, expected 13 840.89), and secondarily by S-cysteinylation (-CH2-S-Cys, expected 13 880.05) (Kingsbury et al., 2007a, 2007b).
Fig. 4.
Localization of modification to Cys10 by tandem mass spectrometry. The fragmentation pattern for the first 20 residues is shown, with the brackets indicating whether the fragment is from the N- or C-terminus. By convention, ‘b’ indicates an N-terminal fragment obtained from CAD and ‘c’ indicates an N-terminal fragment obtained from ECD, while a numerical subscript indicates the number of residues in the fragment. (A) rTTR was fragmented by CAD and mass spectra of resulting fragments were obtained. Detailed analysis resulted in identification of a single modification (+32) on the b10 fragment that was absent on the b9 fragment. (B) Analysis of fragmented pTTR by ECD MS/MS identified a single modification on the c12 fragment (+80) that was absent on the c8 fragment.
To summarize, pTTR and rTTR are indistinguishable by many measures. However, they differ in their stability to dissociation at low pH, and in the level and nature of modification at Cys10.
Effects of pTTR and rTTR on Aβ aggregate size, morphology and aggregation kinetics
Aβ aggregation was measured by laser light scattering, a technique that is useful for measuring particle size prior to the onset of bulk precipitation. Two measures of aggregation were obtained: the total scattered intensity Is and the hydrodynamic radius Rhz. For small particles (Rg << λ, where Rg is the radius of gyration and λ the wavelength of the incident laser beam), the total scattered intensity Is ∝ ctot <M>w where ctot is the mass concentration and <M>w the weight-average molecular weight of the particles in solution. For illustration purposes only, we will postulate that there is a bimodal distribution of Aβ monomer and Aβ aggregates in solution. In that case, <M>w= wm Mm+ wagg Magg where wm and wagg are the weight fractions of Aβ in monomer and aggregate form, respectively, and Mm and Magg are the molecular weights of Aβ monomers and aggregates, respectively. Since ctot is constant in a given experiment, an increase in Is indicates an increase in <M>w, which could occur because more monomers are incorporated into the aggregates and/or because the size of the aggregates increases. Rhz is a measure of the average particle size as detected by its translational diffusion; an increase in Rhz can be taken as indicative of an increase in the average size of Aβ aggregates.
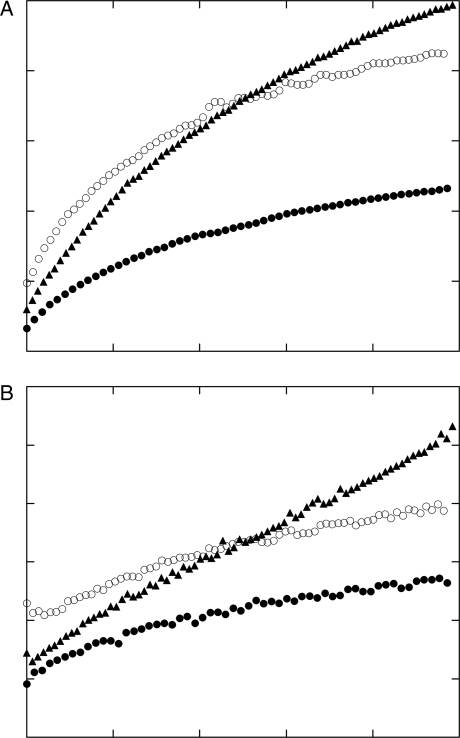
The kinetics of Aβ aggregation alone or in the presence of substoichiometric quantities of pTTR or rTTR (63-fold molar Aβ excess, 5-fold mass Aβ excess) were measured. pTTR and rTTR by themselves were unaggregated and stable at these conditions (not shown). Aβ spontaneously assembled into aggregates that grew over time (Fig. 5). Addition of either pTTR or rTTR initially reduced the average size of aggregates. Consistent with our previous results (Liu and Murphy, 2006), pTTR inhibited Aβ aggregation throughout the time course of the experiment, as measured by either Is (Fig. 4A) or Rhz (Fig. 5B). Surprisingly, the rate of growth of Aβ aggregates with addition of rTTR was much faster than with pTTR (Fig. 5).
Fig. 5.
Effect of TTR on Aβ aggregation kinetics. Aβ concentration was 1.0 mg/ml and TTR concentration was 0.2 mg/ml; sample was prepared in PBSA at pH 7.0. Because of the time it takes to prepare the sample and collect data, the first data collection point (t= 0) is ∼10 min after Aβ and TTR are mixed. (A) Scattered intensity at 90° of Aβ (μ), Aβ with pTTR (λ) or Aβ with rTTR (σ). (B) Average apparent hydrodynamic radius of Aβ (μ), Aβ with pTTR (λ) or Aβ with rTTR (σ).
Multiangle scattering data were taken 10 h after sample preparation and analyzed to determine the average molecular weight <M>w and fibril length Lc of the aggregates. At this time point, the aggregate size varied as Aβ + pTTR < Aβ < Aβ + rTTR (Table I): pTTR decreased <M>w and Lc of Aβ aggregates by ∼2- to 3-fold, whereas rTTR increased <M>w and Lc of Aβ aggregates by ∼2-fold.
Table I.
Size characteristics of Aβ alone, with rTTR or with pTTRa
| <M>w (106 Da) | Lc (nm) | lk (nm) | Rg (nm) | |
|---|---|---|---|---|
| Aβ | 7.3 ± 0.3 | 390 ± 10 | 310 ± 40 | 91 ± 3 |
| Aβ + pTTR | 2.2 ± 0.8 | 170 ± 40 | ND | 50 ± 10 |
| Aβ + rTTR | 18 ± 1 | 970 ± 60 | 200 ± 20 | 156 ± 8 |
aSamples contained 1.0 mg/ml Aβ, and 0.2 mg/ml pTTR or rTTR. Data taken 10 h after sample preparation. Weight-average molecular weight <M>w, average contour length Lc and Kuhn length lk were obtained from fitting the data in Fig. 2B, using P(q) for a semiflexible chain. The z-average root-mean-square radius of gyration Rg was calculated from Lc and lk, as described in Liu and Murphy (2006). ND, not determined; because Lc is relatively small for this sample, we were unable to obtain a reliable estimate for lk.
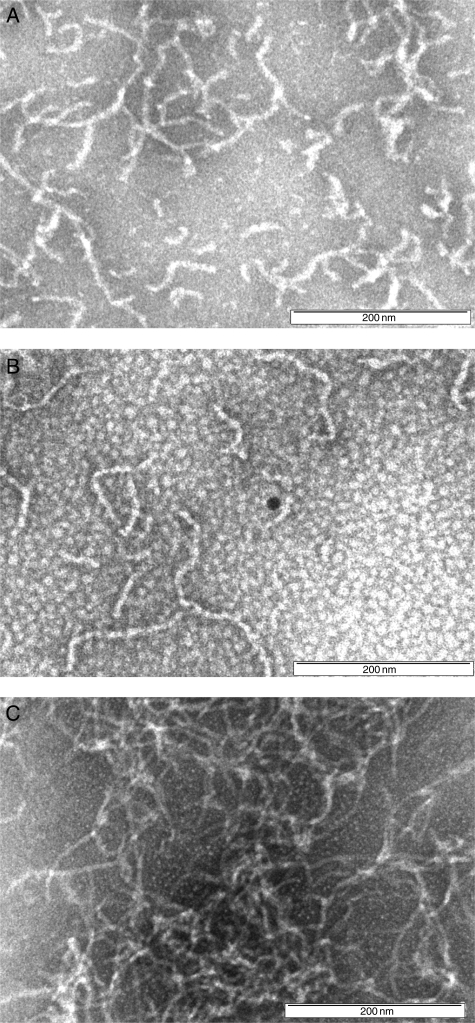
To confirm the differing effects of pTTR and rTTR on Aβ aggregation, samples were incubated for 4 days and examined by transmission electron microscopy (TEM) (Fig. 6). Aβ alone formed aggregates that were typically ∼10 nm in diameter and ∼500–1000 nm in length. Samples containing Aβ + pTTR contained fewer, shorter aggregates (∼100–300 nm in length). In contrast, in samples of Aβ + rTTR, we observed a greater number density of aggregates with a more clumped appearance. No aggregates were observed in TEM images of TTR alone (not shown).
Fig. 6.
TEM images of (A) Aβ alone or with (B) pTTR or (C) rTTR. Images were recorded 4 days after sample preparation. Scale bar = 200 nm.
Cellular toxicity
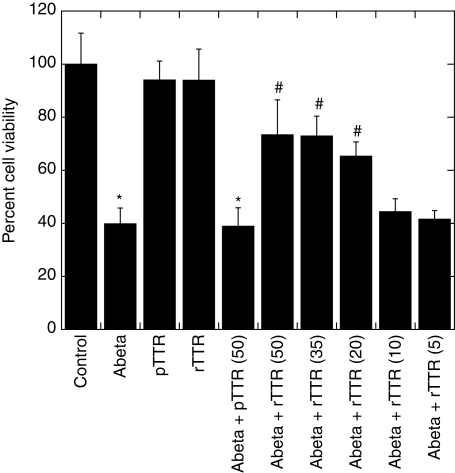
Primary cortical neuron-enriched cultures were exposed to Aβ, pTTR, rTTR, Aβ + pTTR or Aβ + rTTR for 48 h, after which toxicity was assessed. Aβ alone (20 µM) reduced cell viability to 40% relative to vehicle-treated controls (Fig. 7). At 50 µg/ml (0.9 µM), neither rTTR nor pTTR was toxic. Pre-incubation of pTTR with Aβ (22-fold molar Aβ excess) for 1.25 h had no effect on Aβ toxicity. In contrast, rTTR strongly inhibited Aβ toxicity; for example, at 50 µg/ml TTR, cell viability was restored to 73% of control compared with 40% with Aβ alone (P < 0.005). The inhibition was dose-dependent (Fig. 7), with insignificant inhibition when the rTTR concentration dropped below 5 µg/ml.
Fig. 7.
Effect of TTR on Aβ toxicity. A highly enriched neuronal culture of mouse E15 cortical cells was exposed for 48 h to Aβ alone (20 µM) or with pTTR (50 µg/ml) or rTTR (concentration shown in parentheses, in µg/ml). Each bar is the mean ± SD (n = 3). *Significantly different from corresponding control value in the absence of Aβ (P < 0.005); #significantly different from the corresponding sample with Aβ alone (P < 0.005).
Discussion
We produced rTTR using an intein-based system so that we could obtain TTR with fully native human sequence and without the need for protease treatment. In this system, rTTR is expressed in inclusion bodies; we developed a simple affinity purification and on-column refolding protocol that produced pure protein; rTTR folded correctly into functional tetramers, as assessed by gel electrophoresis, CD, Trp fluorescence, size exclusion chromatography and thyroxine binding.
In a previous report, we had demonstrated that pTTR inhibited Aβ aggregation kinetics in a dose-dependent manner (Liu and Murphy, 2006); the data were consistent with a model wherein TTR bound to Aβ soluble aggregates (but not Aβ monomers) and suppressed their further growth. When we evaluated the effect of rTTR on Aβ, we found, much to our surprise, that rTTR accelerated rather than inhibited Aβ aggregation. Furthermore, rTTR and pTTR differed in another crucial way: rTTR strongly suppressed Aβ toxicity in a mouse neuronal culture, whereas pTTR was ineffective at preventing Aβ toxicity. These data demonstrate a correlation between acceleration of aggregation and inhibition of toxicity, consistent with what we have reported previously for other compounds (Ghanta et al., 1996; Lowe et al., 2001; Cairo et al., 2002). Since acceleration of aggregation hastens the conversion of soluble aggregates to more mature insoluble aggregates, this result is consistent with the paradigm that soluble intermediates are more toxic than insoluble mature fibrils (Kayed et al., 2003; Cleary et al., 2005).
We aimed to identify physicochemical differences between rTTR and pTTR that could account for the marked differences in their effect on Aβ aggregation and toxicity. From numerous assays, only two differences emerged. First, pTTR was more stable against tetramer dissociation and aggregation at low pH. Second, high-resolution mass spectrometry revealed that the preparations differed in the extent and nature of post-translational modification at Cys10. Specifically, pTTR was heavily modified by S-sulfonation and S-cysteinylation, whereas rTTR was a mix of unmodified and di-oxidized species.
Post-translational modification of human TTR at Cys10 is the rule rather than the exception, with generally only 10–15% of TTR in the blood or CSF unmodified (Lim et al., 2003). Modifications are heterogeneous, with S-sulfonation or S-thiolation (cysteine or cysteineglycine) most commonly reported. In physiological fluids, mild oxidation at cysteine residues produces a mono-oxidized adduct that reacts with cysteine, glutathione or similar thiol. Di-oxidation, as we observed with rTTR, would generally occur only in the absence of SH-containing compounds. Addition of DTT during the purification procedure completely eliminates this modification (not shown). Curiously, Cys10-modified TTR was less abundant in AD patients than in healthy controls (Biroccio et al., 2006).
Cys10 modification reportedly affects TTR stability. S-cysteinylation destabilizes TTR at both low pH (Zhang and Kelly, 2003) and high pH (Kingsbury et al., 2008), whereas S-sulfonation stabilizes against aggregation under acidic conditions and at pH 9 (Kingsbury et al., 2008). The structural basis for the relationship between Cys10 modification and acid stabilization/destabilization is not yet known. We found that pTTR was heterogeneous, with both S-sulfonation and S-cysteinylation, and it is reasonable to assume that the heterogeneity extends down to individual tetramers. We also found that pTTR was much more stable at acidic pH than rTTR. rTTR is reported to dissociate into monomers and then aggregate at pH 4–5 (e.g. Lashuel et al., 1998), but it is interesting to note that older literature reports that TTR purified from plasma was remarkably resistant to acid dissociation (Branch et al, 1971). We suspect that the differences between pTTR and rTTR in Cys10 modification and in acid stability are linked. This suggests that stabilization with S-sulfonation ‘wins out’ over destabilization with S-cysteinylation. An alternative explanation for the different stabilities of rTTR and pTTR is that a contaminant in pTTR, not detected in any of our assays, confers stability. We consider this less likely, because extensive dialysis did not cause a loss of pTTR acid stability.
Aβ is remarkably and exquisitely sensitive to these small differences in TTR; both aggregation and toxicity of Aβ are affected. Whether the differences in Cys10 modification can explain why rTTR is protective against Aβ toxicity, but pTTR is not, remains to be seen. The difference in acid stability is also intriguing, although it is important to note that the Aβ aggregation and toxicity studies were carried out at neutral pH, where both rTTR and pTTR are fully tetrameric.
Post-translational modification of TTR at Cys10 may be critically important in modulating TTR's interaction with Aβ. Differences in the extent and nature of modification could result in markedly different outcomes and may determine whether or not TTR, normally present in CSF, can provide natural protection against Aβ toxicity. Since the TTR preparations used in these studies were heterogeneous, we are currently systematically modifying Cys10 to examine in greater detail the role of specific post-translational modifications on TTR's interaction with Aβ, and to ascertain the underlying mechanisms.
Funding
This work was supported by the Alzheimer's Association (Grant IIRG-05-13270 to R.M.M.), the National Institute of Environmental Health Sciences (Grant ES08089 to J.A.J.) and the Wisconsin Partnership Fund for a Healthy Future.
Acknowledgements
The authors thank Matthew Tobelmann for assistance with developing the pTWIN-TTR expression system, and Dr Randall Massey for assistance with TEM. CD data were obtained at the University of Wisconsin-Madison, Biophysics Instrumentation Facility, which was established with support from the University of Wisconsin-Madison and grants from the National Science Foundation (Grant BIR-9512577) and the National Institutes of Health (Grant S10 RR13790).
Footnotes
Edited by Sheena Radford
References
- Biroccio A., et al. Proteomics. 2006;6:2305–2313. doi: 10.1002/pmic.200500285. [DOI] [PubMed] [Google Scholar]
- Blake C.C., Geisow M.J., Oatley S.J., Rerat B., Rerat C. J. Mol. Biol. 1978;121:339–356. doi: 10.1016/0022-2836(78)90368-6. [DOI] [PubMed] [Google Scholar]
- Bowler R.P., Duda B., Chan E.D., Enghild J.J., Ware L.B., Mattha M.A., Duncan M.W. Am. J. Physiol. Lung Cell Mol. Physiol. 2004;286:L1095–L1104. doi: 10.1152/ajplung.00304.2003. [DOI] [PubMed] [Google Scholar]
- Branch W.T., Robbins J., Edelhoch H. J. Biol. Chem. 1971;246:6011–6018. [Google Scholar]
- Buxbaum J.N., Ye Z., Reixach N., Friske L., Levy C., Das P., Golde T., Masliah E., Roberts A.R., Bartfai T. Proc. Natl Acad. Sci. USA. 2008;105:2681–2686. doi: 10.1073/pnas.0712197105. [DOI] [PMC free article] [PubMed] [Google Scholar]
- Cairo C.W., Strzelec A., Murphy R.M., Kiessling L.L. Biochemistry. 2002;41:8620–8629. doi: 10.1021/bi0156254. [DOI] [PubMed] [Google Scholar]
- Castano E.M., Rogher A.E., Esh C.L., Kokjohn T.A. Neurol. Res. 2006;28:155–163. doi: 10.1179/016164106X98035. [DOI] [PubMed] [Google Scholar]
- Choi S.H., Leight S.N., Lee V.M.Y., Li T., Wong P.C., Johnson J.A., Saraiva M.J., Sisodia S.S. J. Neurosci. 2007;27:7006–7101. doi: 10.1523/JNEUROSCI.1919-07.2007. [DOI] [PMC free article] [PubMed] [Google Scholar]
- Cleary J.P., Walsh D.M., Hofmeister J.J., Shankar G.M., Kuskowki M.A., Selkoe D.J., Ashe K.H. Nat. Neurosci. 2005;8:79–84. doi: 10.1038/nn1372. [DOI] [PubMed] [Google Scholar]
- Costa R., Goncalves A., Saraiva M.J., Cardoso I. FEBS Lett. 2008;582:936–942. doi: 10.1016/j.febslet.2008.02.034. [DOI] [PubMed] [Google Scholar]
- Ferrao-Gonzales A.D., Souto S.O., Silva J.L., Foguel D. Proc. Natl Acad. Sci. USA. 2000;97:6445–6550. doi: 10.1073/pnas.97.12.6445. [DOI] [PMC free article] [PubMed] [Google Scholar]
- Foss T.R., Wiseman R.L., Kelly J.W. Biochemistry. 2005;44:15525–15533. doi: 10.1021/bi051608t. [DOI] [PubMed] [Google Scholar]
- Ghanta J., Shen C.-L., Kiessling L.L., Murphy R.M. J. Biol. Chem. 1996;271:29525–29528. doi: 10.1074/jbc.271.47.29525. [DOI] [PubMed] [Google Scholar]
- Giunta S., Valli M.B., Galeazzi R., Fattoretti P., Corder E.H., Galeazzi L. Clin. Biochem. 2005;38:1112–1119. doi: 10.1016/j.clinbiochem.2005.08.007. [DOI] [PubMed] [Google Scholar]
- Gloeckner S.F., Meyne F., Wagner F., Heinemann U., Krasnianski A., Meissner B., Zerr I. J. Alzheimer's Dis. 2008;14:17–25. doi: 10.3233/jad-2008-14102. [DOI] [PubMed] [Google Scholar]
- Hammarstrom P., Jiang X., Deechongki S., Kelly J.W. Biochemistry. 2001;41:11453–11459. doi: 10.1021/bi010673+. [DOI] [PubMed] [Google Scholar]
- Hardy J.A., Higgins G.A. Science. 1992;256:184–185. doi: 10.1126/science.1566067. [DOI] [PubMed] [Google Scholar]
- Hou X., Aguilar M.I., Small D.H. FEBS J. 2007;a 274:1637–1650. doi: 10.1111/j.1742-4658.2007.05712.x. [DOI] [PubMed] [Google Scholar]
- Hou X., Parkington H.C., Coleman H.A., Mechler A., Martin L.L., Aguilar M.I., Small D.H. J. Neurochem. 2007;b 100:446–457. doi: 10.1111/j.1471-4159.2006.04210.x. [DOI] [PubMed] [Google Scholar]
- Humphries H.E., Christodoulides M., Heckels J.E. Protein Expr. Purif. 2002;26:243–248. doi: 10.1016/s1046-5928(02)00534-x. [DOI] [PubMed] [Google Scholar]
- Irizarry M.C., McNamara M., Fedorchak K., Hsiao K., Hyman B.T. J. Neuropathol. Exp. Neurol. 1997;56:965–973. doi: 10.1097/00005072-199709000-00002. [DOI] [PubMed] [Google Scholar]
- Kang J., Lemaire H.G., Unterbeck A., Salbaum J.M., Masters C.L., Grzeschik K.H., Multhaup G., Beyreuther K., Muller-Hill B. Nature. 1987;325:733–736. doi: 10.1038/325733a0. [DOI] [PubMed] [Google Scholar]
- Kawarabayashi T., Younkin L.H., Saido T.C., Shoji M., Ashe K.H., Younkin S.G. J. Neurosci. 2001;21:372–381. doi: 10.1523/JNEUROSCI.21-02-00372.2001. [DOI] [PMC free article] [PubMed] [Google Scholar]
- Kayed R., Head E., Thompson J.L., McIntire T.M., Milton S.C., Cotman C.W., Glabe C.G. Science. 2003;300:486–489. doi: 10.1126/science.1079469. [DOI] [PubMed] [Google Scholar]
- Kingsbury J.S., Klimtchuck E.S., Theberge R., Costello C.E., Connors L.H. Protein Expr. Purif. 2007;a 53:370–377. doi: 10.1016/j.pep.2007.01.004. [DOI] [PMC free article] [PubMed] [Google Scholar]
- Kingsbury J.S., Theberge R., Karbassi J.A., Lim A., Costello C.E., Connors L.H. Anal. Chem. 2007;b 79:1990–1998. doi: 10.1021/ac061546s. [DOI] [PubMed] [Google Scholar]
- Kingsbury J.S., Laue T.M., Klimtchuck E.S., Theberge R., Costello C.E., Connors L.H. J. Biol. Chem. 2008;283:11887–11896. doi: 10.1074/jbc.M709638200. [DOI] [PMC free article] [PubMed] [Google Scholar]
- Lashuel H.A., Lai Z., Kelly J.W. Biochemistry. 1998;37:17851–17864. doi: 10.1021/bi981876+. [DOI] [PubMed] [Google Scholar]
- Lim A., Prokaeva T., McComb M.E., Connors L.H., Skinner M., Costello C.E. Protein Sci. 2003;12:1775–1785. doi: 10.1110/ps.0349703. [DOI] [PMC free article] [PubMed] [Google Scholar]
- Liu L., Murphy R.M. Biochemistry. 2006;45:15702–15709. doi: 10.1021/bi0618520. [DOI] [PubMed] [Google Scholar]
- Lowe T.L., Strzelec A., Kiessling L.L., Murphy R.M. Biochemistry. 2001;40:7882–7889. doi: 10.1021/bi002734u. [DOI] [PubMed] [Google Scholar]
- Manning M., Colon W. Biochemistry. 2004;43:11248–11254. doi: 10.1021/bi0491898. [DOI] [PubMed] [Google Scholar]
- Miroy G.J., Lai Z., Lashuel H.A., Peterson S.A., Strang C., Kelly J.W. Proc. Natl Acad. Sci. USA. 1996;93:15051–15056. doi: 10.1073/pnas.93.26.15051. [DOI] [PMC free article] [PubMed] [Google Scholar]
- Nilsson S.F., Rask .L., Peterson P.A. J. Biol. Chem. 1975;250:8554–8563. [PubMed] [Google Scholar]
- Pallitto M.M., Murphy R.M. Biophys. J. 2001;81:1805–1822. doi: 10.1016/S0006-3495(01)75831-6. [DOI] [PMC free article] [PubMed] [Google Scholar]
- Quintas A., Saraiva M.J.M., Brito R.M.M. J. Biol. Chem. 1999;274:32943–32949. doi: 10.1074/jbc.274.46.32943. [DOI] [PubMed] [Google Scholar]
- Quintas A., Vaz D.C., Cardoso I., Saraiva M.J.M., Brito R.M.M. J. Biol. Chem. 2001;276:27207–27213. doi: 10.1074/jbc.M101024200. [DOI] [PubMed] [Google Scholar]
- Riisoen H. Acta Neurol. Scand. 1988;78:455–459. doi: 10.1111/j.1600-0404.1988.tb03687.x. [DOI] [PubMed] [Google Scholar]
- Schwarzman A.L., et al. Proc. Natl Acad. Sci. USA. 1994;91:8368–8372. doi: 10.1073/pnas.91.18.8368. [DOI] [PMC free article] [PubMed] [Google Scholar]
- Schwarzman A.L., Tsiper M., Wente H., Wang A., Vitek M.P., Vasiliev V., Goldgaber D. Amyloid: J. Prot. Fold. Disord. 2004;11:1–9. doi: 10.1080/13506120410001667458. [DOI] [PubMed] [Google Scholar]
- Schwarzman A.L., Tsiper M., Gregori L., Goldgaber D., Frakowiak J., Mazur-Kolecka B., Taraskna A., Pchelina S., Vitek M.P. Amyloid: J. Prot. Fold. Disord. 2005;12:199–209. doi: 10.1080/13506120500350762. [DOI] [PubMed] [Google Scholar]
- Serot J.M., Christman D., Dubost T., Couturier M. J. Neurol. Neurosurg. 1997;63:506–508. doi: 10.1136/jnnp.63.4.506. [DOI] [PMC free article] [PubMed] [Google Scholar]
- Stein T.D., Johnson J.A. J. Neurosci. 2002;22:7380–7388. doi: 10.1523/JNEUROSCI.22-17-07380.2002. [DOI] [PMC free article] [PubMed] [Google Scholar]
- Stein T.D., Anders N.J., DeCarli C., Chan S.L., Mattson M.P., Johnson J.A. J. Neurosci. 2004;24:7707–7717. doi: 10.1523/JNEUROSCI.2211-04.2004. [DOI] [PMC free article] [PubMed] [Google Scholar]
- Tsai K.-J., Yang C.-H., Lee P.-C., Wang W.-T., Chiu M.-J., Shen K.J. Neuroscience. 2009;159:638–646. doi: 10.1016/j.neuroscience.2008.12.045. [DOI] [PubMed] [Google Scholar]
- Tsuzuki F., Fukatsu R., Hayashi Y., Yoshida T., Sasaki N., Takamaru Y., Yamaguchi H., Tateno M., Fujii N., Takahata N. Neurosci. Lett. 1996;222:163–166. doi: 10.1016/s0304-3940(97)13369-9. [DOI] [PubMed] [Google Scholar]
- Vatassaery G.T., Quach H.T., Smith W.E., Benon B.A., Eckfeldt J.H. Clin. Chim. Acta. 1991;197:19–26. doi: 10.1016/0009-8981(91)90344-c. [DOI] [PubMed] [Google Scholar]
- Wati H., Kawarabayashi T., Matsubara E., Kasai A., Hirasawa T., Kubot T., Harigaya Y., Shoji M., Maeda S. Brain Pathol. 2009;19:48–57. doi: 10.1111/j.1750-3639.2008.00166.x. [DOI] [PMC free article] [PubMed] [Google Scholar]
- Westermark P., Sletten K., Johansson B., Cornwell G.G. Proc. Natl Acad. Sci. USA. 1990;87:2843–2845. doi: 10.1073/pnas.87.7.2843. [DOI] [PMC free article] [PubMed] [Google Scholar]
- Zhang Q., Kelly J.W. Biochemistry. 2003;42:8756–8761. doi: 10.1021/bi030077a. [DOI] [PubMed] [Google Scholar]


