Abstract
Despite the fact that the carbohydrate microarray has seen increasing use within the field of glycobiology, the surface chemistry of the glycoarray remains largely unexplored. Motivated by the need to develop surface analytical techniques to characterize carbohydrate-modified surfaces, we developed a quantitative X-ray Photoelectron Spectroscopy (XPS) and Surface Plasmon Resonance imaging (SPR imaging) method to study glycan biosensors. We performed a comparative analysis on the relative coverage of mixed self-assembled monolayers (SAMs) on gold, consisting of a thiol-functionalized trimannoside (Manα1,2Manα1,2Manα-OEG-SH) at varying concentrations (0 to 100%) mixed separately with two thiol-containing polyethylene glycol oligomers. XPS C1s core level analysis was used to identify the O-C-O functionality unique to the carbohydrate acetal moiety and to separate and quantify the relative coverage of sugar in carbohydrate/OEG mixed SAMs. XPS spectra of the mixed SAMs demonstrated a proportional increase in the acetal signature of the glycan with increasing sugar concentration. To relate surface glycan density with biological function, we carried out a kinetic analysis of Concanavalin A (ConA) binding to SAMs of varying densities of carbohydrate using SPR imaging. We observed protein-binding that was highly dependent on both glycan density and the nature of the OEG-thiol used in the mixed self-assembly. These results illustrate the utility of surface analytical techniques such as XPS and SPR in carbohydrate biosensor characterization and optimization.
Keywords: XPS, Glycan, Carbohydrate, Microarray, Glycochip, SPR
1. Introduction
While advances in DNA and protein technologies have made significant contributions to industrial and academic research, investigators studying the biological functions of carbohydrates have been stymied by a paucity of tools relevant to the burgeoning field of glycomics. Glycans, in the form of glycoproteins, glycolipids, glycosylaminoglycans, proteoglycans and other glycoconjugates are known to be involved in inflammation,[1] cell-cell interactions,[2] pathogen-host adhesion,[3] signal-transduction,[4] and development,[5] among many other vital biological processes[6]. However, the structural diversity, complexity and microheterogeneity of carbohydrates and glycoconjugates has limited synthetic access and made difficult the task of isolating defined standards from natural sources. With upwards of half of all proteins containing some glycan modification (N-, O-, or O-Phos-linked),the challenges associated with their study have slowed progress in glycobiology as well as our broader understanding of the majority of biological systems that include glycosylated constituents.
Advances in carbohydrate synthesis are beginning to spin-off new biophysical methods to study glycoconjugates and their many roles in biology[7]. At the forefront of these new tools is the carbohydrate microarray. Drawing upon the strengths of its DNA and protein predecessors, the glycochip’s popularity with the glycomics community is due primarily to its promise as a platform for high-throughput screening of glycan binding partners. Carbohydrate-mediated adhesion events frequently involve low affinity interactions. Therefore, a carbohydrate microarray must display the glycan in a fashion that is readily accessible to interrogating biomolecules and the system must have low non-specific adsorption of analyte to non-binding glycans or underivatized portions of the array. To this end, several published carbohydrate microarrays have successfully demonstrated the platform’s ability to study carbohydrate-protein,[8] carbohydrate-nucleic acid[9] and carbohydrate-cell interactions[10]. However, like other array-based technologies, little is known about the effects of surface chemistry, method of immobilization, density of attached glycan, and glycan accessibility on microarray performance.
Surface analysis methods such as X-ray photoelectron spectroscopy (XPS)—also known as electron spectroscopy for chemical analysis (ESCA)—have seen little application in the study of glycan-modified surfaces, necessitating well-defined standards to serve as references for surface characterization. Due to the lack of standardization in glycochip fabrication chemistries in the literature, it is necessary to use a representative covalent immobilization method to develop surface analytical techniques for these glycol-modified surfaces. The basic goal is to immobilize defined glycans such that they are in a native conformation, solvated and accessible at the surface, and able to interact in a specific manner with their natural binding partners (peptide, nucleic acid, small molecular, cell or virus). Towards this aim, XPS and SPR imaging methodologies will be invaluable for the characterization and optimization of glycoarray surfaces.
The intricacy of SAM formation has peaked widespread interest in developing methods to characterize the bulk properties of SAMs on metals [11] and in microarray based sensors.[12] These advances have improved our understanding of the behavior of small molecules at the surface. Despite an abundance of literature on single-component and mixed SAMs, there are few generalizations to apply to the chemical states and relative coverage of mixed SAMs on surfaces. Radiometric labeling is one of the most commonly used techniques to quantify SAMs. While radiometric labeling can give accurate information about relative coverage, it does not provide insight into the chemical state of mixed SAMs, and the use a radioactivity is undesirable for many laboratories.
In the last three decades, XPS has been used to quantify the chemical state of biomaterials [13], DNA [14], proteins [15], peptide [16], sugars [17], whole cells and isolated cell walls of gram-positive bacteria [18], and mixed SAMs [19] at both bulk and micrometer scale resolutions [20]. Advances in XPS techniques has more recently enabled researcher to obtain chemical information from complex structures on micro-array-based biosensors.[12] However, the application of advanced XPS techniques to study carbohydrate-modified surfaces, a material essential to glycochip fabrication, remains underexplored.
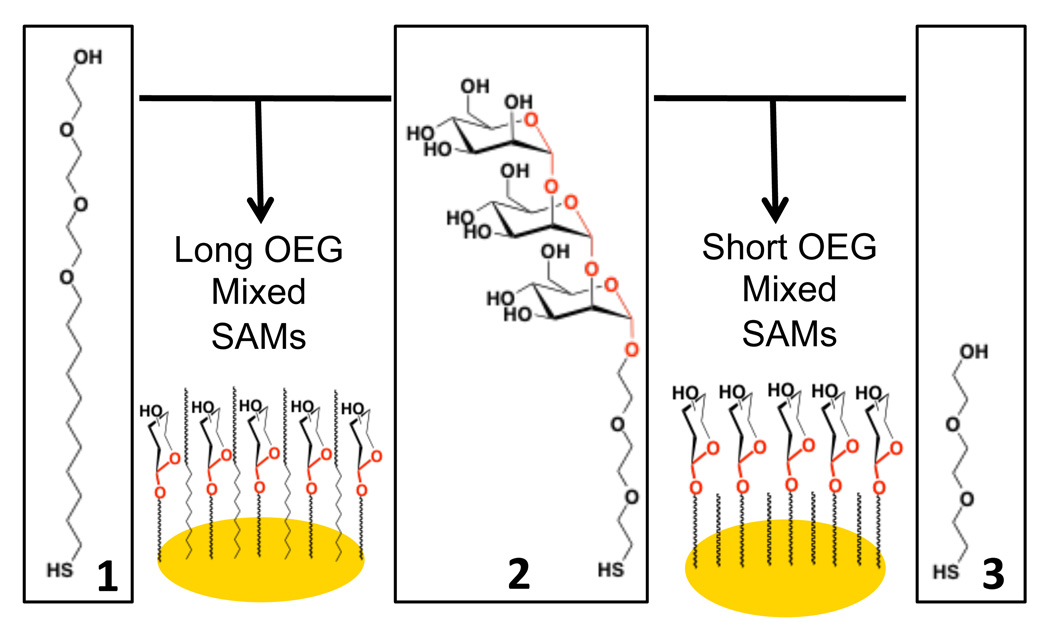
In this study, XPS was used to quantify surface states of carbohydrate/OEG mixed SAMs. To undertake this study, we had to consider that elemental analysis would not provide sufficient information to distinguish the relative coverage of carbohydrates and OEG in the mixed SAMs on the surface – as both the carbohydrate and OEG are composed primarily of oxygen and carbon atoms. Fortunately, carbohydrates have a unique chemical signature, due to the existence of an acetal (O-C-O) moiety which is not present in OEG (See Scheme 1, acetal highlighted in red). Therefore the O-C-O functionality in C1s narrow scan XPS analysis was used as a label to determine the relative proportion of carbohydrate in mixed OEG SAMs, enabling the systematic determination surface coverage of a model carbohydrate trimannoside in mixed SAMs without using radiometric labeling.
Scheme 1.
Assembly of mixed sugar/OEG SAMs on gold.
The information obtained using XPS was correlated with SPR observations to examine the effect of surface glycan density on carbohydrate-protein interactions. Carbohydrate-mediated protein-binding has previously been studied using SPR [21] and SPR imaging [22]. This approach is advantageous because it is label-free, measures real-time binding, consumes minimal quantities of analyte, and it is possible to examine multiple interactions in a single experiment [23]. For the purposes of this study, it was necessary to use a well characterized model lectin (carbohydrate-binding protein) to correlate XPS surface density measurements with SPR. The mannose-specific lectin Concanavalin A (ConA), was ideal for this role. ConA is a 104 kDa plant lectin with four binding sites (a tetramer with dimensions of 63.2, 86.9, and 89.3 Å [24]). It was employed to optimize the binding interaction with carbohydrate micro-arrays of different surface glycan densities. ConA-mannose binding is well characterized and has an adsorption coefficient in the order of 106 M−1 [22]; an excellent model lectin to validate our XPS surface density characterization.
2. Experimental
Materials
Triethylene glycol mono-11-mercaptoundecyl ether (OEG) 1, 95% was purchased from Aldrich and used as received. High analytical grade ethyl alcohol was purchased from Decon Labs, Inc. The OEG was dissolved in 25% ethanol solution in ultra-pure water and prepared as a 4mM stock. Omni Pur phosphate buffered saline (PBS) was purchased from EMD chemicals, Inc., Germany. Canavalia ensiformis Concanavalin A (ConA, jack bean) was obtained from MP Biomedicals, LLC, Ohio and succinyl-concanavalin A (SConA) was obtained from Sigma. Both were used without further purification. ConA (mw = 104kDa) was dissolved in PBS and a 1µM (0.104mg/mL) stock solution was prepared. This stock solution was further diluted at various concentrations, down to 12.5nM (1.3µg/mL) by serial dilution in PBS. SF-10 glass substrates were purchased from SCHOTT Glass Technology, Inc. Culture well silicon sheet (silicon rubber, 1mm thick) was obtained from Grace bio-Labs. 18GA needles (KDS181P) with blunt ends were purchased from Kahnetics to punch holes in the silicon rubber. Ribonuclease A (RNase A) and ribonuclease B (RNase B) from bovine pancreas were purchased from Sigma and were dissolved in PBS to prepare 2mg/mL solution. Bovine serum albumin (BSA) from Omni Pur and urea (certified ACS) from fisher scientific were obtained and used as received.
Preparation of Au substrate
Three different types of gold substrate were used for this study. First, SpotRead™16 (GWC Catalog Number SPR-1000-016) gold substrates were purchase from GWC Technologies, Madison, USA. These chips have sixteen gold spots of 1 mm spot diameter on a hydrophobic substrate. The second type of substrate used was 18 mm × 18 mm piranha solution-cleaned SF-10 glass onto which 2nm Ti and 45 nm gold films were deposited using electron beam (EB) evaporation. The protocols for coating the glass followed GWC recommendations and the EB evaporation was performed at Washington Technology Center (WTC). Finally, for XPS analysis, 1 cm round glass cover slips (Fisher Scientific) were coated with Ti-bonded Au, as described above.
OEG Thiols
Thiol-functionalized OEG and linear trimannoside 2 were prepared as previously described in the literature [25]. Briefly, all structures were synthesized, purified by flash chromatography or size exclusion, and fully characterized by NMR, ESI mass spectrometry and MALDI-ToF. Thiols were stored neat under argon at −20°C, and freshly dissolved in DI H2O immediately prior to self-assembly.
Self-Assembly of OEG- and Sugar-thiols on gold
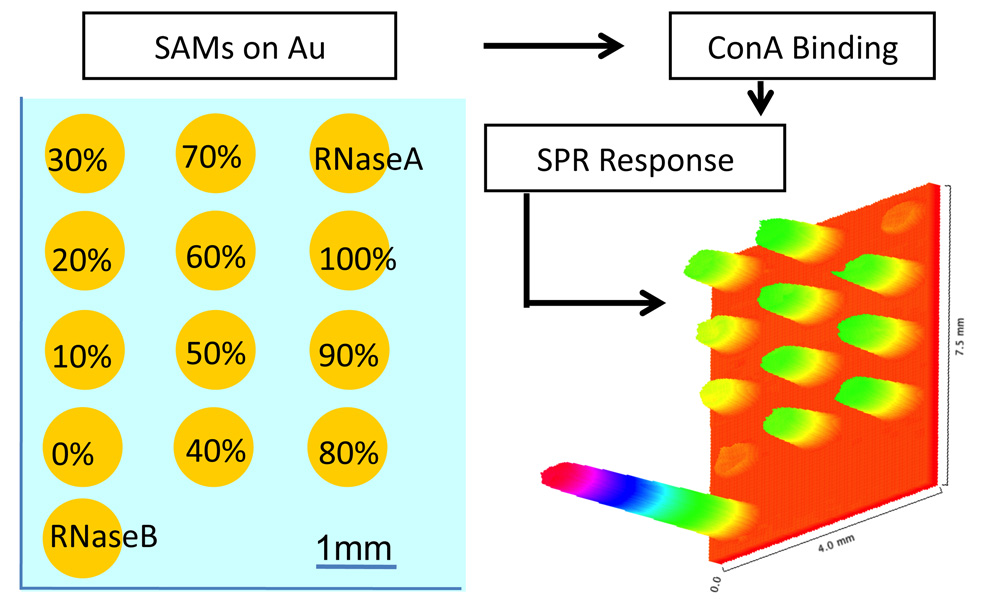
Gold substrates were cleaned by exposure to UV radiation for 20 min under oxygen atmosphere using a Novascan PSD-UV cleaner and followed by two washes with water and ethanol. SAMs of 1, 2, and 3, as well as mixed SAMs of 1 + 2 and 2 + 3 (Scheme 1) were achieved by dispensing 0.5 µL of 2 mM thiol from micropipette and onto each of the gold spots. The spotted chips were left to self-assemble at room temperature for 3 hrs. To prevent evaporation of the solutions, the spotted substrates were placed in a small glass humidity chamber which was filled with 25% ethanol solution and was tightly sealed. After SAM formation, the substrate was washed thoroughly with water and 75% ethanol, repeated 3 times. To prevent non-specific binding on the gold surface, OEG backfilling was carried out for 3 hrs with 4 mM OEG-thiol and the substrates were again washed 3 times with water and 75% ethanol. Next, the substrates were gently dried with a stream of argon and stored at 4 °C. To pattern different mixed SAMs onto a single Au substrate, thiols were assembled on GWC SptReady™ 16 slides, or holes were punched in a silicon rubber sheet using 18GA needle and placed on plain EB gold coated SF10 glass slide for incubation. SAMs were used without further modification for SPR analysis (Scheme 2).
Scheme 2.
SPR imaging arrays of mixed sugar/OEM SAMs on gold interrogated by ConA.
SPR
SPR imaging was performed on the SPRimager®II from GWC Technologies to study protein binding with carbohydrate SAMs. The GWC system was operated using at room temperature using a standard flow cell and a peristaltic pump (BioRad-EconoPump) at 100µL/sec. All surfaces were passivated with 1µM bovine serum albumin (BSA), rinsed with 8 M urea, and equilibrated in PBS prior to lectin-binding. Data acquisition utilized an average of 30 images/frames at each specific point and SPR signal converted to normalized percentage change in reflectivity according to GWC protocol. 8M urea was used to regenerate the carbohydrate surfaces following protein-binding
XPS
The surfaces of trimannoside 2, OEG mixed with 2 at different concentration and 1 SAMs were characterized using X-ray photoelectron spectroscopy (XPS) on a Kratos Axis Ultra XPS instrument using monochromated Al Kα radiation at University of Washington Surface Analysis Recharge Center (SARC) operated by NESAC/BIO personnel. Survey spectra were acquired at constant pass energy and the elemental quantification was carried out using computer aided surface analysis (CasaXPS) software for XPS data analysis. Lower pass energy was used for high-resolution scans of core levels of carbon and gold. To quantify different chemical environments present in the narrow scan spectra, the SAMs were specified by a line shape (GL), relative sensitivity factor, position, full width half maxima and area constraints. Full details of each of these parameters for different types of SAMs are included in the results section.
3. Results and Discussion
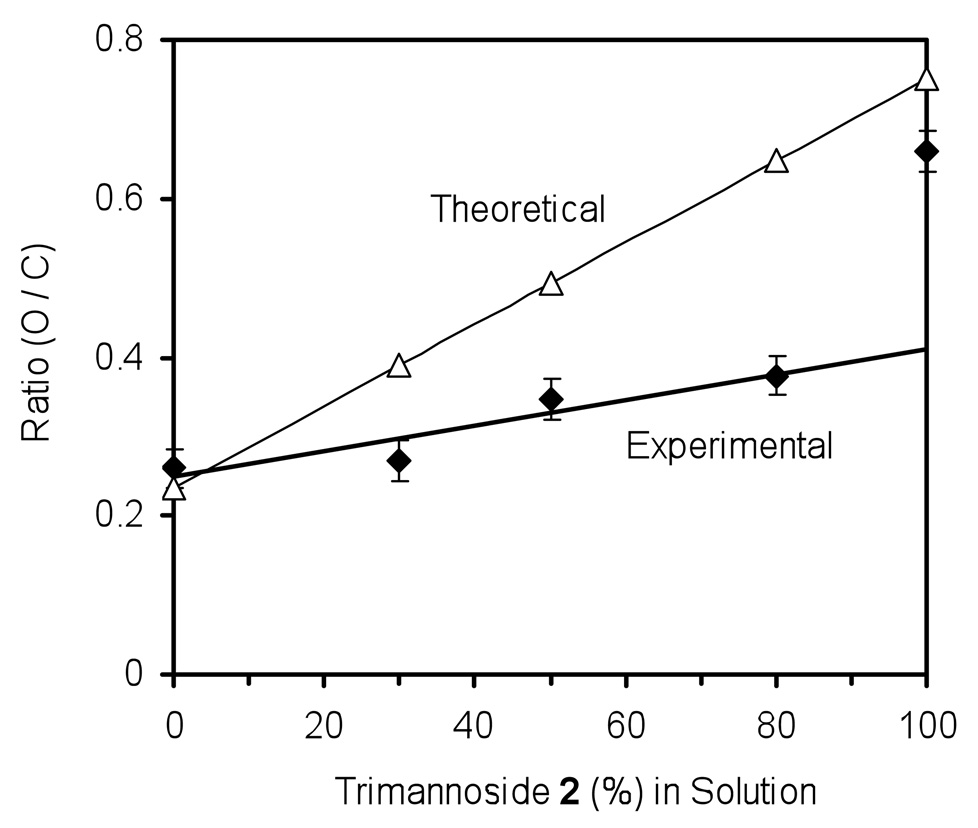
Quantitative elemental analysis on the modified gold surfaces was obtained using XPS to characterize the covalently immobilized thiol-functionalized trimannoside 2 in mixed SAMs with OEG 1. The percent atomic concentration of oxygen (O) and carbon (C) was obtained and the O/C ratio was plotted against the percentage of 2 in solution (mixed with 1) used for self-assembly (Figure 1). The theoretical values of O/C for 2 (chemical formula C24H44O18S) and 1 (chemical formula C17H36O4S) are 0.75 and 0.24, respectively. Experimentally obtained O/C ratios for 2 and 1 were 0.65 and 0.26, respectively. These were in decent agreement with expected O/C values. The O/C values of 1 mixed 2 SAMs demonstrated a linear increase with greater concentrations of 2 in solution. However, the slope of the O/C ratio as a function of concentration of 2 was significantly less than the predicted slope. Based on these observations made by XPS elemental analysis, the relative coverage of sugar-thiol 2 on the surfaces appears to be about 20–30 % less than that of the concentration in solution used during SAM formation. While this result seem plausible – as the bulkier carbohydrate may assemble slower on gold than the OEG-thiol – it appears that the O/C ratio does not accurately represent the surface glycan composition in the mixed SAM. The O/C ratio can be influenced by minor impurities at the surface, including carbon contamination of the gold surface due to environmental exposure after UV/Ozone cleaning and adsorption of water and other contaminants on the sugar and OEG SAM during transfer into the XPS analysis chamber (See Supplemental Figures 1 and 2 for wide scan XPS spectra of the bare gold and mixed SAMS). It has previously been shown that brief exposure of functional surfaces to the environment during routine handling can alter surface chemistry [26], hence the absorption of water to the OEG/sugar SAMs makes the O/C ratio difficult to correlate to surface coverage of glycan in mixed SAMs. These results place additional emphasis on the need to develop a more robust method for the quantitative assessment of surface-carbohydrate composition.
Figure 1.
Surface oxygen to carbon (O/C) ratio of SAMs at different concentrations of 2 with long OEG 1 on gold obtained from wide scan XPS spectra.
Since both carbohydrate and OEG contain oxygen and carbon, it is difficult to distinguish the source of carbon and oxygen in XPS wide scan spectra. Therefore to characterize the ratio of 2 to 1 mixed SAMs, XPS C1s core level analysis was performed to quantify the O-C-O functionality unique to the carbohydrate acetal moiety which is not present in 1 (the acetal in 2 is highlighted in red in Scheme 1). Since the acetal is only present in the immobilized sugar, it can be used as a label to determine relative coverage of carbohydrates in mixed SAMs with alkanethiols or OEG-alkanethiols. This novel method for characterizing surface glycan composition appears to offer a significant advantage over conventional radiometric methods to determine surface density by eliminating the need to handle radioactive materials. Instead, it relies upon traditional XPS analysis techniques.
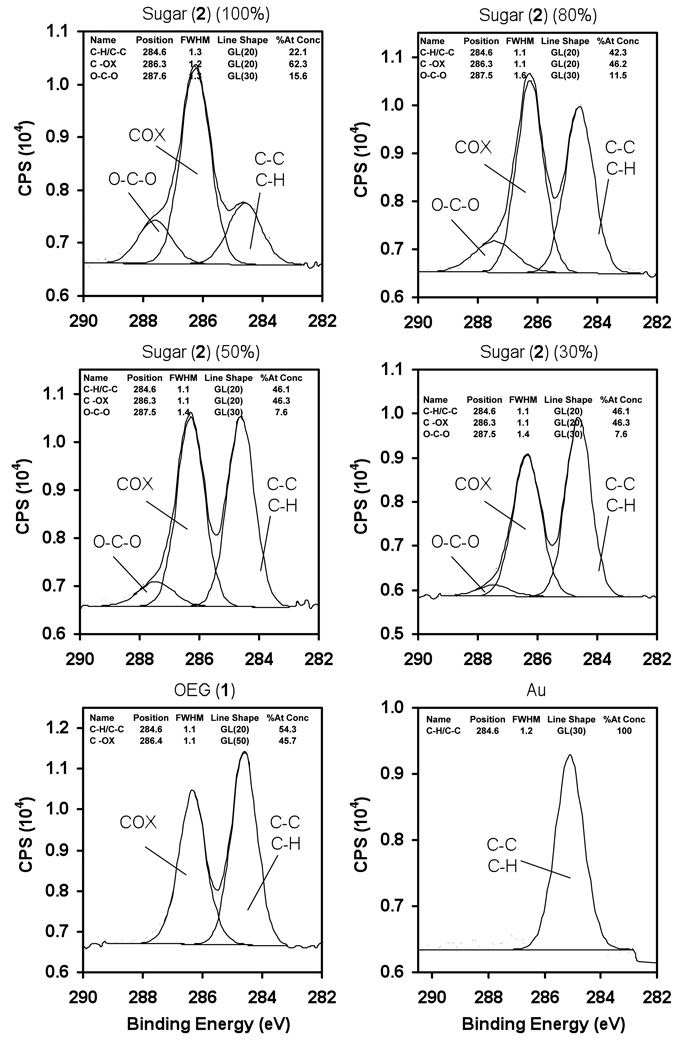
Figure 2 shows the high resolution C1s XPS spectra for mixed SAMs of 2 mixed with long OEG 1 at various concentrations, long OEG 1, and gold thin films. The position of C-C/C-H in C1s spectra was specified and peaks of different carbon environments were fixed relative to C-C/C-H peak. The C1s spectra for the mixed and pure SAMs of 2 were fitted with three peaks: hydrocarbon (C-H/C-C) at 284.6± 0.1 eV, alcohol/ether (C-OX) at 286.3± 0.1 eV and acetal (O-C-O) at 287.6± 0.1 eV. The increase in binding energy relative to hydrocarbon of each oxygen bond with carbon is 1.6 ± 0.1 eV. The XPS high resolution C1s spectrum of 1 was fitted with only two peaks as hydrocarbon (C-H/C-C) at 284.6 eV and alcohol/ether (C-OX) at 286.3 eV. C-C/C-H peak in 1 XPS spectrum was shifted by 0.5eV binding energy relative to 2 and was corrected to the standard (284.6 eV) binding energy for hydrocarbons. A C1s high resolution spectrum of bare gold surface was obtained and no significant carbon oxidation peak was observed. Therefore, from these spectra, it was clear that acetal peak was uniquely associated with the carbohydrate (2).
Figure 2.
XPS high resolution C1s spectra of SAM at different concentrations (100, 80, 50 and 30%) of linear trimannoside 2 with long OEG 1 on gold.
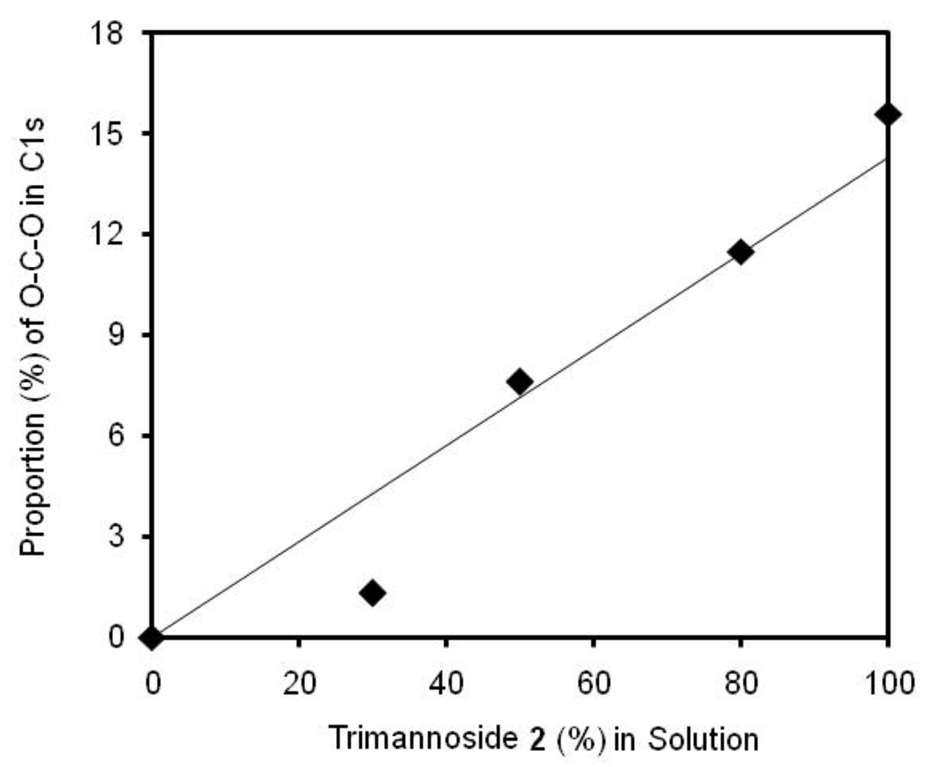
Quantitative analysis of the percentage of XPS C1s signal due to the acetal in mixed SAMs of long OEG (1) and trimannoside (2) was plotted as a function of the concentration of sugar-thiol 2 in solution. In the case of 30% trimannoside, the surface coverage was lower than predicted; however the experimentally obtained proportion of acetal carbon (O-C-O) in the C1s spectra was very similar to the calculated percentage in OEG 1 mixed 2 SAMs at all other points. Therefore, the estimated coverage of 2 at the surface in OEG/sugar mixed SAMs appears to be largely dependent on the ratio of the sugar-thiol and OEG-thiol in the solutions used for self-assembly. The molecular weight of the trimannoside 2 (652.7 Daltons) is nearly twice that of the alkanethiol OEG 1 (336.5 Daltons), but at densities greater than 30% glycan, this difference does not appear to significantly impact the kinetics of mixed self-assembly by the two thiols. This is useful information for designing future microarray surfaces comprised of mixed SAMs of glycans with OEG, as it suggests that we can exercise great control over the ratio of thiols in mixed SAMs by varying the concentration of thiols in solution. This assumption for carbohydrate/OEGthiol mixed SAMs had been made previously,[27] but not confirmed experimentally.
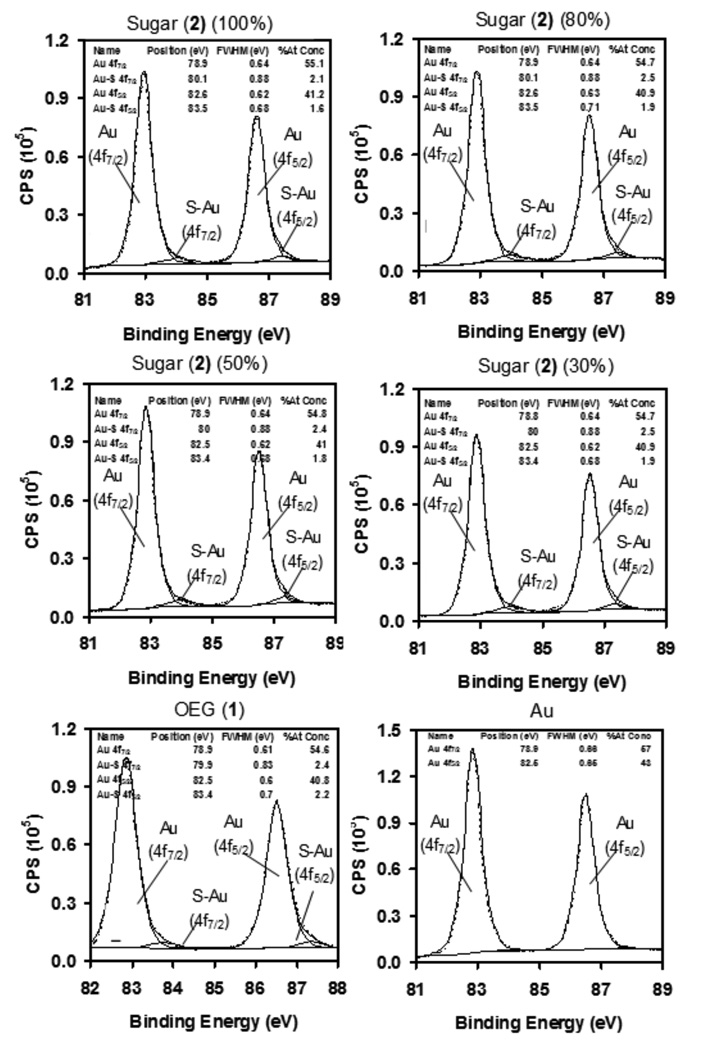
To validate the above observation, it was necessary to look at the chemical uniformity and coverage of the mixed sugar/OEG SAMs. However, it is difficult to accurately quantify the relative number of molecules on the surface of a SAM. To overcome this, we used XPS to determine the proportion of Au-S binding which can be correlated to thiol orientation and total coverage of different types of SAMs.[28] Figure 4 shows Au4f high resolution XPS spectra of SAMs consisting of the trimannoside 2, mixed sugar/OEG, OEG 1 and Au. The Au spectrum of the carbohydrate SAM was fitted with four peaks and the chemical shift relative to the Au (4f7/2) peak is quoted in parenthesis; Au (4f7/2) at 78.9 eV (0 eV), Au-S (4f7/2) at 80.1 eV (1.2 eV), Au (4f5/2) at 82.8 eV (3.9 eV), and Au-S (4f5/2) 83.5 (4.6 eV). Similarly, XPS Au4f spectra for the mixed sugar/OEG SAMs were fitted with four peaks. Bare Au had only two peaks associated with Au (4f7/2) and Au (4f5/2) whereas tiol-containing SAMs had two additional peaks associated with Au-S(4f7/2,5/3). The relative proportion of Au-S (due to thiol-gold binding) in Au4f XPS spectra was approximately the same for the sugar-thiol SAM, mixed sugar/OEG and pure OEG 1 SAMs. This shows that the total number of thiols bound to gold in the different SAMs was equivalent. Taken together, these observations demonstrate our ability to accurately obtain the density profile of sugar/OEG mixed SAMs on gold using XPS.
Figure 4.
XPS high resolution Au4f spectra of SAMs at different concentrations (100, 80, 50 and 30%) of trimannoside 2, mixed with OEG 1 on gold.
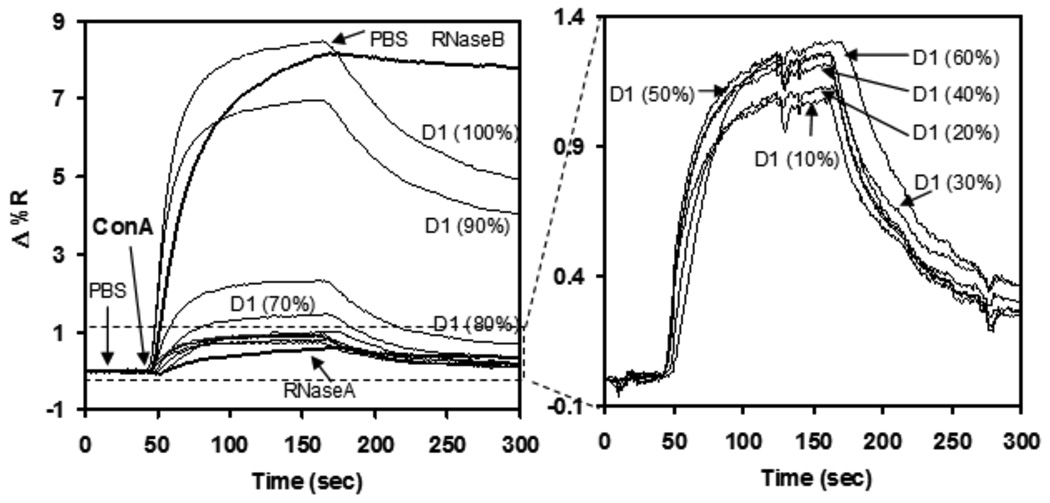
To delve further into the interplay between biomolecules and this sugar/OEG SAM model system, spot arrays of trimannoside 2 and mixed sugar/OEG 1 were used for SPR imaging measurements to investigate the significance of glycan surface density on protein binding. A typical SPR sensorgram of the mannose-specific plant lectin ConA binding pure and mixed SAMs of linear trimannoside (2) is shown in Figure 5. The proteins RNase A and B served as negative and positive controls for ConA binding due to the presence of a large asparagine-linked glycan containing mannose residues in RNase B, which is completely absent in RNase A. An OEG background subtraction was performed to eliminate any signal from non-specific binding by ConA to the surface. ConA-binding was found to be quite reproducible, even following 10 rounds of regeneration using 8M urea to strip off ConA from the carbohydrate/OEG mixed SAMs. The observed data showed >95% reproducibility on regenerated surfaces (data not shown).
Figure 5.
SPR response to the adsorption of ConA on SAMs at different concentrations of trimannoside 2 with long OEG 1. All the results were after OEG background subtraction, RNase A and RNase B were used as negative and positive control.
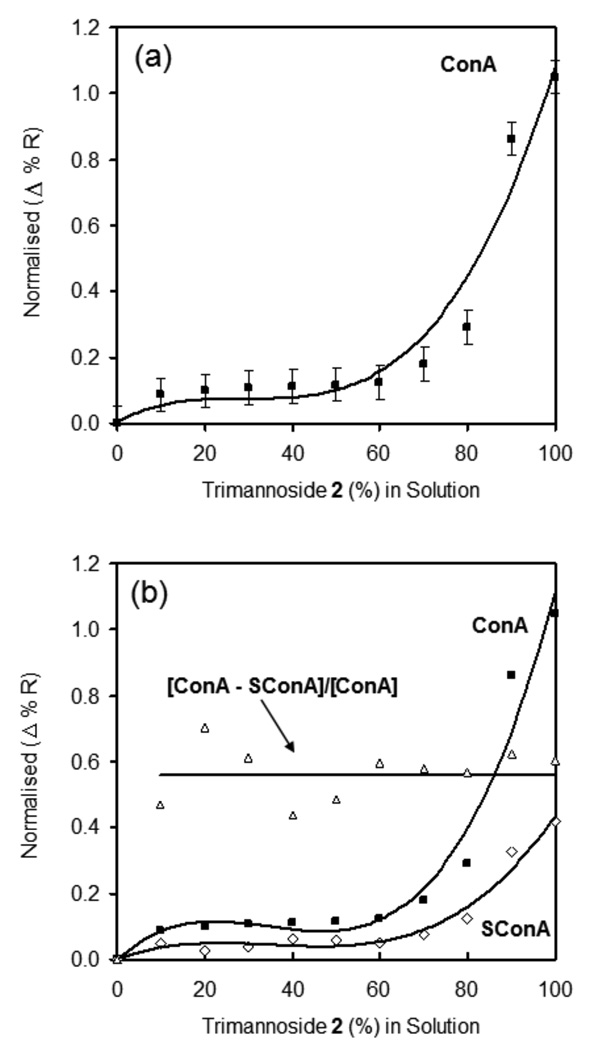
Quantitative analysis was performed to study the effects of glycan surface density in long OEG 1 mixed SAMs on ConA binding, as shown in Figure 6a. These results clearly demonstrate that ConA binding to the long OEG 1 mixed SAMs was nearly nonexistent when the carbohydrate concentration was less than 60%. Binding rapidly increased between the ConA and sugar/OEG mixed SAMs, with the greatest ConA binding at 100% trimannoside 2 on gold. To validate this binding data, we used the divalent form of ConA, succinyl-ConA (see Figure 6b) to see if the same trend would be observed with this close relative to ConA. The binding ratio of SConA to ConA was nearly constant, at roughly 0.5, across the density profile. This would be predicted if SConA and ConA had similar affinities for the sugar SAMs, as the mass of SConA is half that of ConA. Therefore, the total SPR response for SConA should be about 50% that of ConA, just as we observed.
Figure 6.
SPR response of ConA and succinyl-ConA binding to SAMs of varying density of trimannoside 2 mixed with long alkanethiol OEG 1. a) Binding of ConA with SAMs at different concentrations of 2 with long OEG 1 obtained after normalizing with 100% 2. b) Comparison of ConA and succincyl-ConA binding to trimannoside 2 density profiles on gold.
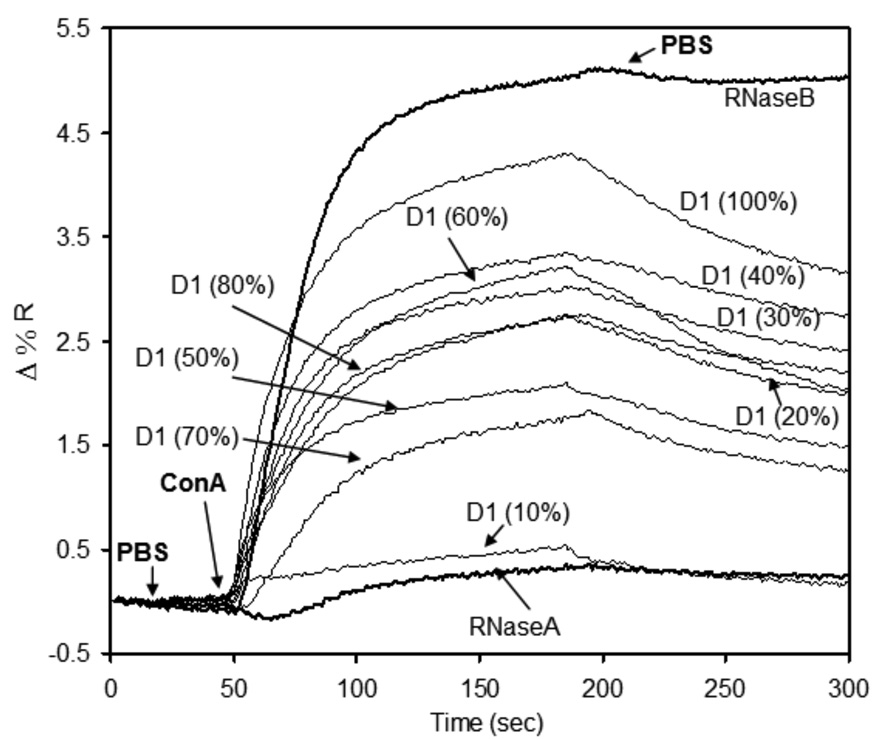
These observations demonstrate that the length of thiol-linked sugar 2 and OEG 1 plays an important role in the accessibility of surface-bound glycan to interrogating protein binding partners – as one might expect. This is evident in the trend of low ConA binding to mixed sugar 2 / OEG 1 SAMs composed of less than 60% carbohydrate, which could be explained by steric hindrance by the taller OEG 1. This appears to support our intuition that backfilling the surface with a longer OEGs significantly reduces bioavailability of surface-bound carbohydrate. As such, we propose that ConA is unable to bind trimannoside 2 when the relative proportion of alkanethiol OEG 1 is greater than 50% due to masking of the surface glycan functionality. To confirm that steric hindrance by alkanethiol OEG 1 of the trimannoside 2 is responsible for reduced ConA-binding, a short OEG-thiol 3—lacking the 11 carbon alkane chain—was synthesized (See Scheme 1). Using the short OEG-thiol 3, a mixed SAM density profile of 2 was achieved following the similar procedure as described above. Spot arrays of short OEG-thiol mixed carbohydrate SAMs were prepared for SPR imaging using the same procedure as those of the long OEG mixed SAMs. The only exception was the use of short OEG-thiol for backfilling the surface, to prevent possible steric crowding of the glycan by the long OEG-thiol 1. Figure 7 shows a typical SPR density profile observation of a ConA binding to mixed sugar/short OEG-thiol (2/3). RNase B and RNase A were used as positive and negative control for ConA specific binding to the surface.
Figure 7.
SPR sensorgram of ConA binding to a density profile of trimannoside 2 in mixed SAMs with short OEG 3. Background subtraction was performed to normalize the data to the sort OEG-thiol. RNase A and RNase B were used as negative and positive control for mannose-specific ConA-binding.
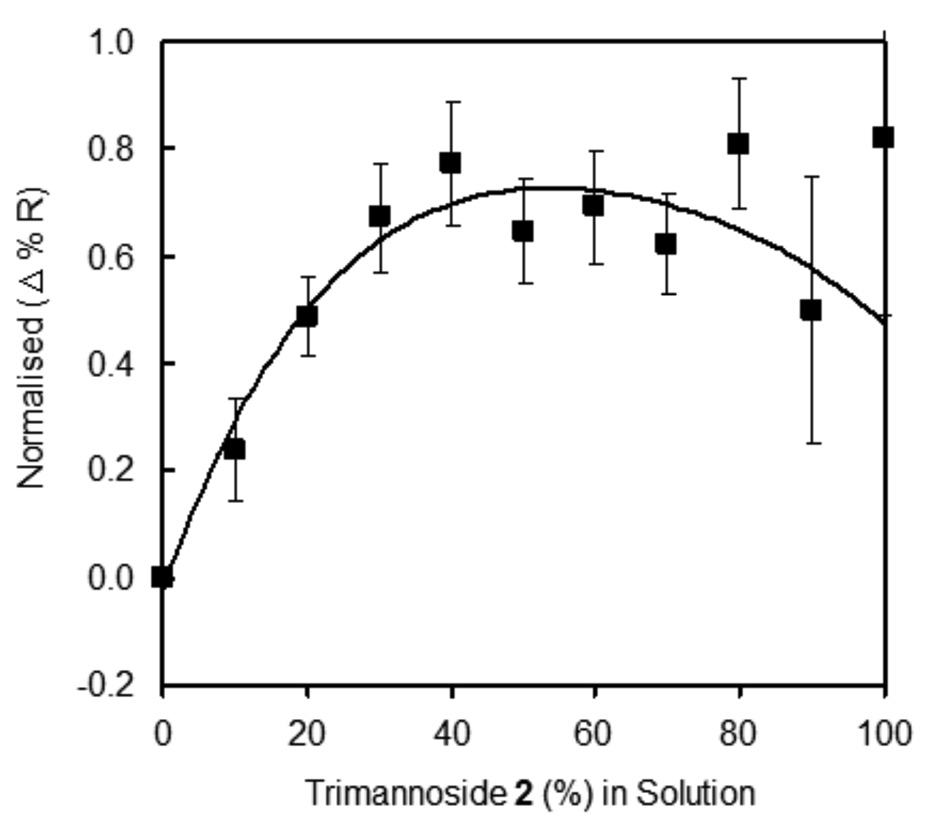
Quantitative variation of ConA binding to different surface densities of trimannoside mixed SAMs with short OEG 3 shows a markedly different profile from that of ConA binding to mixed sugar/OEG SAMs using the longer alkanethiol OEG 1 (Figure 8). Relative binding of ConA rises dramatically with increasing concentration of trimannoside from 0% to 40%. Contrast this rise with that observed using mixed SAMs using the long OEG 1, where little if any binding was observed on SAMs with less than 60–70% glycan (refer to Figure 6a). Interestingly, as the carbohydrate composition in the mixed SAM increases beyond 40–60%, there is a plateau and slight decrease in overall ConA binding. At high surface densities, the immobilized glycan appears to become less readily bound by the interrogating protein – in this case ConA. A number of explanations for this phenomenon are possible, including increased steric crowding at the surface by neighboring carbohydrates or carbohydrate-carbohydrate interactions between surface-bound glycans. While the underlying cause remains elusive, this observation has been replicated for other mixed carbohydrate/OEG SAMs on gold (data not shown), and appears to be valid for a variety of surface-bound glycans. These results warrant further investigation into the role of optimal surface density of immobilized glycan for protein binding and possible reasons for diminished carbohydrate-protein interactions on high-density sugar SAMs on gold.
Figure 8.
Relative binding of ConA with mannoside SAMs at different concentrations of glycan 2 mixed with short OEG 3. SPR results were normalizing with RNase B.
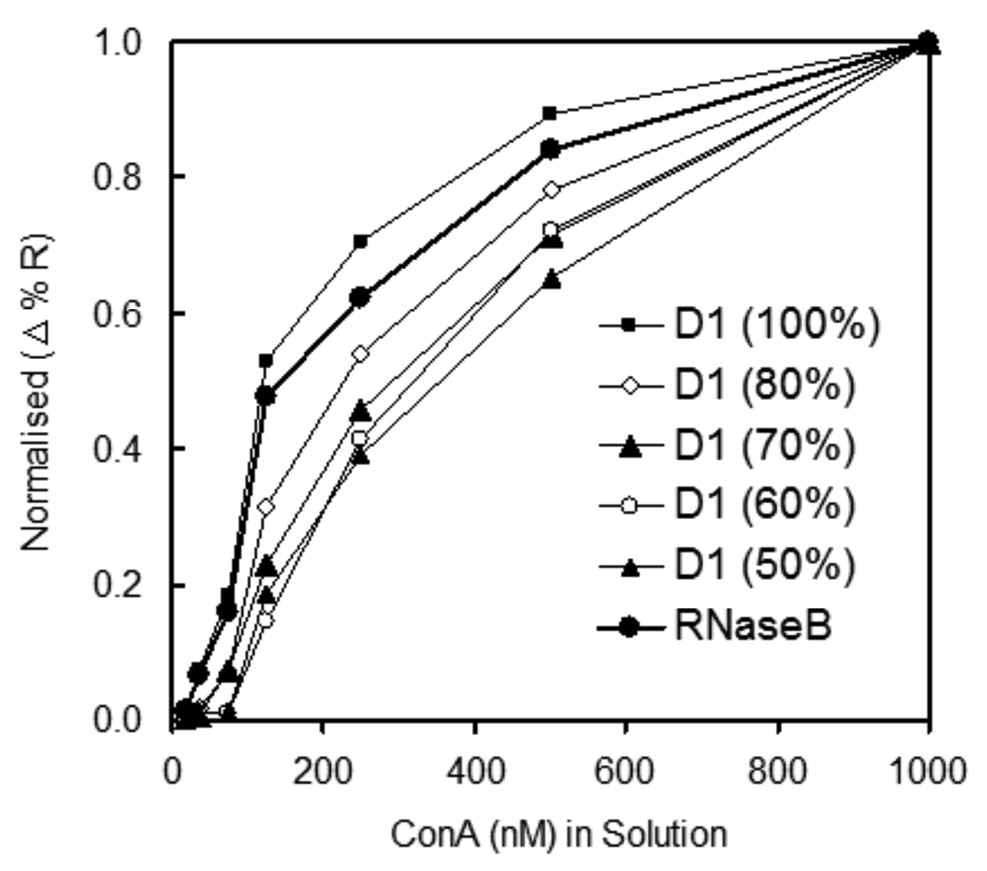
The adsorption coefficient of ConA interacting with a surface density profile of trimannoside (2) was obtained to study the effect of immobilized glycan surface density of the trimannoside on ConA-binding for both long OEG (1) and short OEG (3) mixed sugar SAMs. The adsorption coefficient (KADS) for the binding of ConA to mixed SAMs was obtained from relative protein surface coverage at equilibrium as a function of the protein concentration shown in Figure 9. KADS values at different densities were obtained by:
| (1) |
Where θ is described as relative protein surface coverage, which is derived from the obtained ratio of relative refractivity changes with Con A concentration in solution. Relative coverage for all the surface density profiles were averaged with maximum refractivity obtained individually at mixed carbohydrate/OEG SAM surface for 1µM ConA concentration in the solution. The constant ‘a’ is known as the Frumkin interaction parameter, which is an indication of attractive or repulsive interactions of adsorbing molecules on the surface. In this case, a positive Frumkin interaction parameter was obtained; this is associated with attractive forces at the surface. These calculations were valid with the assumption that the interaction between multivalent ConA (P), and binding site of the sugar 2 (M) follows first order kinetics (P + M → PM). The adsorption coefficient for ConA binding to the trimannoside SAM was 3.1 ± 1.4 × 10⁶ M−1 and was similar to previously observed ConA binding with mannose-derivatized surface KADS (5.6 ± 1.7 × 10⁶ M−1) [22]. Decreasing concentration of 2 mixed SAMs with the long OEG 1 have reduced the KADS values. Mixed SAMs obtained at 80 and 60 % 2 in 1 had KADS 1.9 ± 1.1 × 10⁶ M−1 and KADS 1.3 ± 0.6 × 10⁶ M−1, respectively.
Figure 9.
Relative ConA surface coverage obtained from SPR as a function of ConA concentration on SAMs at different concentrations of trimannoside 2 with long OEG 1. SPR response was normalized with 1µM concentration of ConA in solution.
4. Conclusions
We have successfully developed an XPS C1s core level analysis method to quantify the unique O-C-O functionality of carbohydrate acetals in immobilized monolayers of thiol-modified sugars on gold. The C1s acetal signal was used as a label to determine the relative coverage of carbohydrate in mixed glycan/OEG SAMs. This method is more accurate than the XPS O/C ratio, which appears to significantly underestimate the coverage of immobilized glycan due to adsorption of water during routine handling. The ratio of OEG to sugar in OEG/sugar mixed SAMs was established to be largely dependent on the ratio of the sugar-thiol and OEG-thiol in the solutions used for self-assembly. SPR quantitative analysis has shown that the relative length of sugar-thiol and OEG-thiol plays an important role in the accessibility of the surface-bound glycan to protein binding partners—suggesting that the selection of linker chemistries and inert backfilling molecules is essential to the performance of a carbohydrate microarray / biosensor. Finally, our results suggest that additional studies are required to establish the role of carbohydrate density in optimizing protein-glycan interactions on mixed SAMs on gold.
Supplementary Material
This information is available free of charge via the Internet at http: //pubs.acs.org
Supplemental Figure 1: Wide scan XPS spectra of trimannoside (2) mixed OEG (1) SAMs on gold.
Supplemental Figure 2: Wide scan XPS spectra of trimannoside (2) mixed OEG (1) SAMs on gold.
Figure 3.
Proportion (%) of acetal O-C-O of SAMs at different concentrations of 2 with long OEG 1 obtained from XPS high resolution C1s spectra. Theoretical proportion (%) shown as line;◆, experimental data.
ACKNOWLEDGMENT
This work was supported by Washington Research Foundation, the University of Washington Royalty Research Fund, and the Department of Bioengineering. The authors gratefully acknowledge NESAC/BIO (NIH grant P41 EB002027) for XPS analysis. Special thanks to David Castner for his inspiration and useful discussion, Jim Hull and Lara Gamble for XPS assistance, Paul Yager for UV cleaning of our Au surfaces, Huy Q. Nguyen for synthesis of OEG-thiol, and Jeff Chamberlain for his assistance in reading of manuscript and for his useful comments.
References
- 1.Kansas GS. Blood. 1996;88:3259. [PubMed] [Google Scholar]
- 2.Crocker PR, Paulson JC, Varki A. Nat. Rev. Immunol. 2007;7:255. doi: 10.1038/nri2056. [DOI] [PubMed] [Google Scholar]
- 3.Karlsson KA. Biochem Soc Trans. 1999;10:471. doi: 10.1042/bst0270471. [DOI] [PubMed] [Google Scholar]; Kumari K, Gulati S, Smith DF, Gulati U, Cummings RD. Virol. J. 2007;4:42. doi: 10.1186/1743-422X-4-42. [DOI] [PMC free article] [PubMed] [Google Scholar]
- 4.Sacchettini JC, Baum LG, Brewer CF. Biochemistry. 2001;40:3009. doi: 10.1021/bi002544j. [DOI] [PubMed] [Google Scholar]
- 5.Yu RK, Yanagisawa M. CNS Neurol. Disord. Drug Targets. 2006;5:415. doi: 10.2174/187152706777950675. [DOI] [PubMed] [Google Scholar]
- 6.Taylor ME, Drickamer K. Introduction to Glycobiology. Oxford: Oxford Univ. Press; 2003. [Google Scholar]
- 7.Ratner DM, Adams EW, Disney MD, Seeberger PH. ChemBioChem. 2004;5:1375. doi: 10.1002/cbic.200400106. [DOI] [PubMed] [Google Scholar]
- 8.Blixt O, Head S, Mondala T, Scanlan C, Huflejt ME, Alvarez R, Bryan MC, Fazio F, Calarese D, Stevens J, Razi N, Stevens DJ, Skehel JJ, Die Iv, Burton DS, Wilson IA, Cummings R, Bovin N, Wong C-H, Paulson JC. Proc. Nat. Acad. Sci. U.S.A. 2004;101:17033. doi: 10.1073/pnas.0407902101. [DOI] [PMC free article] [PubMed] [Google Scholar]; Adams EW, Ratner DM, Bokesch HR, McMahon JB, O’Keefe BR, Seeberger PH. Chem.Biol. 2004;11:875. doi: 10.1016/j.chembiol.2004.04.010. [DOI] [PubMed] [Google Scholar]
- 9.Disney MD, Barrett OJ. Biochemistry. 2007;46:11223. doi: 10.1021/bi701071h. [DOI] [PubMed] [Google Scholar]
- 10.Nimrichter L, Gargir A, Gortler M, Altstock RT, Shtevi A, Weisshaus O, Fire E, Dotan N, Schnaar RL. Glycobiology. 2004;14:197. doi: 10.1093/glycob/cwh022. [DOI] [PubMed] [Google Scholar]; Disney MD, Seeberger PH. Chem. Biol. 2004;11:1701. doi: 10.1016/j.chembiol.2004.10.011. [DOI] [PubMed] [Google Scholar]
- 11.Laibinis PE, Whitesides GM, Allara DL, Tao YT, Parikh AN, Nuzzo RG. J. Am. Chem. Soc. 1991;113:7152. [Google Scholar]; Sellers H, Ulman A, Shnidman Y, Eilers JE. J. Am. Chem. Soc. 1993;115:9389. [Google Scholar]; Wang W, Lee T, Kretzschmar I, Reed M. Nano Letters. 2004;4(4):643. [Google Scholar]; Love JC, Estroff LA, Kriebel JK, Nuzzo RG, Whitesides GM. Chem. Rev. 2005;105:1103. doi: 10.1021/cr0300789. [DOI] [PubMed] [Google Scholar]
- 12.Lee C-Y, Harbers GM, Grainger DW, Gamble LJ, Castner DG. J. Am. Chem. Soc. 2007;129(30):9429. doi: 10.1021/ja071879m. [DOI] [PMC free article] [PubMed] [Google Scholar]
- 13.Castner DG, Ratner BD. Surface Science. 2002;500:28. [Google Scholar]; Sabbatini L, Zambonin PG. Journal of Electron Spectroscopy and Related Phenomena. 1996;81:285. [Google Scholar]; Yoshida Y, Meerbeek BV, Nakayama Y, Snauwaert J, Hellemans L, Lambrechts P, Vanherle G, Wakasa K. J. Dent. Res. 2000;79(2):709. doi: 10.1177/00220345000790020301. [DOI] [PubMed] [Google Scholar]
- 14.Herne TM, Tarlov MJ. J. Am. Chem. Soc. 1997;119:8916. [Google Scholar]; Zhao YD, Pang DW, Hu S, Wang ZL, Cheng JK, Dai HP. Talanta. 1999;49:751. doi: 10.1016/s0039-9140(99)00078-8. [DOI] [PubMed] [Google Scholar]
- 15.Coen M, Lehmann R, Groning P, Bielmann M, Galli C, Schlapbach L. Journal of Colloid and Interface Science. 2001;233:180. doi: 10.1006/jcis.2000.7240. [DOI] [PubMed] [Google Scholar]; Browne MM, Lubarsky GV, Davidson MR, Bradley RH. Surface Science. 2004;553:155. [Google Scholar]
- 16.Cook AD, Hrkach JS, Gao NN, Johnson IM, Pajvani UB, Cannizzaro SM, Langer R. Journal of Biomedical Materials Research. 1997;35:513. doi: 10.1002/(sici)1097-4636(19970615)35:4<513::aid-jbm11>3.0.co;2-c. [DOI] [PubMed] [Google Scholar]
- 17.Leonard D, Chevolot Y, Heger F, Martins J, Crout DHG, Sigrist H, Mathieu HJ. Surf. Interface Anal. 2001;31:457. [Google Scholar]
- 18.Dufrene YF, Wal AVD, Norde W, Rouxhet PG. Journal of Bacteriology. 1997;179(4):1023. doi: 10.1128/jb.179.4.1023-1028.1997. [DOI] [PMC free article] [PubMed] [Google Scholar]
- 19.Lee CY, Gong P, Harbers GM, Grainger DW, Castner DG, Gamble LJ. Anal Chem. 2006;78(10):3326. doi: 10.1021/ac052137j. [DOI] [PMC free article] [PubMed] [Google Scholar]
- 20.Davis SJ, Watts JF. Muter. Chem. 1996;6(3):479. [Google Scholar]
- 21.Karamanska R, Clarke J, Blixt O, MacRae JI, Zhang JQ, Crocker PR, Laurent N, Wright A, Flitsch SL, Russell DA. doi: 10.1007/s10719-007-9047-y. [DOI] [PubMed] [Google Scholar]; Field RA. Glycoconjugate J. 2008;25(1):69. doi: 10.1007/s10719-007-9047-y. [DOI] [PubMed] [Google Scholar]; Bandaru JM, Sinha S, Surolia A, Indi SS, Jayaraman S. Glycoconjugate J. 2008;25(4):313. doi: 10.1007/s10719-007-9076-6. [DOI] [PubMed] [Google Scholar]
- 22.Smith EA, Thomas WD, Kiessling LL, Corn RM. J. Am. Chem. Soc. 2003;125:6140. doi: 10.1021/ja034165u. [DOI] [PubMed] [Google Scholar]
- 23.Smith EA, Corn RM. Appl. Spectrosc. 2003;57:320A. doi: 10.1366/000370203322554446. [DOI] [PubMed] [Google Scholar]
- 24.Hardman KD, Ainsworth CF. Biochemistry. 1972;11:4910. doi: 10.1021/bi00776a006. [DOI] [PubMed] [Google Scholar]
- 25.Ratner DM, Adams EW, Su J, O’Keefe BR, Mrksich M, Seeberger PH. ChemBioChem. 2004;5(3):379. doi: 10.1002/cbic.200300804. [DOI] [PubMed] [Google Scholar]
- 26.Dhayal M, Alexander MR, Bradley JW. Applied Surface Science. 2006;252:7957. [Google Scholar]
- 27.Liang MN, Smith SP, Metallo SJ, Choi IS, Prentiss M, Whitesides GM. Proc. Nat. Acad. Sci. U.S.A. 2000;97:13092. doi: 10.1073/pnas.230451697. [DOI] [PMC free article] [PubMed] [Google Scholar]
- 28.Bain CD, Troughton EB, Tao YT, Evall J, Whitesides GM, Nuzzo RG. J. Am. Chem. Soc. 1989;111:321. [Google Scholar]
Associated Data
This section collects any data citations, data availability statements, or supplementary materials included in this article.
Supplementary Materials
This information is available free of charge via the Internet at http: //pubs.acs.org
Supplemental Figure 1: Wide scan XPS spectra of trimannoside (2) mixed OEG (1) SAMs on gold.
Supplemental Figure 2: Wide scan XPS spectra of trimannoside (2) mixed OEG (1) SAMs on gold.


