

Abstract
Immunological synapses are initiated by signaling in discrete T cell receptor (TCR) microclusters and play an important role in T cell differentiation and effector functions. Synapse formation involves orchestrated motion of microclusters toward the center of the contact area with the antigen-presenting cell. Microcluster movement is associated with centripetal actin flow, but the role of motor proteins is unknown. Here we show that myosin IIA was necessary for complete assembly and movement of TCR microclusters and that activated myosin IIA was recruited to the synapse. In the absence of myosin IIA or its ATPase activity, T cell signaling was interrupted downstream of Lck and the synapse was destabilized. Thus, TCR signaling and subsequent immunological synapse formation are active processes dependent on myosin IIA.
Introduction
The specific and long-lasting interface between a T cell and an antigen-presenting cell (APC), termed the immunological synapse, is critical for afferent and efferent limbs of the adaptive immune response1, 2. The supramolecular organization of the immunological synapse was described more than a decade ago3-5, yet the mechanisms leading to its formation and persistence are unknown. No role for motor proteins in immune cell signaling and synapse formation has been established6, 7.
The first step in synapse formation is the engagement of the T cell receptor (TCR) with the appropriate MHC-antigenic peptide complexes leading to actin dependent microcluster formation and recruitment of signaling components to form a signalosome within s8-10. The TCR signalosome includes tyrosine-phosphorylated Lck {http://www.signaling-gateway.org/molecule/query?afcsid=A001394}, ZAP-70 {http://www.signaling-gateway.org/molecule/query?afcsid=A002396} and LAT {http://www.signaling-gateway.org/molecule/query?afcsid=A001392} and excludes transmembrane phosphatase CD45 (refs. 8, 9, 11–13)8, 9, 11-13. The contact area expands by integrin-mediated spreading as TCR microclusters continue to form at the outer edge11, 13. Over a period of min, the microclusters move to the center of the contact area where they fuse into larger clusters and become part of the non-motile central supramolecular activation cluster (cSMAC)13. As tyrosine phosphorylation is reduced in the cSMAC, it was suggested to be the site of inactivation of old clusters, while new microclusters form at the periphery9, 13, 14. The formation and movement of new TCR microcluster based signalosomes towards the cSMAC sustains signaling13.
The driving force for protein rearrangement in the immunological synapse is unknown though actomyosin driven contraction had been proposed to drive TCR movement15. An intriguing alternative was proposed based on size dependent segregation of proteins coupled with receptor-ligand interaction kinetics and membrane dynamics16. Recently, T cell synapses have been shown to display a centripetal version of retrograde actin flow2, 17, a process that propels growth cones of neurons and other motile cells18. A close examination of the centripetal movement of TCR microclusters revealed that it is F-actin dependent and that they move at about half of the speed of the underlying actin cytoskeleton (140 nm/sec vs. 320 nm/sec, respectively) and can change course to move around barriers2, 17. It has been proposed that intermittent coupling between the retrograde actin flow and the microclusters may drive centripetal movement, but the role of motors in this process is not known.
Members of the non-muscle myosin II subfamily play a critical role in many cellular functions, including cell polarization, migration, adhesion and cytokinesis19. Myosin II family members are composed of a heavy chain dimmer, each heavy chain is associated with two myosin light chains (MLCs). Non-muscle myosin II is activated by phosphorylation of the MLCs to induce assembly into bipolar filaments and contraction following interaction with actin filaments19, 20.Three genes encode mammalian non-muscle myosin II heavy chains, referred to as MyH9 {http://www.signaling-gateway.org/molecule/query?afcsid=A004003}, MyH10 and MyH14 (refs. 21, 22)21, 22. Of these three isoforms, only MyH9 is dominant in T cells6, 23. MyH9 pairs with regulatory MLCs to form a complex we will refer to by the common name, myosin IIA. T cell crawling and the movement of beads attached to the surface of T cells were shown to require myosin IIA mediated contractility6, 24. In both studies the immunological synapse appeared to form in the absence of myosin IIA activity or in cells depleted of myosin IIA by siRNA. Myosin IIA was recruited to the synapse6, but its activation and role in signaling and synapse formation were not firmly established.
Here we show that the actin-based molecular motor myosin IIA is an essential participant in immunological synapse formation, persistence and TCR signaling. Myosin IIA was rapidly activated upon TCR engagement and its activity was essential for centripetal movement of TCR microclusters. Additionally, both immunological synapse stability and signaling downstream of TCR required intact myosin IIA.
Results
TCR microcluster movement requires myosin IIA
As TCR microcluster translocation is an essential part of immunological synapse formation we first examined whether myosin IIA was required for this motion. TCR microclusters can be tracked using the supported planar bilayer system and total internal reflection fluorescence (TIRF) microscopy11, 13. We used TIRF microscopy to image the motion of TCR microclusters in Jurkat T cells on supported planar bilayers containing laterally mobile Alexa-568 labeled TCR antibody (OKT3) and intracellular adhesion molecule-1 (ICAM-1)17. In agreement with previous studies, TCR microclusters in Jurkat T cells moved centripetally with an average velocity of 0.15 ± 0.05 μm/sec (p<0.0001) (Fig. 1a and Supplementary Movie 1 online) to generate the cSMAC. The average microcluster displacement from its point of formation to the cSMAC was 2.6 ± 0.8 μm (p<0.0001) and the meandering index, calculated as the displacement divided by the track-length, was 0.83 ± 0.09 (p<0.0001), which are consistent with prior published values17. To test the role of myosin IIA activity in microcluster translocation we first treated the Jurkat cells with blebbistatin, a well-established specific inhibitor of myosin II ATPase activity25. Jurkat cells pretreated for ten min with blebbistatin (50 μM) formed microclusters, but showed reduction of directed microcluster movement, with an average speed of 0.06 ± 0.02 μm/s, a displacement of 0.25 ± 0.13 μm, and a meandering index of 0.17 ± 0.09 (p<0.0001 for all measurements). (Fig. 1a, Supplementary Fig. 1 and Supplementary Movie 2 online). Equivalent blockade of microcluster centripetal motion was detected when ML-7, a myosin light chain kinase (MLCK) inhibitor, was used (Supplementary Movie S3 online). Similar effects of myosin IIA activity inhibition on microclusters movement were obtained when primary human CD4+ T cells were treated with blebbistatin (Supplementary Movies S4-S6 online). Thus, the microclusters continued to move at 40% the speed, but with over 4-fold greater meandering and only 10% of the displacement of control Jurkat cells. In mature synapses with a formed cSMACs, blebbistatin treatment did not disrupt the cSMAC, but the peripheral TCR microclusters ceased directed movement shortly after drug addition (Supplementary Movie S7 online). These results suggest that myosin IIA activity is required for centripetal TCR microcluster movement, but not for microcluster formation.
Figure 1.
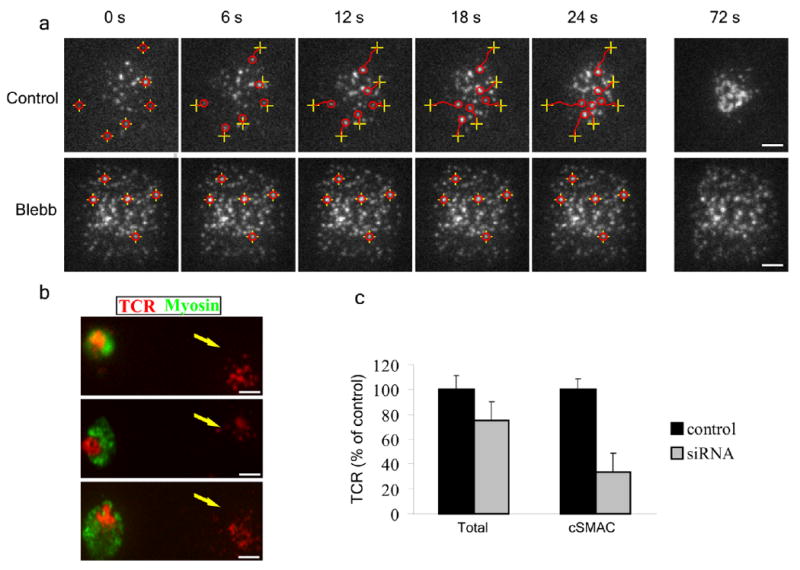
Effect of inhibiting or depleting myosin IIA on the centripetal motion of TCR microclusters. (a) Jurkat T cells were added to a planer lipid bilayer containing Alexa-568 labeled TCR antibody and ICAM-1, and imaged during the initial min of synapse formation by TIRF microscopy. Specific microclusters from control cells (top) or blebbistatin pretreated cells (bottom) were tracked over time. Initial microcluster localization is denoted by yellow crosses, and microcluster localization at each time point is denoted by a red circle. The tracks followed by individual clusters are indicated by red lines. (b) Primary human CD4+ cells treated with siRNA constructs specific for MYH9 were added to a planer lipid bilayer containing Alexa-568 labeled TCR antibody (red) and ICAM1 for 20 min then fixed and stained for myosin IIA (green). Each panel shows one knock-down cell and one non-knock-down cell for comparison. Myosin IIA-depleted cells are denoted by an arrow. (a,b) At least 26 samples were scored per condition, scale bars: 5 μm. (c) Quantitative representation of total TCR and TCR at the center on the contact area (cSMAC) in control and myosin IIA depleted cells. n = 30.
To further test the role of myosin IIA in TCR microcluster translocation we set out to perform siRNA experiments targeting MyH9. Jurkat cells did not recover sufficiently from control siRNA nucleofection to form mature synapses (data not shown). Since myosin II is required for cytokinesis19, shRNA vectors requiring growth and selection would also not be usable. Therefore, we knocked down MyH9 in primary activated human CD4+ T cells, which recover well from nucleofection. The best knockdown efficiency achieved in the primary T cells was 35% by immunoblotting (data not shown). However, immunofluorescence analysis revealed that this decrease was due to near complete knockdown of MyH9 in one third of cells (data not shown). We performed the microcluster tracking analysis on planar bilayers on all cells in several microscopic fields while indexing the x–y coordinates of the fields, then fixed the cells and performed staining for intracellular MyH9, which allowed us to then identify the cells in which MyH9 was knocked down in the previously tracked and indexed cells. Primary T cells depleted of MyH9 failed to form the typical condensed cSMAC and instead had small, scattered TCR microclusters (Fig. 1b). TCR microclusters in control siRNA treated cells had an average centripetal velocity of 0.12 ± 0.034 μm/sec with an average displacement of 2.2 ± 0.53 μm and a meandering index of 0.85 ± 0.07 (p<0.0001 for all measurements). TCR microclusters in MyH9 deficient cells had a speed of 0.062 ± 22 μm/sec, a displacement of 0.26 ± 0.11μm and a meandering index of 0.25 ± 0.11 (p<0.0001 for all measurements) (Supplementary Fig. 1). Notably, there was a significant decrease in TCR accumulation at the cSMAC (p<0.0001) but only a small, non-significant, decrease in total amount of TCR in the entire contact area in cells depleted of MyH9 (Fig. 1c). These results with siRNA knockdown of MyH9 expression reproduce the result with inhibition of myosin II activity with blebbistatin and ML7. Thus, myosin IIA activity is required for TCR microcluster translocation to form a cSMAC, but not for TCR microcluster formation.
Myosin IIA is activated during T cell stimulation
Our initial results indicated that myosin IIA participates in immunological synapse formation. Myosin IIA activation through phosphorylation of the MLC during immunological synapse formation has not been evaluated. We therefore examined the phosphorylation status of the MLC in Jurkat cells stimulated either by soluble anti-CD3 antibodies (OKT3) which activate the TCR only, and using superantigen presented by Raji B cells as APCs, which activates through a complex immunological synapse with engagement of TCR and multiple adhesion and co-stimulatory molecules.
MLCs were not detectably phosphorylated in resting Jurkat cells, but within 30 s of stimulation by soluble OKT3 became phosphorylated and phosphorylation was sustained for at least 30 min (Fig. 2a). In resting Jurkat cells, myosin IIA was uniformly distributed in the cytoplasm, whereas upon stimulation with soluble OKT3, myosin IIA and its phosphorylated MLCs rapidly become enriched with TCR clusters at the plasma membrane (Fig. 2b,c).
Figure 2.
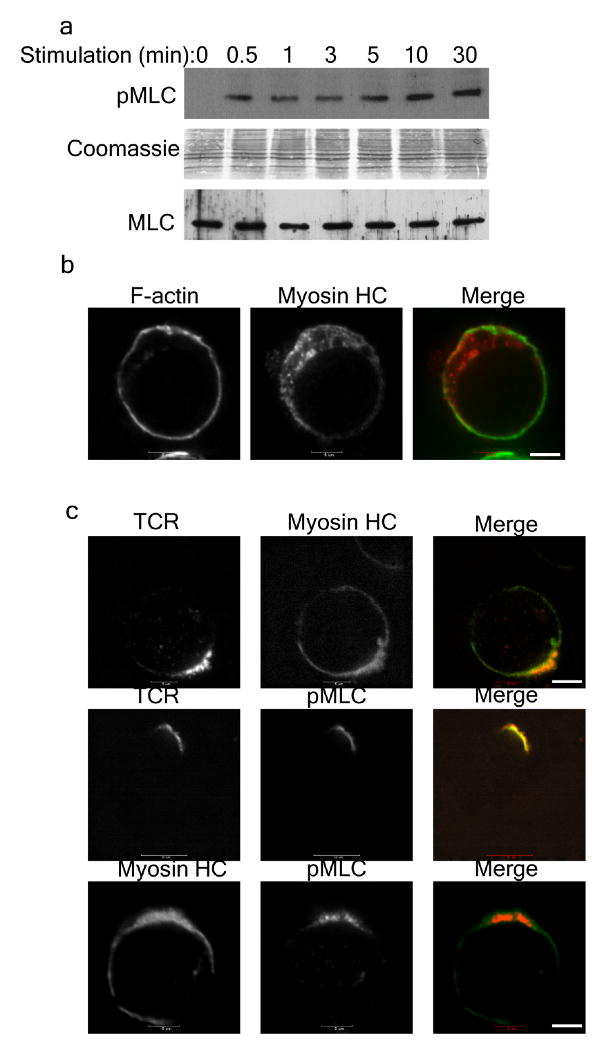
Myosin IIA phosphorylation and redistribution during activation of T cells. (a) Abundance of phosphorylated MLC (pMLC) and total MLC (MLC) was compared in total T cell lysates at various times during activation by soluble TCR antibody (OKT3). (b) Resting Jurkat T cells were fixed and stained for F-actin (green) and myosin IIA heavy chain (HC) (red). (c) Jurkat T cells were stimulated for 1 min with OKT3 then fixed and stained for TCR, myosin HC and pMLC. Scale bars: 5μm. Percentage of cells showing colocalization is 83% for TCR and myosin IIA heavy chain (HC), 92% for TCR and pMLC and 90% for myosin IIA heavy chain (HC) and pMLC. n = 30.
In synapses formed between Jurkat cells and superantigen-loaded Raji cells typical accumulation of TCR, F-actin and ezrin was detected at the contact site as previously described26, 27. In a two-cell system either T or B cell could contribute to this protein redistribution, yet the results obtained with immune synapse between Jurkat and Raji cells were identical to results obtained with Jurkat cells stimulated with soluble OKT3 and were indicative of a seemingly normal immune synapse (Figs. 2,3). Myosin IIA was also highly enriched at the synapse with a distribution very similar to the TCR (Fig. 3a). Similar results were obtained using primary human CD4+ T cells (Supplementary Fig. 2 online). The recruitment of activated myosin IIA to the immunological synapse is consistent with the observed role of myosin IIA in movement of TCR microclusters and cSMAC formation.
Figure 3.
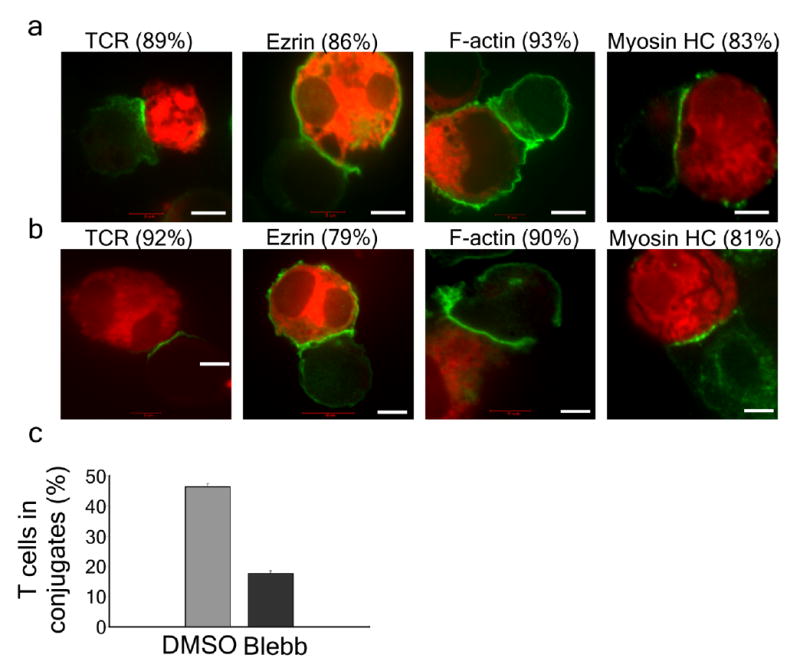
Effect of inhibiting myosin IIA activity on immunological synapse formation. (a) Jurkat T cells were pretreated with DMSO for 10 min followed by 5 min incubation with SEE superantigen-loaded B cells that were prestained with CMTPX (red). Cells were fixed and stained for TCR, ezrin, F-actin or myosin-II heavy chain (green). Numbers represent percentage of cells with similar protein distribution scored in 30 cells. (b) As in a except that cells were pretreated with 50 μM blebbistatin for 10 min. Scale bars: 5 μm. (c) Quantification of the number of immunological synapses that were present after the treatment as in a,b. n = 50. Error bars indicate standard deviation.
Immunological synapse stability requires myosin IIA
To understand the consequence of myosin IIA activity for the immunological synapse, we determined the effect of Jurkat cell pretreatment with 50 μM blebbistatin on synapse formation with superantigen-loaded Raji B cells. Surprisingly, inhibition of myosin II activity did not inhibit the concentration of TCR, ezrin, F-actin and myosin IIA itself at the contact site between the two cells (Fig. 3b). As siRNA could not be applied in the Jurkat model we used both ML7 and an additional inhibitor, Y27632 that inhibits Rho-associated kinase (ROCK). Both ROCK and MLCK phosphorylate and activate MLC and both ML7 and Y27632 inhibited phosphorylation of MLC during T cell stimulation with soluble TCR antibody (Supplementary Fig. 3 online). Conjugates between superantigen-loaded Raji B cells and Jurkat T cells pretreated with either of these drugs had apparently normal accumulation of myosin IIA (Supplementary Fig. 4 online). Similar results were obtained with primary human CD4+ cells pretreated with blebbistatin and incubated with Raji B cells for 5 min (Supplementary Fig. 2). These data confirm and extend earlier indications that the first attachment step of immunological synapse formation does not require myosin IIA activity6. These results were also consistent with the ability of blebbistatin-treated or myosin IIA-depleted cells to form immature immunological synapses on planar bilayers containing anti-TCR complex and ICAM-1 (Fig. 1).
Although conjugates that were formed following myosin IIA inhibition seemed normal, we noticed a reduction in the total number of conjugates formed with T cells pretreated with 50 μM blebbistatin as compared with control cells (Fig. 3c). Conjugate formation was not further decreased by pretreatment with 100 μM blebbistatin (not shown), suggesting that the residual conjugate formation was not simply an effect of partial inhibition of myosin IIA activity. To explore the basis for the reduction in conjugate number, the effect of blebbistatin addition before and after conjugate formation was examined. Superantigen-loaded Raji cells were first immobilized in dishes with coverslip inserts and then Jurkat cells were added. Conjugate formation and stability was monitored by Differential Interference Contrast (DIC) microscopy, with blebbistatin being added at various times relative to conjugate formation (Fig. 4a). Blebbistatin addition reduced the stability of formed conjugates so that only about 20% remained 2 min after drug addition (Fig. 4b). Jurkat cells pretreated with blebbistatin formed unstable synapses that only lasted for 102 ± 14 s (Fig. 4c), whereas control T cells formed stable synapses that persisted for greater than 20 min (not shown). Addition of blebbistatin at various times after conjugate formation resulted in instability and detachment within 1–2 min after drug addition, with an average time of 109 s (Fig. 4c). Importantly, since blebbistatin resulted in the same instability irrespective of the time of addition after synapse formation, myosin IIA activity is needed to maintain the stability of both early and mature synapses. Similar results were obtained inhibiting myosin IIA activation with 10 μM ML7 (Supplementary Movie 8 online) or using primary human CD4+ cells (Supplementary Movies 9,10 online). We next examined whether synapse breakdown results from perturbation of the typical accumulation of the adhesion proteins, LFA-1 and ICAM-1, at the pSMAC5 following myosin IIA activity inhibition with blebbistatin. Pretreatment with blebbistatin led to a more peripheral distribution of these interactions consistent with impaired transport towards the center. However, we could not detect a difference in the intensity of these interactions compared with control cells (Supplementary Fig. 5 online). Thus immunological synapse instability following inhibition of myosin IIA activity is not due to initial failure of LFA-1 activation.
Figure 4.
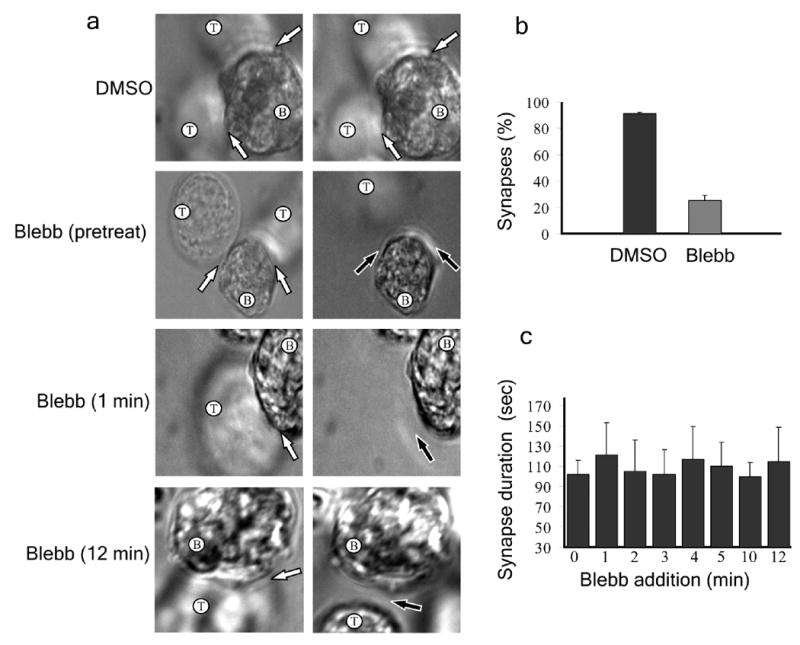
Effect of inhibiting myosin IIA activity on immunological synapse stability. (a) SEE superantigen-loaded B cells were immobilized in dishes with coverslip inserts and Jurkat T cells were added and allowed to form immunological synapses. T cells were either pretreated with DMSO or blebbistatin or were treated with blebbistatin following synapse formation at the indicated times. DIC images were taken before treatment (left) and between 1–2 min after treatment (right). T and B cells are indicated; immunological synapses are denoted by white arrows and loss of synapse is denoted by black arrow. (b) Percentage of synapses present 2 minutes after blebbistatin addition. (c) Average duration of conjugates when blebbistatin was added at various times after synapse formation. (b,c) n = 35. Error bars indicate standard deviation.
Ca2+ signaling requires myosin IIA activity
One of the earliest and most readily monitored signaling events following T cell activation is a rapid elevation in cytoplasmic Ca2+ (ref. 28)28. An earlier study demonstrated that treatment with butanedione monoxide (BDM), a less specific myosin II inhibitor than blebbistatin, in activated primary CD4+ T cells led to less sustained Ca2+ increase following stimulation and a partial blockade of membrane-protein movement to the synapse24. To explore if synapse instability correlates with loss of Ca2+ signaling, Jurkat cells were preloaded with the Ca2+ indicator dye Fluo-LOJO, and the effect of blebbistatin on cytoplasmic Ca2+ assessed in response to superantigen-loaded Raji cells was assessed. While control Jurkat cells maintained elevated cytoplasmic Ca2+ concentrations (Fig. 5a,b), addition of blebbistatin (50 μM) to an existing immunological synapse led to a rapid decrease in Ca2+ concentrations within one minute (Fig. 5a,b and Supplementary Fig. 6b online). Similar results were obtained with ML-7 (Supplementary Movie 11 online and Supplementary Fig. 7). A similar decrease in Ca2+ concentrations following myosin IIA inhibition was detected in primary human CD4+ cells (Supplementary Movies 12-14 online). For a more quantitative measurement of cytoplasmic Ca2+ changes, Jurkat cells were loaded with the ratiometric Ca2+ indicator dye, Fura-2AM, and emission ratios were imaged. Addition of blebbistatin (50 μM) to cells with pre-formed synapses reduced cytoplasmic Ca2+ concentrations to baseline within less than 2 min, while control cells maintained elevated Ca2+ concentrations (Fig. 5c). Pretreatment with blebbistatin (50 μM) blocked TCR-induced Ca2+ elevation altogether (Fig. 5c). To rule out the possibility that emission intensity changes resulted from auto-fluorescence of blebbistatin, T cells were pre-loaded with the Ca2+ indicator dye and blebbistatin was added without any TCR stimulation. Blebbistatin fluorescence was negligible in our assays (Supplementary Fig. 6 online). Moreover, we found that the addition of 50 μM blebbistatin to the cells, followed by illumination, had no toxic effect (data not shown). Importantly, in all these experiments, the decrease in cytoplasmic Ca2+ concentrations preceded the detachment of the immunological synapse, showing that myosin IIA activity is necessary for sustained Ca2+ signaling in T cells during the immunological synapse, independently of any effects on adhesion.
Figure 5.
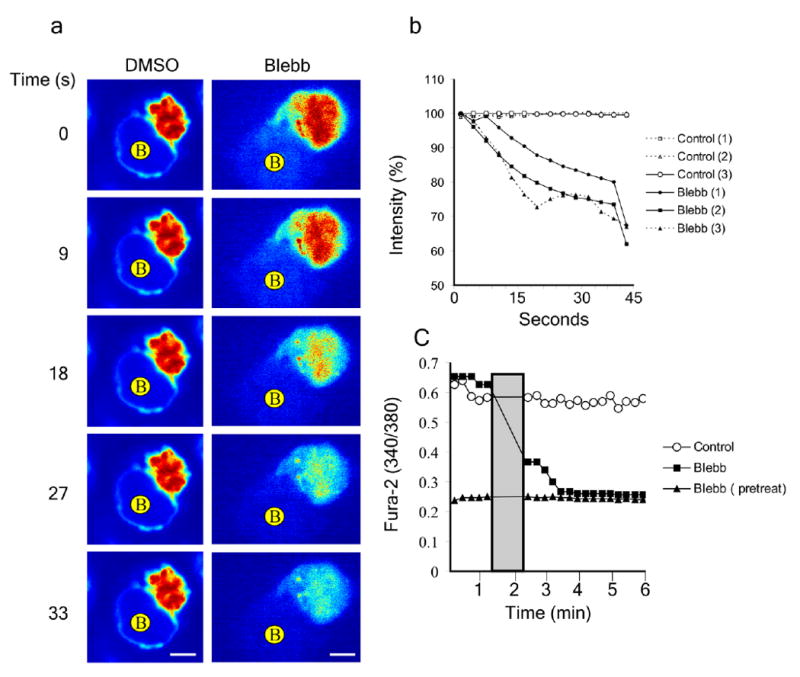
Effect of inhibiting myosin IIA activity on intracellular Ca2+ concentration. (a) Jurkat T cells were incubated with the cytoplasmic Ca2+ sensitive dye Fluo-LOJO and then mixed with SEE superantigen-loaded B cells and allowed to form immunological synapses. Following synapse formation DMSO or blebbistatin was added and Fluo-LOJO emission intensity was imaged for the indicated times. B cells are indicated. Scale bar: 5 μm. (b) Changes in intensity over time of Ca2+ sensitive dye in three representative DMSO and blebbistatin treated cells. Treatment was added at time 0 and 100% intensity on the y-axis is the average sustain signal in superantigen activated cells. (c) Jurkat T cells were incubated with the ratiometric cytoplasmic Ca2+ dye, Fura-2-AM, then added to a planer lipid bilayer containing TCR antibody and ICAM-1 for 15 min prior to cell imaging. 340/380 absorbance ratios were determined by fluorescence microscopy every 15 s. Addition of blebbistatin or DMSO is indicated as a gray bar. Intensity ratios over time for control cells (with DMSO added), blebbistatin treated cells or cells pretreated with blebbistatin were averaged for 17 cells in 2 independent experiments. The low and high calcium ratios corresponding to cells in EGTA Mg2+ (+) Ca2+ (-) or ionomycin were also determined using buffers, respectively.
The serial triggering model holds that one MHC-bound antigenic peptide engages a large number of TCRs in successive rounds, contacting about 50–200 receptors per antigenic peptide29. This model is compatible with the recent demonstration that 10 peptide-MHC complexes in the T cell-APC interface can sustain signaling long enough to generate interleukin 2 (ref. 30)30. If myosin IIA is only required to promote an active process of serial triggering then increasing the number of TCRs triggered in parallel might overcome the requirement for myosin IIA activity. To test this possibility, we explored whether increased amounts activating TCR antibody could overcome the effect of blebbistatin on Ca2+ signaling. Jurkat cells were preloaded with Fluo-LOJO and then stimulated with increasing concentrations of TCR antibody. Once the cytoplasmic Ca2+ concentrations had risen, 50 μM blebbistatin was added and the Ca2+ concentrations monitored for an additional minute. The drop in cytoplasmic Ca2+ concentration was independent of the concentration of activating antibody, with a similar drop seen in cells stimulated with between 10–500 μg/ml antibody (Supplementary Fig. 8 online). This result argues against insufficient TCR engagement as a mechanism to account for the decrease in Ca2+ signaling.
TCR signaling requires myosin IIA activity
Our results suggest that myosin IIA may be important for TCR signalosome function. The simplest way to activate formation of TCR signalosomes is based on addition of soluble anti-CD3ε to Jurkat cells31, which we have shown activates MLC phosphorylation. We incubated Jurkat cells with fluorescently tagged anti-CD3ε and monitored the TCR distribution and biochemical indicators of TCR signalosome assembly, namely phosphorylation of Lck, ZAP-70 and LAT. Control Jurkat cells initially showed a uniform surface fluorescence that aggregated into microclusters of 280 ± 70 nm diameter by 1 min, followed by coalescence into larger clusters of 456 ± 88 nm after 5 min of stimulation (Fig. 6a,b). When Jurkat cells were pretreated with 50 μM blebbistatin for 5 min and then stimulated with the labeled TCR antibody for 1 min, the TCR clusters were slightly smaller, with a diameter of 217 ± 63 nm. However, progression in cluster size in the blebbistatin-treated cells was minimal, reaching a diameter of 247 ± 66 nm after 5 min of stimulation (Fig. 6a, b). We next explored the effect on microclusters when blebbistatin was added 1 or 5 min after stimulation. In both cases, 5 min after blebbistatin addition, the cluster size was reduced, with diameters of 217 ± 64 nm and 258 ± 59 nm for 1 and 5 min, respectively (Fig. 6a,b). Taken together, these results show that TCR microclusters of about 217 nm in diameter can form in the absence of myosin IIA activity, yet their coalescence into larger clusters, and their maintenance in larger clusters, requires myosin IIA activity. Similar results were obtained in primary human CD4+ cells (Supplementary Fig. 2). When Jurkat cells were treated with anti-CD3ε for 2 min and then subjected to analysis of phosphorylated signalosome components by direct immunoblotting of lysates we found that phosphorylation of Src kinases, likely including phosphorylated Lck was similar with or without blebbistatin pretreatment (Fig. 6c). In contrast, phosphorylated ZAP-70 or phosphorylated LAT were both substantially decreased by blebbistatin pretreatment (Fig. 6c). Similar results were obtained with primary CD4+ T cells (Supplementary Fig. 2). We also examined if Jurkat cells pretreated with blebbistatin elevate Ca2+ in response to soluble anti-CD3ε stimulation. T cells preloaded with Fluo-LOJO and stimulated with soluble TCR antibody undergo a robust Ca2+ response, whereas cells pretreated with blebbistatin failed to elevate Ca2+ concentrations in response to stimulation (Supplementary Fig. 8 and Fig. 5c). These results indicate quantitative defects in TCR microcluster size and defective signalosome function in a synapse-free assay.
Figure 6.
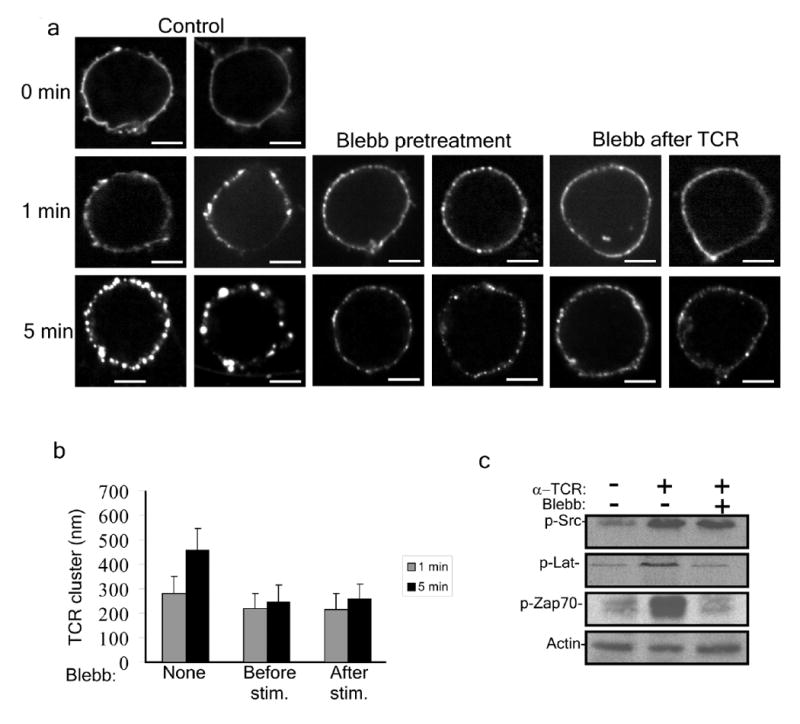
The effect of inhibiting myosin IIA activity on TCR microclusters. (a) Jurkat T cells were stimulated with Alexa-Fluor 488 anti-CD3 (control), or pretreated with 50 μM blebbistatin for 10 min (Blebb pretreatment) or 50μM blebbistatin was added after TCR stimulation at indicated times (Blebb after TCR). Cells were imaged immediately, or 1 and 5 min after stimulation. Two representative cells are shown for each time point. Scale bars: 5μm. (b) Quantitative analysis of experiments depicted in a (n = 35 clusters for each bar). (c) A representative Immunoblot analysis of 3 independent experiments of SrcpY416, ZAP70pY319 and LATpY191 in Jurkat T cells treated with OKT3 for 2 min without, or with, blebbistatin pretreatment. Actin protein abundance is shown as a loading control.
TCR signalosome function can also be evaluated in a synapse-based system using supported planar bilayers presenting OKT3 (ref. 17)17. T cells interacting with a planar bilayer containing OKT3 and ICAM-1 for 5 min had a central condensed TCR cluster surrounded by peripheral microclusters containing TCR as well as phosphorylated Src kinases, ZAP70 and LAT (Fig. 7a,b), similar to previous studies9. When Jurkat cells pretreated with 50 μM blebbistatin were added to the bilayers followed with staining with specific antibodies to each phosphoprotein the phosphorylated Src kinases were colocalized with TCR microclusters, but phospho-ZAP70 and phospho-LAT abundance, as measured by fluorescence intensity were significantly decreased by 80% each (P < 0.0001; Fig. 7a,b). We also extended this analysis to primary CD4+ T cells treated with control and MyH9 siRNA during activation, which resulted in a nearly complete myosin IIA knock down in one-third of the cells. We found that myosin IIA knockdown reduced Src kinase phosphorylation by only 25% (P < 0.0001), but reduced ZAP-70 Tyr319 phosphorylation by 80% (P < 0.0001) and reduced LAT phosphorylation by 70% (P < 0.0001). These data demonstrate by both pharmacological and reverse-genetic approaches that myosin IIA is required for amplification of TCR signaling between Lck and ZAP-70 activation steps.
Figure 7.
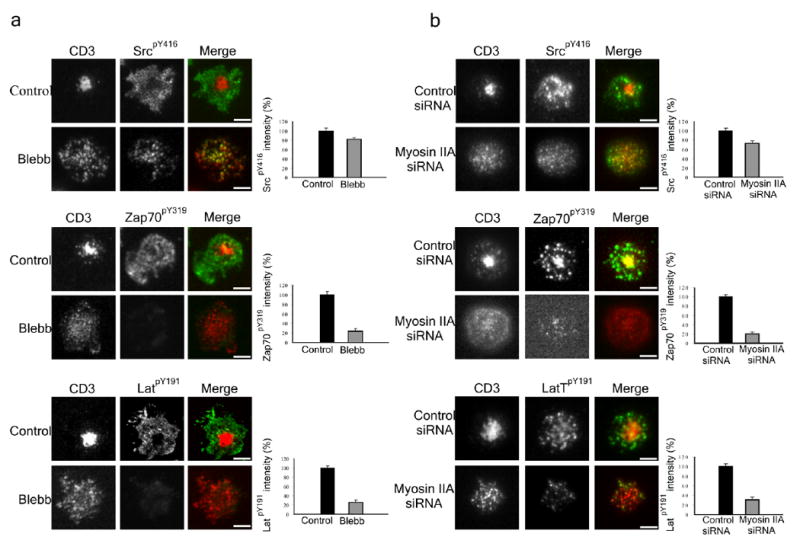
The effect of inhibiting or depleting myosin-II on signaling in T cells. (a) Control or blebbistatin pretreated Jurkat T cells were added to a planer lipid bilayer containing Alexa-568 labeled TCR antibody and ICAM1 for 25 min. Cells were then fixed and stained with antibodies against SrcpY416, ZAP70pY319 and LATpY191. Quantitative representation of relative protein phosphorylation is depicted on the right (n = 15 cells for each bar and error bars indicate standard deviation). (b) Primary human CD4+ cells treated with siRNA constructs either specific or non-specific for MYH9 gene were added to a planer lipid bilayer containing Alexa-568 labeled TCR antibody and ICAM-1 for 25 min. Cells were then fixed and stained with antibodies against SrcpY416, ZAP70pY319 and LATpY191. Myosin IIA depleted cells were determined by the lack of central TCR clustering as demonstrated in Fig. 6b. Quantitative representation of relative protein phosphorylation is depicted on the right (n = 15 cells for each bar).
Discussion
Here we describe the first evidence that myosin IIA plays a central role in synapse assembly and signaling, being necessary for TCR signaling, microcluster centripetal motion and fusion during immunological synapse formation and synapse persistence. Earlier work has shown that the F-actin cytoskeleton is required for all of these processes17, 32 and revealed that TCR engagement induces actin polymerization by recruitment of Nck and Wiskott-Aldrich syndrome protein (WASP) to the TCR microclusters33. Our study shows that upon T cell engagement myosin IIA was activated by MLC phosphorylation and its activity was necessary for proper signalosome assembly. Inhibition of myosin IIA activity using the highly specific myosin II inhibitor, blebbistatin, or depletion of myosin IIA expression using specific siRNA, resulted in complete halt of microcluster directed motion, prevented the formation of the cSMAC and prevented amplification of TCR signals after Lck activation. Whether myosin IIA activity was inhibited pharmacologically, in which case myosin IIA was still recruited to the synapse, or if its expression was reduced by siRNA, in which case it was profoundly depleted from the synapse, formation of initial small TCR microclusters remained intact. However, these clusters did not increase in size, did not fully signal and did not undergo directed translocation. Thus, we have defined distinct F-actin dependent and actomyosin dependent phases of T cell activation and immunological synapse formation.
The potential involvement of myosin II in immunological synapse formation has been reported in earlier studies. In one study, movement of ICAM-1-coated beads on T cells following activation by a B cell was inhibited by butanedione monoxime with concurrent reduction in Ca2+ signaling, although the B-T conjugates remained stable24. It was hypothesized that myosin II mediated transport was delivering components to the immunological synapse that were needed for sustained signaling. In another study, myosin IIA was shown to be necessary for T cell motility and uropod maintenance, and it was postulated that inhibition of myosin IIA filament formation was required for the T cell stop signal upon antigen encounter6. These authors also reported that immunological synapse formation appeared unaffected by pretreatment with blebbistatin. This result is in agreement with our findings that immunological synapses formed with blebbistatin-treated T cells were initially similar to synapses with control cells. The T cell blasts used in the earlier study6 have high constitutive LFA-1 activity, such that myosin IIA dependent signaling was not required for conjugate formation. We have focused on two systems, Jurkat T cells and primary human T cells, in which basal LFA-1 activity is low and inside-out signaling through the TCR is required for conjugate formation34. In retrospect, evidence of spreading and contraction in the immunological synapse formation process is visible in earlier studies5, 9 and was explicitly described for B cell synapse formation without implicating myosin II35. We previously observed contractile oscillations at the outer edge of the immunological synapse formed by T cells32. Contractile oscillations require myosin IIA in fibroblasts. Our results suggest that this is also likely to be true in lymphocytes36.
Myosin II based cortical movement has been documented in several other situations. Myosin II is necessary for cortical tension and functions in the contractile ring during cytokinesis37, 38. Several studies have suggested that an imbalance in cortical tension contributes to cytokinesis, with cortical loosening at the cell poles and enhanced tension at the cell equator leading to equatorial movement, assembly and contraction of the contractile ring39. In a related mechanism, anterior–posterior polarity in the one-cell nematode embryo is established by myosin II-mediated cortical contraction to move granules and fate determinants towards the future anterior pole40. It is possible that a related myosin II-dependent cortical tension may move TCR microclusters towards the center of the immunological synapse. This cortical tension appears to be required for TCR signalosome function even in the absence of a synapse based on results with soluble OKT3. Previously described particle size requirements for T cell stimulation may arise from the need for myosin IIA-mediated tension across an interface or cross-linked protein network41, 42. Myosin IIA-mediated cortical tension may be required for rearrangement of cytoskeletally associated protein islands into functional signalosomes43.
Activation of myosin II by phosphorylation of its MLCs can be mediated by several different kinases, including the calcium–calmodulin-dependent MLCK44, ROCK and protein kinase C (PKC)45. Shortly after stimulation of T cells, Vav1, a Rho guanine exchange factor (GEF), is recruited to TCR microclusters through interaction with the adaptor protein SLP-76, which is then followed by the recruitment of Cdc42 and ROCK46, 47. T cell stimulation also results in increased cytoplasmic Ca2+ known to activate MLCK44. We show that treatment with either the ROCK inhibitor, Y27632, or the MLCK inhibitor, ML-7, inhibited MLC phosphorylation following T cell stimulation. Thus both kinases take part in activation of myosin II even when TCR is triggered by OKT3. Since myosin IIA activity was necessary to maintain elevated Ca2+ concentrations, a plausible model is that Rho-GTP activated ROCK initially phosphorylates MLCs. Ca2+ concentrations then rise, which maintains light chain phosphorylation through persistent activation of MLCK. Thus, one crucial role of myosin IIA activity is to maintain signaling that then feeds back to maintain elevated Ca2+ and active myosin IIA.
As far as we are aware, this is the first report to implicate myosin II activity in signaling through an immunoreceptor. In examining the downstream signaling pathway, we found that phosphorylation of the Src family kinases was unimpaired by either inhibition or depletion of myosin IIA, whereas down stream signaling, including ZAP-70 and LAT phosphorylation, and cytosolic Ca2+ elevation, were much more dependent on myosin IIA activity. The truncation in signaling downstream of Lck was not due to defects in adhesion as inhibition of myosin IIA activity in Jurkat T cells stimulated with soluble OKT3 also resulted in a decrease in ZAP70 and LAT phosphorylation and a reduction in intracellular Ca2+ concentrations to baseline. Our data support a two-step model in which initial conjugate formation involving TCR microcluster formation, myosin IIA recruitment and Lck activation are all independent of myosin IIA activity, whereas amplification of signaling and microcluster movement are dependent on myosin IIA activity. Ours and earlier work argue for a careful tuning of myosin IIA activity during T cell activation with negative regulation through inhibition of thick filament formation6 and positive regulation through MLC phosphorylation leading to maintenance of cortical tension needed for TCR signaling and synapse stabilization.
Methods
Cells and antibodies
Jurkat T cells and Raji B cells were purchased from the ATCC. Human peripheral blood lymphocytes were isolated from citrate-anticoagulated whole blood by dextran sedimentation (BCA/hemerica) followed by density separation over Ficoll-Hypaque (Sigma). The resulting mononuclear cells were washed in PBS and further purified by nylon wool and plastic adherence as described48. Human peripheral CD4+ blasts were prepared as described49. Antibodies against ezrin and myosin II heavy chain have been described50. pMLC (S19), pSrc (Y416), used to measure pLck, the most abundant Src member in T cells, pZAP (Y319), pLAT (Y191), were affinity purified polyclonal antibodies obtained from Cell Signaling. OKT3 mouse anti-human CD3 was purified from an OKT3 hybridoma cell line. Rhodamine phalloidin, Alexa Flour 568 phalloidin, donkey anti-rabbit and donkey anti-mouse Alexa Flour 488, goat anti-rabbit and goat anti-mouse Alexa Flour 568 were obtained from Molecular Probes. Horse radish peroxidase (HRP)-conjugated goat anti-rabbit antibodies were obtained from MP Biomedical.
Immunofluorescence
Cells were plated onto poly-L-lysine coated glass slides, fixed for 30 min at 25°C with 3.7% formaldehyde followed by permeabilization in 0.1% Triton X-100 in PBS for 2 min and then rinsed 3 times in PBS. Cells were then incubated for 1 h with 5% BSA in PBS, followed by incubation with primary antibody in 5% BSA in PBS for 1 h washed in PBS and incubated with appropriate secondary antibody (or phalloidin) in 5% BSA in PBS for 1 h. Following additional washes, 5 μl of Vectashield (Vector Labs) was added to the cells and slides were covered with coverslips. Cells were observed on a Nikon Eclipse TE-2000U (100× 1.4 NA lens) using the Perkin Elmer UltraView LCI spinning disk confocal imaging system and a Hamamatsu 12-bit C4742-95digital CCD.
Immunoblotting
Jurkat and primary T cells were lysed and resolved by SDS-PAGE followed by transfer to PVDF membranes (Immobilon-P, Millipore) using a semi-dry transfer system (Integrated Separation Systems. After 1 h blocking in 5% dry milk in TBST membranes were incubated with primary antibody for 1 h, washed and incubated for 1 h with appropriate HRP-conjugated secondary antibody. Blots were developed using enhanced chemiluminescence (ECL, Amersham).
Cell stimulation and conjugate formation
Jurkat and primary human T cells were activated with OKT3 antibody (10 μg/ml) for the indicated times. For stimulation with B cells, Raji B cells were fluorescently labeled with cell tracker dye CMTPX (CellTracker, Molecular Probes) and loaded with SEE superantigen (2 μg/ml, Toxin Technology). An equal number of T cells was added to B cells.
Conjugate stability and DIC microscopy
Raji B cells were loaded with SEE superantigen and then immobilized in dishes containing coverslip inserts (MatTek Corp.) and observed on an Axiovert 100 TV microscope (Carl Zeiss), equipped with CCD (C4742-95-12ERG; Hamamatsu) using a DIC prism and Openlab 4.0 (Improvision Inc.,). Following initial B cell imaging, Jurkat T cells or primary human T cells were added to the plates and cells were allowed to form conjugates. Blebbistatin (50 μM) or ML7 (10 μM) or DMSO were added at indicated times and conjugated were continuously imaged. Movies were analyzed using ImageJ software.
Calcium assays
Non-ratiometric: Jurkat T cells and primary human T cells were loaded with 1 μM of Fluo-LOJO (TefLabs). Cells were then either added to SEE superantigen loaded Raji B cells and allowed to form synapses or stimulated with OKT3 antibody. Blebbistatin, ML7 or DMSO were added at indicated times and intensity of fluorescence was measured with the spinning disk confocal imaging system. Ratiometric: Jurkat T cells were loaded with 2.5 μM Fura-2AM (Molecular Probes) as described13.
Bilayer assembly and TIRF microscopy
Glass-supported DOPC bilayers incorporating 0.01% biotin-CAP PODC were prepared in flow cells (Bioptechs) as described5. The bilayers were loaded with monobiotinylated-564-OKT3 antibody. Cells were allowed to settle and form contact with bilayer prior to imaging. All bilayer imaging was performed on an Olympus inverted IX-70 microscope equipped with Hamamatsu 12 bit C9100 1.1B CCD and a TIRF objective from Olympus. Microclusters were analyzed using Volocity 4.2 (Improvision Inc.).
siRNA transfection
3 × 10⁶ CD4+ human T cell blasts at day 4 were electroporated using the AMAXA nucleofactor (Amaxa Inc.) according to manufacturer instructions. Two specific siRNA duplexes for human MYH9 gene or negative control were used (Dharmacon Inc.). Cells were cultured for 48 h and analyzed by immunoblotting or immunofluorescence. Suppression of target protein was verified by immunoblot.
Statistical analysis
Non-parametric t-tests were performed using Prism software.
Supplementary Material
Jurkat T cells (movies S1-S3, S7) or primary human CD4 cells (movies S4-S6) pre treated with DMSO (movies S1 and S4), blebbistatin (movies S2 and S5) or ML7 (movies S3 and S67) were added to planer a lipid bilayer containing Alexa-568 labeled OKT3 and ICAM1, and imaged during the initial min of synapse formation by TIRF microscopy. In movie S7 blebbistatin was added to the flow cell following initial contact and microcluster formation.
SEE superantigen loaded B cells were immobilized in dishes with coverslip inserts and ML7 pretreated Jurkat T cells were added and allowed to form immunological synapses. Cells were imaged using DIC microscopy. B cell is depicted in the first frame of the movie prior to T cells addition.
SEE superantigen loaded B cells were immobilized in dishes with coverslip inserts and primary human CD4 cells were added and allowed to form immunological synapses. Blebbistatin (movie S9) or ML7 (movie S10) were added 1-2 min after synapse formation and cells were imaged using DIC microscopy. T and B cells are depicted by T and B in the first frame of the movies, respectively.
Jurkat T cells were incubated with the cytoplasmic Ca2+ sensitive dye Fluo-LOJO and then mixed with SEE superantigen loaded B cells that were prestained with CMTPX (red), and allowed to form immunological synapses. Changes in Fluo-LOJO emission intensity were imaged following ML7 addition. The T cell is depicted in the movie while the B cell is depicted in figure S4.
Primary human CD4 cells were incubated with the cytoplasmic Ca2+ sensitive dye Fluo-LOJO and activated with OKT3. DMSO (movie S12), blebbistatin (movie S13) or ML7 (movie S14) were then added to stimulated cells and Fluo-LOJO emission intensity was imaged.
Figure S1: A dot plot representation of microclusters velocity in control, blebbistatin treated and siRNA treated cell shown in figure 1a, b. The average velocity and p-values of each cell group are depicted.
Figure S2: (a). Primary human CD4 cells were stimulated for one minute with OKT3 and then fixed and stained for TCR, myosin HC and pMLC. Scale bar: 5 μm. (b). Primary human CD4 cells were treated with blebbistatin for 10 min then incubated with SEE superantigen loaded B cells that were prestained with CMTPX (red). Cells were fixed and stained for TCR, F-actin or myosin-II HC (green). Scale bar: 5 μm. (c). Immunoblot analysis of phosphorylated MLC (pMLC) and total MLC (MLC) in primary human CD4 cells lysates following activation with OKT3. (d). Primary human CD4 cells were stimulated for one and 5 min with Alexa-Fluor 488 anti-CD3 antibody, cells in bottom row were pretreated with blebbistatin for 10 min and then stimulated with OKT3 for 5 min. Two representative cells are depicted for each time point. Scale bars: 5μm. (e). Western blot analysis of phosphorylation levels of Src kinases, LAT and ZAP70 in control primary human CD4 cells or cells treated with OKT3 for two min without, or with, blebbistatin pretreatment. Actin levels are shown as a loading control. (f). Quantitative representation of E, calculated from 3 independent experiments.
Figure S3: Jurkat T cells were pretreated for 10 min with DMSO, 50μM blebbistatin, 10μM Y27632 or 10μM ML-7, and then stimulated with OKT3 for 5 min. A representative immunoblot analysis from three independent experiments with antibodies to phosphorylated myosin light chain (pMLC) or total light chain (MLC) is shown.
Figure S4: Jurkat T cells were treated for 10 min with 10μM ML7 or 10μM Y27632 and then incubated with SEE superantigen loaded B cells that were prestained with CMTPX (red dye). Cells were fixed and stained for F-actin and myosin II heavy chain (green). Scale bars: 5μm.
Figure S5: Control or blebbistatin pretreated Jurkat T cells were added to a planer lipid bilayer containing Alexa-568 labeled TCR antibody and Cy5 labeled ICAM1 and imaged over time for 30 min. One representative time point is depicted. Scale bars: 5μm.
Figure S6: (a). Jurkat T cells were incubated with the cytoplasmic Ca2+-sensitive dye Fluo-LOJO with or without blebbistatin (50μM). Cells were then imaged every 30 s for 5 min and emission intensity was quantified (P=0.0723). Error bars indicate standard deviation. (b). Changes in intensity over time of Ca2+ sensitive dye in three representative T and B cell conjugates from three independent experiments. Jurkat T cells were incubated with the cytoplasmic Ca2+ sensitive dye Fluo-LOJO and then mixed with SEE superantigen loaded B cells. Cells were imaged upon contact formation between T and B cells and the resulting rise in Ca2+ levels are depicted. Following conjugate formation, with the typical high Ca2+ levels, blebbistatin was added as indicated by an arrow and the resulting reduction in Ca2+ which eventually leads to conjugate separation is depicted. 100% intensity on the y-axis is the maximal signal obtained for each cell following conjugate formation. This sequence of superantigen dependent rise and blebbistatin-induced fall in Ca2+ was observed in 7 of 7 experiments in which imaging of conjugates was initiated early enough to observe the rising phase. We observed an additional 21 conjugates in which the fluorescence intensity was at a plateau level at the beginning of the observation (as in Fig 5a,b); in 20 of these conjugates blebbistatin addition induced a decrease in indicator fluorescence of at least 20% over a period of 120 s.
Figure S7: CMTPX preloaded B cells are depicted in order to distinguish them from T-cells in movie S11.
Figure S8: (a). Jurkat T cells were incubated with the cytoplasmic Ca2+-sensitive dye Fluo-LOJO and then stimulated with various concentrations of TCR antibody. The Fluo-LOJO emission intensity was imaged at the indicated times in control cells (top row) or cells treated with 50μM blebbistatin at time 0. Scale bars: 5μm. (b). Quantitative representation of a, each point represents the average of three experiments. (c). Jurkat T cells were incubated with the cytoplasmic calcium sensitive dye Fluo-LOJO. Control and blebbistatin pretreated cells were stimulated with TCR antibody and imaged. Panels show images one minute after antibody addition; similar results were obtained in 29 of 30 control cells and 26 of 30 blebbistatin treated cells. Scale bars: 5μm.
Acknowledgments
We would like to thank Damien Garbett for his help with data analysis using Volocity, and for his helpful comments and Dr. David W. Pruyne for his help in setting DIC microscopy. TI was supported in part by a long-term EMBO Fellowship. This work was supported by an NIH grants GM36652 (to AB), AI44931 (to MLD) and Nanomedicine Development Center EY16586 (to MLD).
References
- 1.Davis MM. The alphabeta T cell repertoire comes into focus. Immunity. 2007;27:179–80. doi: 10.1016/j.immuni.2007.08.005. [DOI] [PubMed] [Google Scholar]
- 2.DeMond AL, Mossman KD, Starr T, Dustin ML, Groves JT. T cell receptor microcluster transport through molecular mazes reveals mechanism of translocation. Biophys J. 2008;94:3286–92. doi: 10.1529/biophysj.107.119099. [DOI] [PMC free article] [PubMed] [Google Scholar]
- 3.Monks CR, Freiberg BA, Kupfer H, Sciaky N, Kupfer A. Three-dimensional segregation of supramolecular activation clusters in T cells. Nature. 1998;395:82–6. doi: 10.1038/25764. [DOI] [PubMed] [Google Scholar]
- 4.Dustin ML, et al. A novel adaptor protein orchestrates receptor patterning and cytoskeletal polarity in T-cell contacts. Cell. 1998;94:667–77. doi: 10.1016/s0092-8674(00)81608-6. [DOI] [PubMed] [Google Scholar]
- 5.Grakoui A, et al. The immunological synapse: a molecular machine controlling T cell activation. Science. 1999;285:221–7. doi: 10.1126/science.285.5425.221. [DOI] [PubMed] [Google Scholar]
- 6.Jacobelli J, Chmura SA, Buxton DB, Davis MM, Krummel MF. A single class II myosin modulates T cell motility and stopping, but not synapse formation. Nat Immunol. 2004;5:531–8. doi: 10.1038/ni1065. [DOI] [PubMed] [Google Scholar]
- 7.Combs J, et al. Recruitment of dynein to the Jurkat immunological synapse. Proc Natl Acad Sci U S A. 2006;103:14883–8. doi: 10.1073/pnas.0600914103. [DOI] [PMC free article] [PubMed] [Google Scholar]
- 8.Bunnell SC, et al. T cell receptor ligation induces the formation of dynamically regulated signaling assemblies. J Cell Biol. 2002;158:1263–75. doi: 10.1083/jcb.200203043. [DOI] [PMC free article] [PubMed] [Google Scholar]
- 9.Campi G, Varma R, Dustin ML. Actin and agonist MHC-peptide complex-dependent T cell receptor microclusters as scaffolds for signaling. J Exp Med. 2005;202:1031–6. doi: 10.1084/jem.20051182. [DOI] [PMC free article] [PubMed] [Google Scholar]
- 10.Huse M, et al. Spatial and temporal dynamics of T cell receptor signaling with a photoactivatable agonist. Immunity. 2007;27:76–88. doi: 10.1016/j.immuni.2007.05.017. [DOI] [PubMed] [Google Scholar]
- 11.Yokosuka T, et al. Newly generated T cell receptor microclusters initiate and sustain T cell activation by recruitment of Zap70 and SLP-76. Nat Immunol. 2005;6:1253–62. doi: 10.1038/ni1272. [DOI] [PubMed] [Google Scholar]
- 12.Douglass AD, Vale RD. Single-molecule microscopy reveals plasma membrane microdomains created by protein-protein networks that exclude or trap signaling molecules in T cells. Cell. 2005;121:937–50. doi: 10.1016/j.cell.2005.04.009. [DOI] [PMC free article] [PubMed] [Google Scholar]
- 13.Varma R, Campi G, Yokosuka T, Saito T, Dustin ML. T cell receptor-proximal signals are sustained in peripheral microclusters and terminated in the central supramolecular activation cluster. Immunity. 2006;25:117–27. doi: 10.1016/j.immuni.2006.04.010. [DOI] [PMC free article] [PubMed] [Google Scholar]
- 14.Lee KH, et al. The immunological synapse balances T cell receptor signaling and degradation. Science. 2003;302:1218–22. doi: 10.1126/science.1086507. [DOI] [PubMed] [Google Scholar]
- 15.Dustin ML, Cooper JA. The immunological synapse and the actin cytoskeleton: molecular hardware for T cell signaling. Nat Immunol. 2000;1:23–9. doi: 10.1038/76877. [DOI] [PubMed] [Google Scholar]
- 16.Chakraborty AK. How and why does the immunological synapse form? Physical chemistry meets cell biology. Sci STKE 2002, PE10. 2002 doi: 10.1126/stke.2002.122.pe10. [DOI] [PubMed] [Google Scholar]
- 17.Kaizuka Y, Douglass AD, Varma R, Dustin ML, Vale RD. Mechanisms for segregating T cell receptor and adhesion molecules during immunological synapse formation in Jurkat T cells. Proc Natl Acad Sci U S A. 2007;104:20296–301. doi: 10.1073/pnas.0710258105. [DOI] [PMC free article] [PubMed] [Google Scholar]
- 18.Lin CH, Espreafico EM, Mooseker MS, Forscher P. Myosin drives retrograde F-actin flow in neuronal growth cones. Neuron. 1996;16:769–82. doi: 10.1016/s0896-6273(00)80097-5. [DOI] [PubMed] [Google Scholar]
- 19.Conti MA, Adelstein RS. Nonmuscle myosin II moves in new directions. J Cell Sci. 2008;121:11–8. doi: 10.1242/jcs.007112. [DOI] [PubMed] [Google Scholar]
- 20.Tan JL, Ravid S, Spudich JA. Control of nonmuscle myosins by phosphorylation. Annu Rev Biochem. 1992;61:721–59. doi: 10.1146/annurev.bi.61.070192.003445. [DOI] [PubMed] [Google Scholar]
- 21.Simons M, et al. Human nonmuscle myosin heavy chains are encoded by two genes located on different chromosomes. Circ Res. 1991;69:530–9. doi: 10.1161/01.res.69.2.530. [DOI] [PubMed] [Google Scholar]
- 22.Golomb E, et al. Identification and characterization of nonmuscle myosin II-C, a new member of the myosin II family. J Biol Chem. 2004;279:2800–8. doi: 10.1074/jbc.M309981200. [DOI] [PubMed] [Google Scholar]
- 23.Maupin P, Phillips CL, Adelstein RS, Pollard TD. Differential localization of myosin-II isozymes in human cultured cells and blood cells. J Cell Sci. 1994;107(Pt 11):3077–90. doi: 10.1242/jcs.107.11.3077. [DOI] [PubMed] [Google Scholar]
- 24.Wulfing C, Davis MM. A receptor/cytoskeletal movement triggered by costimulation during T cell activation. Science. 1998;282:2266–9. doi: 10.1126/science.282.5397.2266. [DOI] [PubMed] [Google Scholar]
- 25.Straight AF, et al. Dissecting temporal and spatial control of cytokinesis with a myosin II Inhibitor. Science. 2003;299:1743–7. doi: 10.1126/science.1081412. [DOI] [PubMed] [Google Scholar]
- 26.Blanchard N, et al. Strong and durable TCR clustering at the T/dendritic cell immune synapse is not required for NFAT activation and IFN-gamma production in human CD4+ T cells. J Immunol. 2004;173:3062–72. doi: 10.4049/jimmunol.173.5.3062. [DOI] [PubMed] [Google Scholar]
- 27.Ilani T, Khanna C, Zhou M, Veenstra TD, Bretscher A. Immune synapse formation requires ZAP-70 recruitment by ezrin and CD43 removal by moesin. J Cell Biol. 2007;179:733–46. doi: 10.1083/jcb.200707199. [DOI] [PMC free article] [PubMed] [Google Scholar]
- 28.Weiss A, Imboden J, Shoback D, Stobo J. Role of T3 surface molecules in human T-cell activation: T3-dependent activation results in an increase in cytoplasmic free calcium. Proc Natl Acad Sci U S A. 1984;81:4169–73. doi: 10.1073/pnas.81.13.4169. [DOI] [PMC free article] [PubMed] [Google Scholar]
- 29.Valitutti S, Muller S, Cella M, Padovan E, Lanzavecchia A. Serial triggering of many T-cell receptors by a few peptide-MHC complexes. Nature. 1995;375:148–51. doi: 10.1038/375148a0. [DOI] [PubMed] [Google Scholar]
- 30.Krogsgaard M, et al. Agonist/endogenous peptide-MHC heterodimers drive T cell activation and sensitivity. Nature. 2005;434:238–43. doi: 10.1038/nature03391. [DOI] [PubMed] [Google Scholar]
- 31.Janeway CA, Jr, Bottomly K. Responses of T cells to ligands for the T-cell receptor. Semin Immunol. 1996;8:108–115. doi: 10.1006/smim.1996.0013. [DOI] [PubMed] [Google Scholar]
- 32.Sims TN, et al. Opposing effects of PKCtheta and WASp on symmetry breaking and relocation of the immunological synapse. Cell. 2007;129:773–85. doi: 10.1016/j.cell.2007.03.037. [DOI] [PubMed] [Google Scholar]
- 33.Barda-Saad M, et al. Dynamic molecular interactions linking the T cell antigen receptor to the actin cytoskeleton. Nat Immunol. 2005;6:80–9. doi: 10.1038/ni1143. [DOI] [PubMed] [Google Scholar]
- 34.Dustin ML, Springer TA. T-cell receptor cross-linking transiently stimulates adhesiveness through LFA-1. Nature. 1989;341:619–24. doi: 10.1038/341619a0. [DOI] [PubMed] [Google Scholar]
- 35.Fleire SJ, et al. B cell ligand discrimination through a spreading and contraction response. Science. 2006;312:738–41. doi: 10.1126/science.1123940. [DOI] [PubMed] [Google Scholar]
- 36.Giannone G, et al. Lamellipodial actin mechanically links myosin activity with adhesion-site formation. Cell. 2007;128:561–75. doi: 10.1016/j.cell.2006.12.039. [DOI] [PMC free article] [PubMed] [Google Scholar]
- 37.Pasternak C, Spudich JA, Elson EL. Capping of surface receptors and concomitant cortical tension are generated by conventional myosin. Nature. 1989;341:549–51. doi: 10.1038/341549a0. [DOI] [PubMed] [Google Scholar]
- 38.Mabuchi I, Okuno M. The effect of myosin antibody on the division of starfish blastomeres. J Cell Biol. 1977;74:251–63. doi: 10.1083/jcb.74.1.251. [DOI] [PMC free article] [PubMed] [Google Scholar]
- 39.Matsumura F. Regulation of myosin II during cytokinesis in higher eukaryotes. Trends Cell Biol. 2005;15:371–7. doi: 10.1016/j.tcb.2005.05.004. [DOI] [PubMed] [Google Scholar]
- 40.Munro E, Nance J, Priess JR. Cortical flows powered by asymmetrical contraction transport PAR proteins to establish and maintain anterior-posterior polarity in the early C. elegans embryo. Dev Cell. 2004;7:413–24. doi: 10.1016/j.devcel.2004.08.001. [DOI] [PubMed] [Google Scholar]
- 41.Mescher MF. Surface contact requirements for activation of cytotoxic T lymphocytes. J Immunol. 1992;149:2402–5. [PubMed] [Google Scholar]
- 42.Galbraith CG, Yamada KM, Sheetz MP. The relationship between force and focal complex development. J Cell Biol. 2002;159:695–705. doi: 10.1083/jcb.200204153. [DOI] [PMC free article] [PubMed] [Google Scholar]
- 43.Lillemeier BF, Pfeiffer JR, Surviladze Z, Wilson BS, Davis MM. Plasma membrane-associated proteins are clustered into islands attached to the cytoskeleton. Proc Natl Acad Sci U S A. 2006;103:18992–7. doi: 10.1073/pnas.0609009103. [DOI] [PMC free article] [PubMed] [Google Scholar]
- 44.Gallagher PJ, Herring BP, Griffin SA, Stull JT. Molecular characterization of a mammalian smooth muscle myosin light chain kinase. J Biol Chem. 1991;266:23936–44. [PMC free article] [PubMed] [Google Scholar]
- 45.Ludowyke RI, Peleg I, Beaven MA, Adelstein RS. Antigen-induced secretion of histamine and the phosphorylation of myosin by protein kinase C in rat basophilic leukemia cells. J Biol Chem. 1989;264:12492–501. [PubMed] [Google Scholar]
- 46.Koretzky GA, Abtahian F, Silverman MA. SLP76 and SLP65: complex regulation of signalling in lymphocytes and beyond. Nat Rev Immunol. 2006;6:67–78. doi: 10.1038/nri1750. [DOI] [PubMed] [Google Scholar]
- 47.Zeng R, et al. SLP-76 coordinates Nck-dependent Wiskott-Aldrich syndrome protein recruitment with Vav-1/Cdc42-dependent Wiskott-Aldrich syndrome protein activation at the T cell-APC contact site. J Immunol. 2003;171:1360–8. doi: 10.4049/jimmunol.171.3.1360. [DOI] [PubMed] [Google Scholar]
- 48.Dustin ML, Springer TA. Lymphocyte function-associated antigen-1 (LFA-1) interaction with intercellular adhesion molecule-1 (ICAM-1) is one of at least three mechanisms for lymphocyte adhesion to cultured endothelial cells. J Cell Biol. 1988;107:321–31. doi: 10.1083/jcb.107.1.321. [DOI] [PMC free article] [PubMed] [Google Scholar]
- 49.Vasiliver-Shamis G, et al. HIV-1 envelope gp120 induces a stop signal and virological synapse formation in non-infected CD4+ T cells. J Virol. 2008 doi: 10.1128/JVI.00835-08. [DOI] [PMC free article] [PubMed] [Google Scholar]
- 50.Bretscher A. Rapid phosphorylation and reorganization of ezrin and spectrin accompany morphological changes induced in A-431 cells by epidermal growth factor. J Cell Biol. 1989;108:921–30. doi: 10.1083/jcb.108.3.921. [DOI] [PMC free article] [PubMed] [Google Scholar]
Associated Data
This section collects any data citations, data availability statements, or supplementary materials included in this article.
Supplementary Materials
Jurkat T cells (movies S1-S3, S7) or primary human CD4 cells (movies S4-S6) pre treated with DMSO (movies S1 and S4), blebbistatin (movies S2 and S5) or ML7 (movies S3 and S67) were added to planer a lipid bilayer containing Alexa-568 labeled OKT3 and ICAM1, and imaged during the initial min of synapse formation by TIRF microscopy. In movie S7 blebbistatin was added to the flow cell following initial contact and microcluster formation.
SEE superantigen loaded B cells were immobilized in dishes with coverslip inserts and ML7 pretreated Jurkat T cells were added and allowed to form immunological synapses. Cells were imaged using DIC microscopy. B cell is depicted in the first frame of the movie prior to T cells addition.
SEE superantigen loaded B cells were immobilized in dishes with coverslip inserts and primary human CD4 cells were added and allowed to form immunological synapses. Blebbistatin (movie S9) or ML7 (movie S10) were added 1-2 min after synapse formation and cells were imaged using DIC microscopy. T and B cells are depicted by T and B in the first frame of the movies, respectively.
Jurkat T cells were incubated with the cytoplasmic Ca2+ sensitive dye Fluo-LOJO and then mixed with SEE superantigen loaded B cells that were prestained with CMTPX (red), and allowed to form immunological synapses. Changes in Fluo-LOJO emission intensity were imaged following ML7 addition. The T cell is depicted in the movie while the B cell is depicted in figure S4.
Primary human CD4 cells were incubated with the cytoplasmic Ca2+ sensitive dye Fluo-LOJO and activated with OKT3. DMSO (movie S12), blebbistatin (movie S13) or ML7 (movie S14) were then added to stimulated cells and Fluo-LOJO emission intensity was imaged.
Figure S1: A dot plot representation of microclusters velocity in control, blebbistatin treated and siRNA treated cell shown in figure 1a, b. The average velocity and p-values of each cell group are depicted.
Figure S2: (a). Primary human CD4 cells were stimulated for one minute with OKT3 and then fixed and stained for TCR, myosin HC and pMLC. Scale bar: 5 μm. (b). Primary human CD4 cells were treated with blebbistatin for 10 min then incubated with SEE superantigen loaded B cells that were prestained with CMTPX (red). Cells were fixed and stained for TCR, F-actin or myosin-II HC (green). Scale bar: 5 μm. (c). Immunoblot analysis of phosphorylated MLC (pMLC) and total MLC (MLC) in primary human CD4 cells lysates following activation with OKT3. (d). Primary human CD4 cells were stimulated for one and 5 min with Alexa-Fluor 488 anti-CD3 antibody, cells in bottom row were pretreated with blebbistatin for 10 min and then stimulated with OKT3 for 5 min. Two representative cells are depicted for each time point. Scale bars: 5μm. (e). Western blot analysis of phosphorylation levels of Src kinases, LAT and ZAP70 in control primary human CD4 cells or cells treated with OKT3 for two min without, or with, blebbistatin pretreatment. Actin levels are shown as a loading control. (f). Quantitative representation of E, calculated from 3 independent experiments.
Figure S3: Jurkat T cells were pretreated for 10 min with DMSO, 50μM blebbistatin, 10μM Y27632 or 10μM ML-7, and then stimulated with OKT3 for 5 min. A representative immunoblot analysis from three independent experiments with antibodies to phosphorylated myosin light chain (pMLC) or total light chain (MLC) is shown.
Figure S4: Jurkat T cells were treated for 10 min with 10μM ML7 or 10μM Y27632 and then incubated with SEE superantigen loaded B cells that were prestained with CMTPX (red dye). Cells were fixed and stained for F-actin and myosin II heavy chain (green). Scale bars: 5μm.
Figure S5: Control or blebbistatin pretreated Jurkat T cells were added to a planer lipid bilayer containing Alexa-568 labeled TCR antibody and Cy5 labeled ICAM1 and imaged over time for 30 min. One representative time point is depicted. Scale bars: 5μm.
Figure S6: (a). Jurkat T cells were incubated with the cytoplasmic Ca2+-sensitive dye Fluo-LOJO with or without blebbistatin (50μM). Cells were then imaged every 30 s for 5 min and emission intensity was quantified (P=0.0723). Error bars indicate standard deviation. (b). Changes in intensity over time of Ca2+ sensitive dye in three representative T and B cell conjugates from three independent experiments. Jurkat T cells were incubated with the cytoplasmic Ca2+ sensitive dye Fluo-LOJO and then mixed with SEE superantigen loaded B cells. Cells were imaged upon contact formation between T and B cells and the resulting rise in Ca2+ levels are depicted. Following conjugate formation, with the typical high Ca2+ levels, blebbistatin was added as indicated by an arrow and the resulting reduction in Ca2+ which eventually leads to conjugate separation is depicted. 100% intensity on the y-axis is the maximal signal obtained for each cell following conjugate formation. This sequence of superantigen dependent rise and blebbistatin-induced fall in Ca2+ was observed in 7 of 7 experiments in which imaging of conjugates was initiated early enough to observe the rising phase. We observed an additional 21 conjugates in which the fluorescence intensity was at a plateau level at the beginning of the observation (as in Fig 5a,b); in 20 of these conjugates blebbistatin addition induced a decrease in indicator fluorescence of at least 20% over a period of 120 s.
Figure S7: CMTPX preloaded B cells are depicted in order to distinguish them from T-cells in movie S11.
Figure S8: (a). Jurkat T cells were incubated with the cytoplasmic Ca2+-sensitive dye Fluo-LOJO and then stimulated with various concentrations of TCR antibody. The Fluo-LOJO emission intensity was imaged at the indicated times in control cells (top row) or cells treated with 50μM blebbistatin at time 0. Scale bars: 5μm. (b). Quantitative representation of a, each point represents the average of three experiments. (c). Jurkat T cells were incubated with the cytoplasmic calcium sensitive dye Fluo-LOJO. Control and blebbistatin pretreated cells were stimulated with TCR antibody and imaged. Panels show images one minute after antibody addition; similar results were obtained in 29 of 30 control cells and 26 of 30 blebbistatin treated cells. Scale bars: 5μm.