Abstract
Functional magnetic resonance imaging (fMRI) has become the leading modality for studying the working brain. Being based on measuring the haemodynamic changes after enhanced mass neuronal activity the spatiotemporal resolution of the method is somewhat limited. Alternative MR-based methods for detection of brain activity have been proposed and investigated and studies have reported functional imaging based on diffusion weighted (DW) MRI. The basis for such DW fMRI is believed to be the sensitivity of diffusion weighted MRI to changes in tissue micro-structure. However, it remains unclear whether signal changes observed with these methods reflect cell swelling related to neural activation, residual vascular effects, or a combination of both. Here we present evidence of a detectable activity related change in the diffusion weighted MR-signal from the cellular level in live hippocampal slices in the absence of vasculature. Slices are exposed to several substances and the effects evaluated and compared. The results are also compared to earlier DW fMRI studies in humans.
Keywords: fMRI, DWI, Hippocampus, Brain Slice, Kainic acid, CNQX, MK-801
Introduction
Functional imaging of the central nervous system is of great significance in the neurological sciences because of its potential to reveal how intricate physiological processes occurring at the cellular level contribute to the vast array of neurological functions in humans. Understanding how these mechanisms underpin higher-order brain function would offer new insight into well-studied yet poorly understood phenomenon such as the activity-based changes that accompany memory formation and recall or functional deficits that manifest as disease-specific symptomology. Perhaps most importantly, functional imaging offers a means of examining brain activity that is global in its scope as well as non-invasive: both of which are necessary to reveal the complex distribution of activity that is the hallmark of a functioning brain.
In recent years, multiple imaging modalities have been employed in an effort to provide functional data about the inner workings of the human brain. Most notably, magnetoencephalography (MEG) and blood oxygenation level dependent (BOLD) functional magnetic resonance imaging (fMRI) have made significant progress in this area, but both techniques possess unfavorable characteristics. MEG is limited to fields generated by cortical tissue and has limited spatial resolution. While fMRI exhibits better spatial resolution than MEG, this technique, like all haemodynamic-based modalities, measures a surrogate signal (changes in blood oxygenation level rather than actual neuronal activity) whose spatial specificity and temporal response are subject to both physical and biological constraints (Logothetis, 2008). Also, studies indicate that the nonlinear coupling between cerebral blood-flow and metabolism which is the main source of the BOLD fMRI signal is not a single non-linear relationship but may vary between brain regions or even be subject to some central command capable of introducing a spatial dissociation among changes in blood flow and oxygen metabolism (Vafaee and Gjedde, 2004). Thus, BOLD fMRI relies on a complex coupling between neural activity, cerebral metabolism and blood-flow and this, along with the shortcoming that the surrogate signal reflects neuronal mass activity, makes unambiguous data interpretation difficult in some cases. Although the limits of MEG and fMRI as means of measuring neural function are far from being realized, the respective spatial and temporal limitations inherent to these techniques will eventually interfere with their ability to accurately describe neural function. It is expected that our understanding of brain function will greatly benefit from the development and application of complementary methods for studying brain function.
Several studies have reported transient changes in neuronal morphology in tight connection with neuronal activity e.g. (Cohen et al., 1996; Iwasa et al., 1980; Kim et al., 2007). Such transient changes in tissue microstructure should in principle be detectable with diffusion weighted (DW) MRI. This would provide a non-invasive method for precise localization of neuronal activity based on a direct coupling between neuronal activity and tissue microstructure. Diffusion-based imaging of the working brain has been reported (Darquie et al., 2001; Le Bihan et al., 2006); however, it remains unclear whether signal changes observed with these methods reflect cell swelling related to neural activation (Le Bihan et al., 2006), residual vascular effects (Jin et al., 2006; Miller et al., 2007; Jin and Kim, 2008), or some combination of both.
The present study describes how activity-induced morphological changes occurring at the cellular level can be detected using diffusion-sensitive MRI and discusses how the described changes relate to neural function and functional imaging. The investigations are carried out in the live hippocampal brain slice model which ensures that diffusion-based functional MR measurements take place in a system devoid of vasculature’s potential corrupting influence. Moreover, the absence of a functioning blood-brain barrier allows for the introduction of chemical compounds at known concentrations directly into the extracellular space (Collingridge, 1995). Our initial experiments document stability of the slice model in our experimental setup. The following experiments compare DW MR signal from slices in the resting state to that obtained from the same slices following exposure to potassium or kainate. These substances are used as a means to induce cellular activity in the hippocampal slice. In the case of kainate, we demonstrate signal change to be dependent on cellular response to kainate alone: no signal change is seen upon inhibition of kainate activity by pretreatment with CNQX (6-cyano-7-nitroquinoxaline-2,3-dione). We also present activation patterns obtained with kainate when slices have been pretreated with the non-competitive NMDA receptor antagonist MK-801. Different patterns of signal change are seen between the experiments employing kainate and those using potassium.
Materials and methods
Tissue Preparation
All procedures involving live animals were approved by the University of Florida IACUC and adhered to the guidelines set forth in the National Academies of Sciences’ Guide for the Care and Use of Laboratory Animals. Male Sprauge Dawley rats (150g) were anesthetized by inhalation of isoflurane gas. Prior to euthanasia, all animal subjects were tested for the absence of toe-pinch, righting, and ocular reflexes to insure they were unconscious and insensitive to pain. Animals were decapitated immediately following reflex testing. Following decapitation, brains were grossly dissected, immersed into ice-cold, oxygenated artificial cerebrospinal fluid (ACSF) (120mM NaCl, 26mM NaHCO3, 1.5mM KH2PO4, 1.4mM MgSO4·7H2O, 2mM CaCl2·2H2O, 3mM KCl, 10mM Glucose; osmolality = 300mOsm, pH 7.4) and cut into 500μm-thick sections using a Lancer vibratome (Ted Pella, series 1000). Live slices were then transferred to a 10mm NMR tube containing a multi-slice perfusion apparatus as described previously (Shepherd et al., 2002). Briefly, hippocampal slices were placed in pairs between adjacent inserts arranged in a stack (2–3 layers). Circular inserts consisted of nylon mesh interiors to support tissue while allowing for the flow of perfusate-affixed to the bottom of Delrin rings (0.6–0.7 mm thick) to accommodate the depth of each tissue slice. Perfusion with ACSF was carried out in all experiments at a rate of 2ml/min. Outflow lines were positioned in the NMR tube as to allow for a close proximity between tissue slices and the air interface (approx. 4–6 mm).
MRI Experiments
Diffusion-weighted images (δ = 6.0ms, Δ = 13.4ms, TR = 2000ms, TE = 28ms, in-plane resolution 1562 μm2, b-values = 37, 600, 1200, 1800, 2400 s/mm2) were acquired using a diffusion-weighted, spin-echo sequence on a vertical-bore, 600MHz (14.1T) Bruker MRI system. In each experiment, images were replicated three times as well as staggered in their overall order to test for system and tissue stability respectively. Once placed inside the magnet, tissue slices were perfused with untreated, oxygenated ACSF (30min) and then imaged (30min) with the perfusion paused to eliminate flow artifacts. This set of images established a baseline for each experiment that all subsequent images were compared to. After the first imaging session, slices were again perfused with oxygenated ACSF solution (15 min) followed by an additional perfusion (30min) of oxygenated ACSF alone (to test model stability) or ACSF containing a compound intended to evoke neural activity (27mM KCl or 10μM kainate). Osmolality of the ACSF solutions was maintained at physiological levels by removal of equimolar amounts of NaCl. The ACSF containing these compounds was introduced into the perfusate stream by means of a bubble trap device that served the dual purpose of preventing air bubbles from entering the NMR tube and ensuring minimal dilution of the treated ACSF containing KCl or kainate. Lastly, perfusion was interrupted before running the imaging protocol (30 min) a second time. In experiments that employed chemical inhibition, the inhibitor (10μM MK-801 or 10μM CNQX) was present in the ACSF used as perfusate as well as the ACSF used as tissue cutting medium as previous studies have shown increased efficacy with pretreatment (Wang et al., 2006). The spectrometer was maintained in identical states for the stability, activity, and inhibition experiments performed in the study. Bore temperature was locked at the ambient temperature (23°C) prior to initiating data collection and both gradient and sample temperature were monitored to ensure consistency throughout each experiment.
Data Analysis
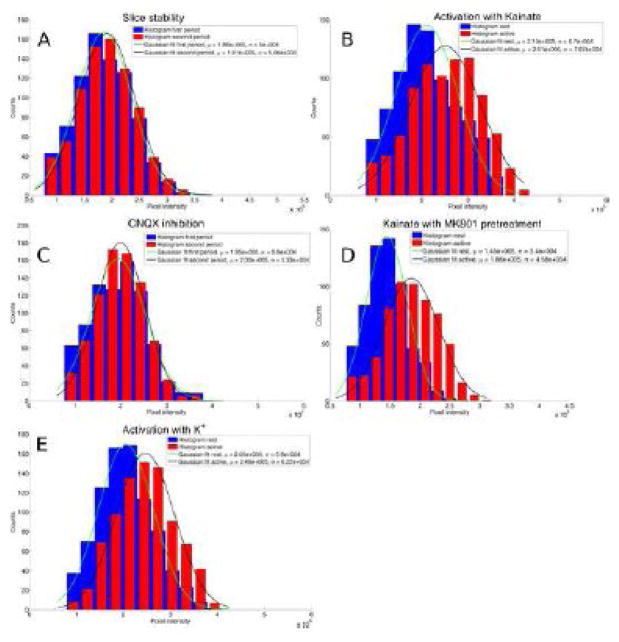
MR images collected with Paravision software (Bruker, PV3.02) were reconstructed to 32 bit floating point and processed using the analysis package ImageJ developed by the National Institutes of Health. First, datasets were coregistered spatially by aligning the images from resting state and active state using a rigid body transformation. This was done to minimize the influence of slice movement during the experiments due to gradient motion, flow or changes in slice morphology. The coregistration ensured appropriate pixel-wise comparisons between images and, judging by the small magnitude of adjustment (sub pixel), indicated stability of our perfusion system. From here, images were exported to MatLab (The MathWorks Inc., v. R2007a) where a pixel by pixel analysis was carried out. Significance maps were generated using ANOVA by comparing pixels (i,j) from baseline images taken at a particular b-value with their co-registered pixels from images taken following treatment at the same b-value. Thus, each map presented is composed of color-coded pixels that convey the magnitude of statistically significant differences (1-p) within pre- and post-treatment tissue slices. All statistical analysis was performed on MRI datasets that employed no filtering or apodization. However, in calculating the activation maps a threshold was introduced so that only pixels containing a raw signal above that threshold were analyzed. Therefore, pixels in the background noise and in perfusate at high b-values where very little signal remains were omitted in the calculation of the activation maps. All tissue pixels were above this threshold for all b-values. Differences seen in the statistical analysis were considered significant at p<0.05. All activation maps presented were calculated from the b = 2400 s/mm2 images. The activation maps calculated from the b = 1800 s/mm2 show similar patterns of activation in all experiments (Supplemental online material). Furthermore, histogram analysis comparing the pixel intensity distribution between resting and active state in representative images from all experiments are given at the end of the paper (Figure 10).
Figure 10.
Summary figure showing the observed effect in each experiment. The histograms show the distribution of pixel intensities across all of the tissue in an image for each state (rest/active). A marked shift in mean value (μ) and standard deviation (σ) is seen in all studies involving activation but not in the stability test (A) or the experiment with CNQX inhibition (C). Resting state tissue was used as mask for the analysis. This ensures the same total number of counts in each state. Data from the two states are binned identically in each plot. All the data shown in these histograms have been found to be normally distributed. A) Slice stability test. B) Activation with kainate. C) Kainate with CNQX inhibition. D) Kainate with MK-801 pre-treatment. E) Activation with K+.
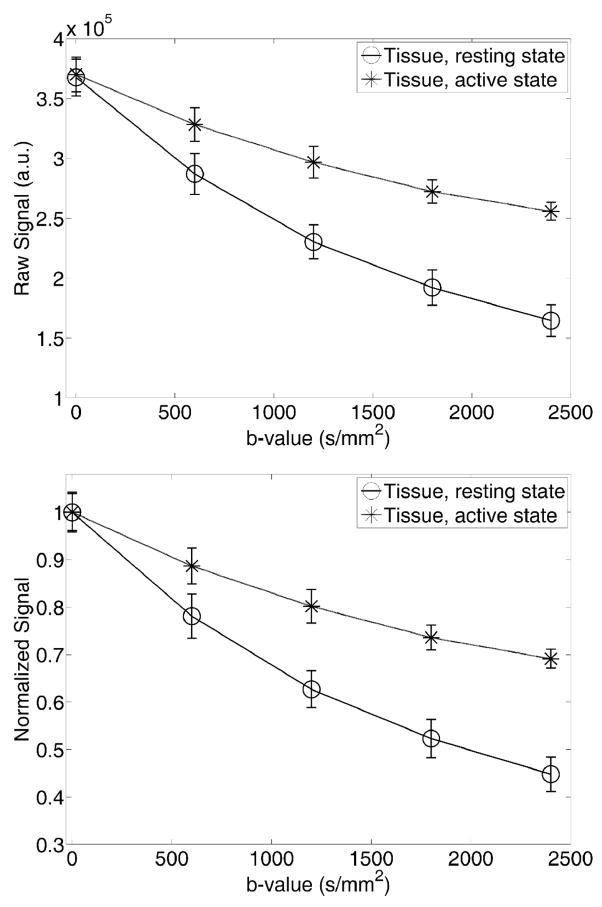
Line graphs show data from regions of interest (ROIs) taken from raw magnitude images. All ROIs were hand drawn in perfusate and tissue and are independent of the activation maps except for one case (Figure 8) where the ROI was placed to investigate raw signal behaviour in a tissue area showing significant change between resting and active state in the activation map. The pyramidal cell layer in the CA1 region of the hippocampus consists of densely packed nerve cell bodies with axons and dendridic arbors that extend into the stratum oriens and stratum radiatum located dorsally and ventrally to the cell layer respectively. This tissue region would be expected to produce a detectable change in the DW MRI signal in response to activation. Therefore, ROIs containing the pyramidal cell layer and adjacent tissues were chosen for the analyses of experiments where tissue is exposed to substances known to induce activation. As a tool for quantitative analysis of the changes in diffusion properties in the tissue, we employ a biexponential fit to data from our experiments using MK-801 in combination with kainate. This also allows for comparison to similar analysis from earlier studies. The biexponential fit summarizes the normalized diffusion weighted MR signal thus:
| Eq. (1) |
Figure 8.
The signal attenuation as a function of diffusion weighting (b-value) in one of the tissue regions that show a high degree of signal change in Figure 6. A change in diffusion properties between the resting and active state is observed. Top) Raw signal attenuation. Bottom) Normalized version of plot in top panel.
The signal as a function of diffusion weighting, b, is then described as the sum of two components attenuated by diffusion coefficients D1 and D2, and weighted by f and (1−f), respectively. In our analysis we fit Eq. (1) to data from the resting state. The active state is then fitted using the values for D1 and D2 obtained from the fit to the resting state data allowing only the weighting of the two signal components to shift from resting state to active state. Arbitrarily we denote the faster diffusion coefficient D1 and the slower D2 and thus the factor f therefore describes the weight of the fast decaying signal component.
Results
Slice stability
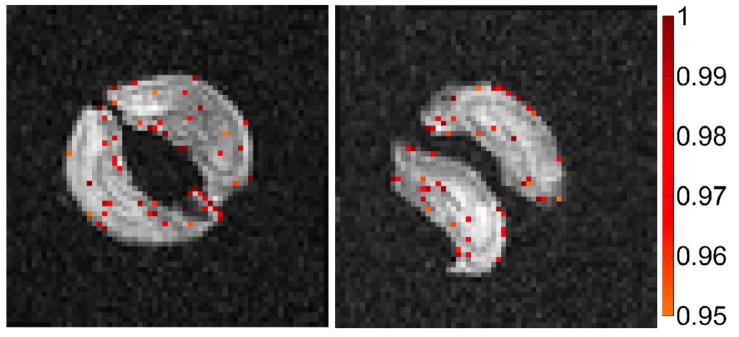
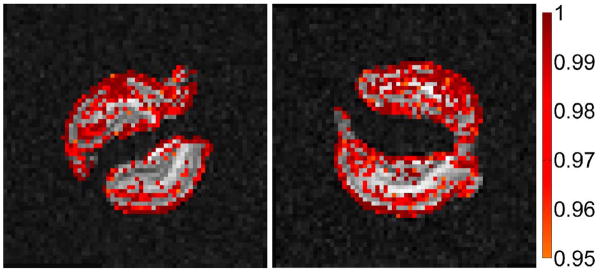
All slices (n=4) were found to be stable with signal magnitude and diffusion attenuation being the same over both imaging periods where the slices were exposed to untreated, oxygenated ACSF during perfusion. Figure 1 shows difference maps highlighting pixels that differ significantly (p<0.05) between the first and second imaging periods for all four slices. Few pixels showed statistically significant differences and the majority of those that did are around the outer rim of the slices which is suggestive of an artificial edge effect. This is further supported by the minor shift in pixel intensity distribution between period 1 and period 2 as seen in Figure 10, panel A.
Figure 1.
Example maps of brain slices showing pixels that have statistically significant (p<0.05) differences between the first and second imaging period in a stability study (b = 2400 s/mm2). Colorbar shows (1−p).
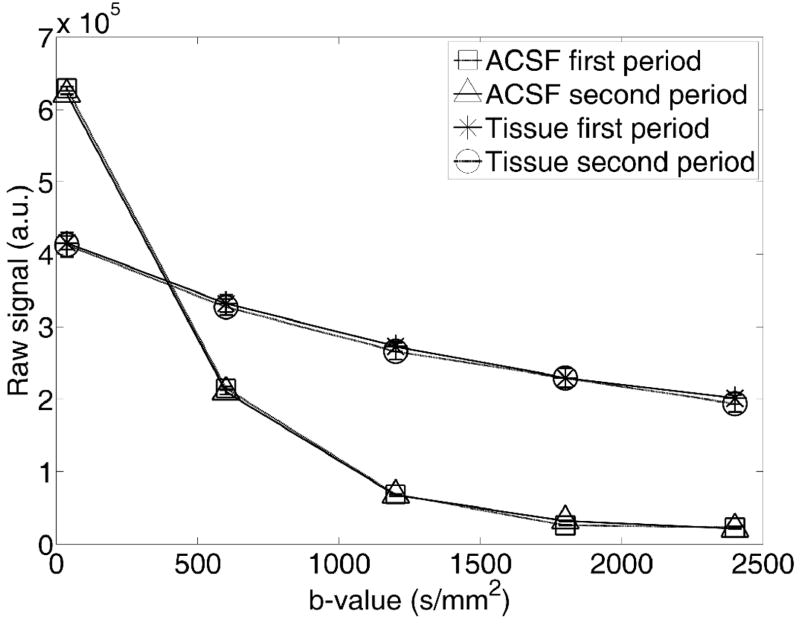
Figure 2 shows a plot of raw signal from identical perfusate and tissue ROIs in the two imaging periods. Attenuation curves did not differ significantly between tissue or perfusate groups at any of the five b-values tested.
Figure 2.
Plot of raw signal magnitude (a.u. = arbitrary units) as a function of diffusion weighting (b-value) from ROIs in a central tissue region (containing portions of the stratum lucidum and stratum radiatum) and perfusate for the stability study, taken from images similar to those in Figure 1. ROIs were identical in both imaging periods. Signal intensity and diffusion properties remain constant in both perfusate and tissue between imaging periods.
Kainate exposure
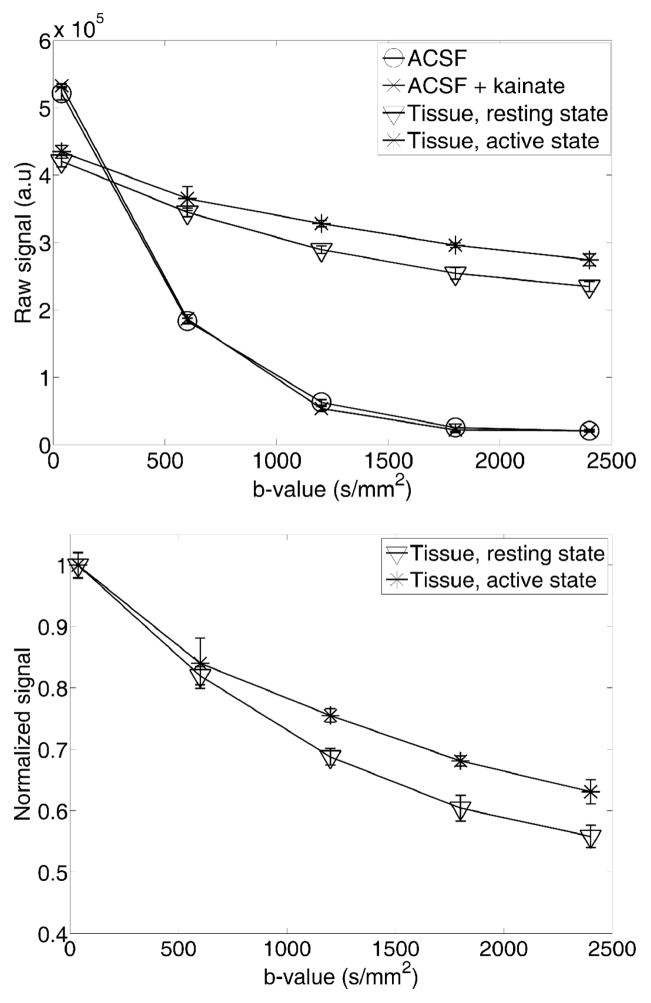
Figure 3 shows pixels that are significantly different (p<0.05) between the resting state (before kainate) and the active state (after kainate) at that same diffusion weighting (b = 2400 s/mm2). The figure shows all slices used in this experiment (n=6). Figure 4 shows raw data from representative ROIs of perfusates and tissue in both the resting and active states. Tissue ROIs contained portions of the pyramidal cell layer, stratum radiatum, and stratum oriens in the CA1 region. The tissue signal curves separate as diffusion weighting increases. The active state raw signal increase is approximately 18% at b = 2400 s/mm2 for the ROI presented in Figure 4. A marked shift in pixel intensity distribution is seen between active and resting state in Figure 10B.
Figure 3.
Difference maps of all six slices showing significantly different pixels (p<0.05) between the resting state (before kainate) and active state (after kainate) at b = 2400 s/mm2. The active state has more signal than the resting state. Colorbars show (1−p).
Figure 4.
Signal curves from tissue and perfusates in the resting and active states. Top) Raw signal (directly comparable; a.u. = arbitrary units) from the same area (ROI around part of CA1 cell layer) of the same hippocampal slice in resting state and active state. Signal curves from ROIs in the perfusate are also included to document identical diffusion properties of the perfusates used. These curves also document the temperature stability of the experiment. Bottom) The normalized tissue curves from the top panel shows the change in diffusivity from resting state to active state.
Kainate inhibition using CNQX
In the control experiment (Figure 5) where slices were pretreated with the competitive kainate antagonist CNQX (6-cyano-7-nitroquinoxaline-2,3-dione) before being exposed to kainate, very few pixels register a statistically significant difference suggesting a lack of activity in the chemically inhibited samples (n=6). The pixels that do show a significant difference are mainly around the edge of the slices as was the case in the slice stability test. Only a minor shift in pixel intensity distribution is seen between period 1 and period 2 (Figure 10, panel C). Also, the observed effect is of the same order as seen in the slice stability test.
Figure 5.
Results from slices treated with kainate inhibitor CNQX (10 μM) prior to kainate exposure. The difference maps show significantly different pixel values (p<0.05) between the resting state and active state at b = 2400 s/mm2. The number of pixels showing a difference is comparable to the number of different pixels in the stability maps (Figure 1). Colorbars show (1−p).
Kainate exposure with MK801 pretreatment
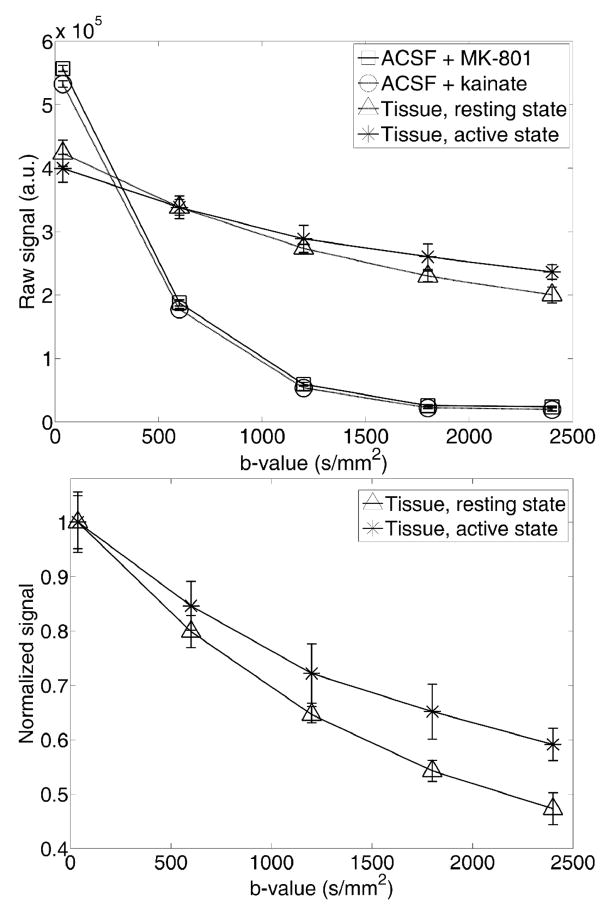
Conversely, the significance of the signal increase between resting and active states is even greater in the experiments where samples (n=6) were pretreated with the neuroprotective agent MK-801 (Figure 6). The level of significance is more even across the slices in this experiment than in the kainate experiment with no pretreatment. Figure 7 shows raw signal from an ROI in a region containing portions of the stratum lucidum and stratum radiatum, whereas Figure 8 shows the signal from resting and active state in a large region showing highly significant signal change at b = 2400 s/mm2. An example of the shift in pixel intensity distribution between resting and active state is seen in Figure 10D. ROIs in areas showing significantly different signal between resting state and active state were selected in all six slices. The normalized signals were then used in a biexponential analysis of the change in diffusion properties between baseline and active state. The result of this analysis is given in Table 1. We find a reduction of f (the weight of the fast decaying signal component) from resting state to active state for all ROIs. The mean value for f at rest is 0.64 whereas for the active state it is 0.32 i.e. an average reduction of 50%.
Figure 6.
Kainate activation following pretreatment with neuroprotective MK-801. This non-competitive NMDA receptor antagonist reduces the ischemic insult in the slice by blocking calcium influx into the cells resulting in a lower baseline signal measurement. The lowered signal intensity during the inactive period contributes to a more statistically significant signal change following activation. The difference maps show significantly different (p<0.05) pixels between the resting state and active state at b = 2400 s/mm2. Significantly different pixels in the active state have more signal than in the resting state. Colorbar shows (1−p).
Figure 7.
Diffusion weighted MR signal behaviour in ROIs of perfusate and tissue for both resting and active state. (Top) The signal attenuation as function of b-value for pairwiseidentical ROIs in tissue and perfusate. Tissue ROIs contained portions of the stratum lucidum and stratum radiatum. (Bottom) Normalized tissue curves of the raw data displayed in top panel. The difference in signal attenuation reflects the change of diffusion properties in the tissue between resting and active states.
Table 1.
The results from biexponential analysis of one ROI in each slice in areas showing significant signal change in slices pretreated with MK-801 and exposed to kainate. The results show changes in diffusion properties between the resting and active state. Please refer to Eq. (1) for definitions.
| Roi1 | Roi2 | Roi3 | Roi4 | Roi5 | Roi6 | |||||||
|---|---|---|---|---|---|---|---|---|---|---|---|---|
| Rest | Active | Rest | Active | Rest | Active | Rest | Active | Rest | Active | Rest | Active | |
| D1 (×10−4 mm2/s) | 5.67 | 5.67 | 7.64 | 7.64 | 6.25 | 6.25 | 7.13 | 7.13 | 7.33 | 7.33 | 5.64 | 5.64 |
| D2 (×10−4 mm2/s) | 0.36 | 0.36 | 0.63 | 0.63 | 0.46 | 0.46 | 0.59 | 0.59 | 1.01 | 1.01 | 0.86 | 0.86 |
| f | 0.79 | 0.36 | 0.48 | 0.26 | 0.67 | 0.31 | 0.59 | 0.35 | 0.61 | 0.37 | 0.70 | 0.27 |
| Δf | −0.43 | −0.22 | −0.36 | −0.24 | −0.24 | −0.43 | ||||||
Elevated extracellular K+
Upon exposure to ACSF containing 27 mM KCl, the slices (n=4) show a more general increase in signal than slices in the experiments presented above. The difference maps at b = 2400 s/mm2 can be seen in Figure 9. A shift in pixel intensity distribution between resting and active state is seen in Figure 10, panel E.
Figure 9.
The effect of elevated potassium ion concentration in the perfusate. The maps show significantly different (p<0.05) pixels in slices perfused with ACSF and with ACSF containing elevated potassium. Images obtained with a diffusion weighting of b = 2400 s/mm2. Colorbars show (1-p).
Discussion
Neural activity is associated with an increase in extracellular potassium due to the efflux of potassium ions from cells as a part of the repolarization phase of nerve firing. If activity in the neuron outpaces the ability of the Na/K ATP pumps to fully restore this concentration gradient, the shift in extracellular potassium concentration will alter the neuron’s resting membrane potential leading to a hyper excitable cell (Alberts et al. (eds), 2002). This, in turn, will elicit a rapid-fire behaviour from affected neurons associated with excitotoxic activity that has been used classically to model epileptogenesis (Zuckermann and Glaser, 1968).
Kainate is a chemical compound that has also been employed in epileptogenic models due to its role in excitatory neuronal signaling (Schwob et al., 1980). It acts directly on the ionotropic, non-NMDA glutamate receptor that is a namesake for the compound itself. These kainate receptors are present on both pre and postsynaptic membranes and are thought to play a key role in regulating neural excitability (Contractor et al., 2000).
It is for their role in the events associated with neural activation that kainate and potassium compounds were chosen for our study. While the outcome of exposure to these compounds in the slice model is quite similar, the mechanisms with which they act are remarkably different allowing us to observe and manipulate different aspects of the biological machinery responsible for neural activation. We have attempted to relate neural activation induced by these compounds to changes in the diffusion signal of MR images. Previous studies have reported a lack of ADC change in the parenchyma of stimulated visual cortex and attributed observed ADC changes to vascular effects (Jin et al., 2006; Miller et al., 2007; Jin and Kim, 2008). Whereas prior studies have relied heavily on timing and image weighting parameters to segregate the effects of vascular flow and cellular swelling on diffusion signal changes, the current protocol allowed us to measure cell swelling in devascularized tissue thus eliminating any potential contribution to signal changes from blood flow or BOLD effects. While it is not yet agreed upon to what extent vascular flow contributes to the diffusion signal increases during neural activation in vivo, the experiments presented here show that changes in the diffusion weighted signal can be observed in devascularized tissue treated with compounds that elicit neural activity. This result, while not confirming the hypothesis that diffusion signal changes observed during previous in vivo studies (Darquie et al., 2001; Le Bihan et al., 2006) are due to neural activity, suggests that proposed activation-based changes should not be summarily dismissed as a vascular flow phenomenon pending closer investigation into the origins of the described signal change.
The signal attenuation curves of treated and untreated tissue separate as the diffusion weighting increases indicative of the length scale of the microstructural changes caused by neuronal activation. Experiments using kainate show that the active state is more signal intense than the resting state and that the diffusion attenuation in the active state is slower than in the resting state. Conversely, this signal change does not occur if the tissue is pretreated with the inhibitor CNQX. The described signal change must therefore arise from the microstructural changes accompanying neuronal activation and thus represents a potential means of observing cellular function with diffusion-weighted MRI. Activation-induced cell swelling is most evident in the experiment where slices were pretreated with the neuroprotective NMDA receptor antagonist MK-801. This effect can be attributed to a reduction in the initial ischemic insult that results from slice procurement which lowers the diffusion-weighted signal in control scans thereby increasing the magnitude of signal change following activation. The described change in diffusion attenuation follows similar trends regardless of whether MK-801 is employed: the active state shows slower diffusion attenuation indicating a decreased apparent diffusion coefficient (ADC) in the active state. Such activity-dependent decreases in ADC were reported previously in in vivo studies (Darquie et al., 2001; Le Bihan et al., 2006). The biexponential analysis performed on ROIs from slices pretreated with MK-801 and exposed to kainate allows for comparison to a similar analysis performed on in vivo diffusion weighted fMRI data in (Le Bihan et al., 2006) where a shift of 1.7% was found from fast to slow decaying signal between the resting and active state. Our analysis shows the same overall behaviour but the effect is more pronounced in the slice model with the fast decaying signal component reduced by 50% on average between the resting and active state. This large effect is most likely caused by a more uniform content of each imaging voxel in the slice model compared to the in vivo studies as well as higher activation levels than would be expected under the normal physiological conditions of in vivo experiments.
Our results—especially in the case of kainate activation following MK-801 pretreatment—seem to suggest regional differences in neural activity with the most significant signal changes overlying CA1’s pyramidal cell layer and stratum radiatum and, to a lesser extent, the granule cell and molecular layers of the dentate gyrus. This result is not surprising given that these areas have been shown to be highly vulnerable to excitotoxic stress (Kesslak et al., 1995). While our treatment protocol may induce significant, region-specific variability in neural activity, we did not attempt to quantify this variation as hippocampal subregions could not be reliably segmented. This was due to problems associated with partial volume averaging and, as such, we plan to address this variation in subsequent studies employing higher resolution scans. Although treatments with both elevated KCl and kainate lead to a widespread diffusivity decrease in the hippocampus, our results—in the case of KCl where the effect was seen to be more general across the slice—suggest that the drop in diffusion rate can occur in the absence as well as the presence of neural firing. The same effect has been reported in previous studies (e.g. Andrew et al., 1996) and attributed to glial swelling throughout the slice as K+ is taken up by the glial network. This finding highlights the need to exercise caution in establishing a correlative or causative relationship between activity-inducing treatments and neural activity before this effect could hope to be utilized as a means of obtaining functionally relevant MRI data in the clinic. Also, while the methods of neural activation described in the current study are well established, the levels of activity elicited from our treatment protocols have long been associated with excitotoxicity. It is worth noting however that other studies, in the case of KCl-induced activation, have found this swelling to be reversible even when using equivalent concentrations of potassium (Stroman et al., 2008).
In the present study, we have described the ability to monitor periods of increased neural activation using diffusion MRI methods with the signal change attributed to microstructural changes occurring at the cellular level. With sufficient development, this effect could be employed in functional neuroimaging experiments that obtain better spatial and temporal resolution than offered by current MEG and BOLD-based protocols.
Acknowledgments
This work was supported by The National Danish Research Foundation’s Center of Functionally Integrative Neuroscience (CFIN) (grant no. 95093538-2458, project 100297), the National Institutes of Health (P41 RR16105 and RO1 NS36992), and the National Science Foundation through the National High Magnetic Field Laboratory
The authors would like to thank the staff of the AMRIS facility at the University of Florida’s McKnight Brain Institute for technical support and Dr. Steve Roper and Huan Xing for counsel relating to experimental procedures. In addition, Dr. Brian Hansen would like to thank: The Denmark-America Foundation, Dagmar Marshall’s Foundation, Julie von Müllen’s Foundation and the Oticon Foundation for financial support.
Footnotes
Author contributions: JF, BH, PVP and SJB designed research; JF and BH performed research; BH analyzed data; JF and BH wrote the paper; JF, BH, PVP and SJB edited the paper.
The authors declare no conflict of interest.
Publisher's Disclaimer: This is a PDF file of an unedited manuscript that has been accepted for publication. As a service to our customers we are providing this early version of the manuscript. The manuscript will undergo copyediting, typesetting, and review of the resulting proof before it is published in its final citable form. Please note that during the production process errors may be discovered which could affect the content, and all legal disclaimers that apply to the journal pertain.
References
- Alberts B. In: Molecular Biology of the Cell. Alberts B, et al., editors. Garland Science; 2002. pp. 615–657. [Google Scholar]
- Andrew RD, Adams JR, Polischuk TM. Imaging NMDA- and Kainate-Induced Intrinsic Optical Signals From the Hippocampal Slice. J Neurophys. 1996;76(4):2707–2717. doi: 10.1152/jn.1996.76.4.2707. [DOI] [PubMed] [Google Scholar]
- Cohen LB, Hille B, Keynes RD. Light scattering and birefringence changes during activity in the electric organ of electrophorus electricus. Journal of Physiology. 1996;203:489–509. doi: 10.1113/jphysiol.1969.sp008876. [DOI] [PMC free article] [PubMed] [Google Scholar]
- Collingridge GL. The brain slice preparation: a tribute to the pioneer Henry McIlwain. J Neurosci Meth. 1995;59:5–9. doi: 10.1016/0165-0270(94)00187-l. [DOI] [PubMed] [Google Scholar]
- Contractor A, Swanson GT, Sailer A, O’Gorman S, Heinemann SF. Identification of the Kainate Receptor Subunits Underlying Modulation of Excitatory Synaptic Transmission in the CA3 Region of the Hippocampus. J Neurosci. 2000;20(22):8269–8278. doi: 10.1523/JNEUROSCI.20-22-08269.2000. [DOI] [PMC free article] [PubMed] [Google Scholar]
- Darquie A, Poline JB, Poupon C, Saint-Jalmes H, Le Bihan D. Transient decrease in water diffusion observed in human occipital cortex during visual stimulation. Proc Natl Acad Sci USA. 2001;98(16):9391–9395. doi: 10.1073/pnas.151125698. [DOI] [PMC free article] [PubMed] [Google Scholar]
- Iwasa K, Tasaki I, Gibbons RC. Swelling of nerve fibers associated with action potentials. Science. 1980;210:338–339. doi: 10.1126/science.7423196. [DOI] [PubMed] [Google Scholar]
- Jin T, Zhao F, Kim SG. Sources of functional apparent diffusion coefficient changes investigated by diffusion-weighted spin-echo fMRI. Magn Res Med. 2006;56:1283–1292. doi: 10.1002/mrm.21074. [DOI] [PubMed] [Google Scholar]
- Jin T, Kim SG. Cortical layer-dependent dynamic blood oxygenation, cerebral blood flow and cerebral blood volume responses during visual stimulation. Neuroimage. 2008;43:1–9. doi: 10.1016/j.neuroimage.2008.06.029. [DOI] [PMC free article] [PubMed] [Google Scholar]
- Kesslak JP, Yuan D, Neeper S, Cotman CW. Vulnerability of the hippocampus to kainite excitotoxicity in the aged, mature, and young adult rat. Neurosci Lett. 1995;188:117–120. doi: 10.1016/0304-3940(95)11415-s. [DOI] [PubMed] [Google Scholar]
- Kim GH, Kosterin P, Obaid AL, Salzberg BM. A Mechanical Spike Accompanies the Action Potential in Mammalian Nerve Terminals. Biophys J. 2007;92(9):3122–3129. doi: 10.1529/biophysj.106.103754. [DOI] [PMC free article] [PubMed] [Google Scholar]
- Le Bihan D, Urayama S, Aso T, Hanakawa T, Fukuyama H. Direct and fast detection of neuronal activation in the human brain with diffusion MRI. Proc Natl Acad Sci USA. 2006;103(21):8263–8268. doi: 10.1073/pnas.0600644103. [DOI] [PMC free article] [PubMed] [Google Scholar]
- Logothetis NK. What we can do and what we cannot do with fMRI. Nature. 2008;453(7197):869–878. doi: 10.1038/nature06976. [DOI] [PubMed] [Google Scholar]
- Miller KL, Bulte DP, Devlin H, Robson MD, Wise RG, Woolrich MW, Jezzard P, Behrens TE. Evidence for a vascular contribution to diffusion fMRI at high b value. Proc Natl Acad Sci USA. 2007;104(52):20967–20972. doi: 10.1073/pnas.0707257105. [DOI] [PMC free article] [PubMed] [Google Scholar]
- Schwob JE, Fuller T, Price JL, Olney JW. Widespread patterns of neuronal damage following systemic of intracerebral injections of kainic acid: A histological study. Neurosci. 1980;5(6):991–1014. doi: 10.1016/0306-4522(80)90181-5. [DOI] [PubMed] [Google Scholar]
- Shepherd TM, Blackband SJ, Wirth E-D., III Simultaneous diffusion MRI measurements from multiple hippocampal slices. Magn Reson Med. 2002;48(3):565–569. doi: 10.1002/mrm.10241. [DOI] [PubMed] [Google Scholar]
- Stroman PW, Lee AS, Pitchers KK, Andrew RD. Magnetic resonance imaging of neuronal and glial swelling as an indicator of function in cerebral tissue slices. Mag Reson Med. 2008;59:700–706. doi: 10.1002/mrm.21534. [DOI] [PubMed] [Google Scholar]
- Vafaee MS, Gjedde A. Spatially dissociated flow-metabolism coupling in brain activation. Neuroimage. 2004;21(2):507–515. doi: 10.1016/j.neuroimage.2003.10.003. [DOI] [PubMed] [Google Scholar]
- Wang JK, Portbury S, Thomas MB, Barney S, Ricca DJ, Morris DL, Warner DS, Lo DC. Cardiac glycosides provide neuroprotection against ischemic stroke: Discovery by a brain slice-based compound screening platform. PNAS. 2006;103(27):10461–10466. doi: 10.1073/pnas.0600930103. [DOI] [PMC free article] [PubMed] [Google Scholar]
- Zuckermann EC, Glaser GH. Hippocampal epileptic activity induced by localized ventricular perfusion with high-potassium cerebrospinal fluid. Exp Neuro. 1968;20(1):87–110. doi: 10.1016/0014-4886(68)90126-x. [DOI] [PubMed] [Google Scholar]


