Abstract
Purpose:
To describe the basic concepts of social network analysis (SNA), and introduce some applications of this technique in assessing aspects of institutional culture.
Methods:
We applied SNA to 3 settings; team function in the intensive-care unit, interdisciplinary composition of advisory committees for federal career development awardees, and relationships between Key Function directors at an institution-wide Clinical Translational Sciences Institute.
Findings:
In the ICU setting, SNA provides interpretable summaries of aspects of clinical team functioning. When applied to membership on mentorship committees, it allows for summary descriptions of the degree of interdisciplinarity of various clinical departments. Finally, when applied to relationships among leaders of an institution-wide research it highlights potential areas of problems in relationships among academic departments. In all cases, data collection is relatively rapid, thereby allowing for the possibility of frequent repeated analyses over time.
Conclusions:
SNA provides a useful and standardized set of tools for measuring important aspects of team function, interdisciplinarity, and organizational culture that may otherwise be difficult to measure in an objective way.
Background
Medical research is increasingly becoming an interdisciplinary enterprise. Multidisciplinary teams, a key feature of the NIH roadmap, are thought to be essential for effective translational research.1 Collaboration across disciplines has also been proposed as a necessary component of health-services research and integration of medical research into primary care. 2,3 Similarly, the ACGME has highlighted the idea of “competent institution,”4 in which multidisciplinary members of health care teams are aligned to provide the best possible care for each patient. Extramurally, institutions are increasingly finding that collaboration across geographical distances is also beneficial to patients.5
Nonetheless, one of the largest obstacles to encouraging team-based is a culture that does not reward individual investigators for such collaboration6 as well as a resulting lack of measures that that assess collaboration. Although Holmes et al7 described several metrics for assessing research productivity they cautioned that current measures may not capture important collaborative aspects of research activity.
Unlike traditional evaluation methodologies, which typically assess program effects by averaging and comparing outcomes across individuals or programs, social network analysis (SNA) assesses the unique structure of interrelationships among individuals or programs.8-10 In addition to providing measures of team cohesion, information flow, and degree of hierarchical organization, SNA can also identify each individual's degree of centrality and connectedness to other members. Beyond the graphic displays of networks, SNA also can compute measures of cohesion, information flow, and degree of hierarchical organization both for the entire network as well as for each of its constituent members.
Social network analysis has been found efficiently to describe dynamics of networks in settings ranging from medical offices,11 interracial friendship choice among teenagers,12 kinship patterns in Central America,13 diffusion of medical innovation,14 and labor negotiations.15 Recent studies found that SNA could track the contagion of obesity through social networks16 as well as patterns of communication among primary care physicians.17 SNA has been widely used in organizational settings in order to reveal patterns of communication that would not otherwise have been evident.9 The Agency for Healthcare Quality and Research (AHRQ) has recently described its intention to use SNA to study patterns of communication among researchers, and ultimately to help improve patient safety.18
The basic data unit for SNA is a measure of the strength of the connection between all possible pairs of members of a defined network. In practice, each member of the network may be queried about their relationship to all other members. These connections may be self-reported, in the form of individuals' self-reported frequency of contact with one another, or level of trust and knowledge about one another. Data may also be archival, such as rosters of shared committee memberships, key personnel on grant applications, co-authorship, or frequency of e-mail contact. Because most social networks are open (ie, members of groups have contacts with other individuals who are not necessarily directly involved in the group, but who may influence group function), the evaluator must always make a deliberate decision about how to define the network for purposes of analysis. When using archival data, the network may be limited to those individuals for whom data exist.
Social network analysis is a largely visual technique, which is supported by a number of quantitative indices of both group and individual function. The main output is the sociogram, which provides information about the number and strength of connections between members of a network. Each member of a network is depicted by a “node” or “vertex” in the sociogram. Although there are a number of algorithms for determining optimal placement and arrangement of the nodes, ultimately it is up to the analyst to decide how best to arrange these data points so as to make the interpretation most clear.
Furthermore, SNA can produce some basic descriptive statistics relating both to the overall pattern of interactions among nodes in the network as whole, as well as additional descriptive statistics that characterize each member of the network. These numbers generally serve as further aids to interpretation of the sociogram. Although it is possible to perform statistical tests to compare individuals in a network, as well as networks to one another, the purpose of SNA is generally to characterize particular groups, rather than to test inferential hypotheses. Thus, in our presentation, we do not present p values or other aspects of statistical testing – rather, we present our results as a way of demonstrating how SNA can yield insights into structure and dynamics of specific groups.
Method and Results
In this article, we describe 3 examples, using actual data from within a medical center, of how SNA may be used to understand network dynamics in institutions. In the first example, we will describe patterns of team functioning in the intensive care unit. In the second, we describe relationships among academic departments as evidenced in membership in federal career development awardees' advisory committees. Finally, we will demonstrate how SNA can be used to describe patterns of relationships between the leadership of a large institution-wide translational-research enterprise.
1. Team function in the intensive care unit
As part of a pilot project, we used SNA to describe relationships among teams of caregivers in our medical intensive care unit (MICU). We began by observing the teams on rounds, and then defining all the individuals who were responsible for caring for an index patient. Caregivers could include attending physicians, residents, nurses, pharmacists, respiratory therapists, and medical students. We also identified the patient's key family member. We then created a team-specific survey that asked how often each team member interacted with all the other team members (and key family member) about the index patient. The family member was also given a copy to complete. We found that, under optimal conditions, it required less than an hour to identify the team, create the survey, and collect the data. Response options ranged from “never” to “3 or more times per day.” For purposes of analysis, we assumed that a connection existed between team members if they said that they spoke at least twice a day with one another. The decision about how to define a “connection” can be challenging – a loose definition (eg, once a day) risks creating a network with large numbers of relatively superficial connections, and thus may make it difficult to discern a pattern of important relationships in the network. On the other hand, an overly strict definition may yield a network with too few connections to interpret. In practice, the evaluator may look at networks produced by several definitions of connectedness, and select the one that strikes the best balance.
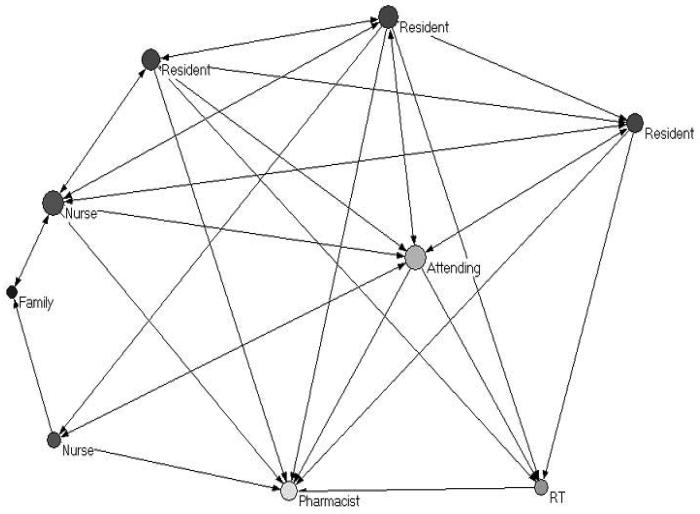
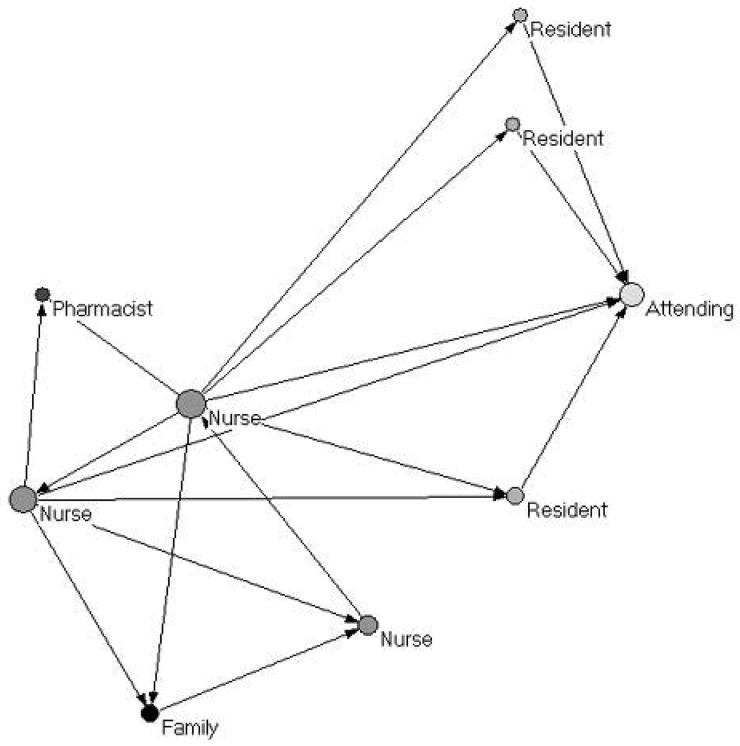
We present data from 2 teams for illustrative purposes. Team 1 (Figure 1) was caring for an elderly woman who had been recently admitted to the MICU for progressive dyspnea of unknown etiology. Team 2 (Figure 2) was caring for a patient who had been in the MICU for nearly 2 weeks with slowly improving respiratory status, and was about to be weaned from mechanical ventilation. In both networks, a connection was assumed to exist between individuals if they said that they interacted with one another more than once per day. The individuals are represented by nodes color-coded by role, and the size of each node is proportional to the number of other team members with whom they have more than once-daily contact. With the exception of the pharmacist, the 2 teams comprised entirely different individuals.
From a visual inspection, it is apparent that the teams are quite different in structure. Team 1 has a large number of connections between individuals of different roles. The attending physician has frequent interactions with more members of the team than does anyone else. The family has frequent contact with both nurses, both of whom have connections with several other members of the team, including the attending physician, the residents, and the pharmacist. With the exception of the respiratory therapist, all team members have contact with at least 4 other team members across various roles.
By contrast, Team 2 is characterized by a relatively small number of daily connections between team members. In this team, it is the nursing staff, rather than the medical staff, who appear to be central. As in team 1, the patient's family has frequent contact only with the nursing staff. In this case, however, it is with a nurse who is relatively isolated from the rest of the team. Thus, this family has a relaitevly greater distance from the rest of the team than does the first patient' family.
It is unclear whether different team structures are more appropriate to some clinical situations than others. Although the relatively unconnected structure of Team 2 might be more appropriate for stable patients with little day-to-day change in their clinical status, it remains unclear whether such a structure may nonetheless be more prone to errors in handoffs of information. Such differences in team structure structures might also affect family members' perceptions of the quality of care. These would clearly be important topics for future research.
2. Departmental structure of research-mentoring advisory committees
We assembled lists of the advisory committees for 53 federal career development awardees at our institution. This represented all such awards that were active at our institution at some point during the period 2004 through 2006, where the awardee continued to serve on our faculty at the beginning of 2007. One hundred fifty-seven faculty served as committee members. Such membership not only allows the awardees to benefit from a greater diversity of expertise, but also provides an opportunity for faculty from different departments and disciplines to meet and interact with one another. Furthermore, if an awardee's committee members sit on multiple other committees, this provides the awardee with greater opportunity to indirectly network with other awardees.
Such archival data contains large amounts of information, which would be challenging to interpret by simply examining all 53 mentorship-committee membership lists. SNA, however, can provide depictions of these data that are readily interpretable and quantifiable. In fact, this sort of committee-membership data permits examination of 2 different kinds of networks; first, the network of connections between awardees with one another via shared committee members, and second, the network of connections between faculty via shared committee membership. Both types of networks can be coded by departmental affiliation. This permits inferences about the degree to which different departments, as a whole, are associated with one another via their respective members' committee work. We point out that individuals in the network are not connected directly to one another by individual choice, but rather through their joint memberships in formally convened groups.
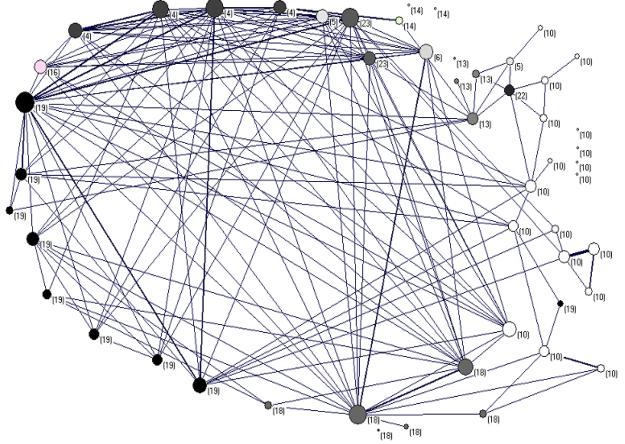
Figure 3 displays the network of awardees, color-coded by their academic department. Each circle represents an awardee. Each line in the diagram represents a shared committee member between pairs of awardees; thicker lines indicate more than 1 shared member. The size of the nodes is proportional to the total number of committee members that awardees share with other awardees. Note that this network does not contain information about the committee members' departmental affiliations.
Several general conclusions can be drawn from this diagram. First, awardees in the orange and blue departments have the greatest diversity in their committee memberships, as evidenced by their awardees' committee members frequent shared membership in other committees and generally larger circle sizes. Second, awardees in these departments frequently share committee members with awardees in other departments. By contrast, the light-green department represents the opposite situation. Several awardees are not at all connected to the network, indicating that none of these individuals' committee members serve on any other committees. Furthermore, at least a few of these awardees share more or less the exact same committee, as indicated by the thick lines connecting them. Thus, it appears that awardees in this department have committees comprising individuals who are largely chosen from within their own department, and that many of these committee members did not have the experiences of serving on other committees during this time; those that do appear to have more committee-membership were largely serving on other committees within their own department.
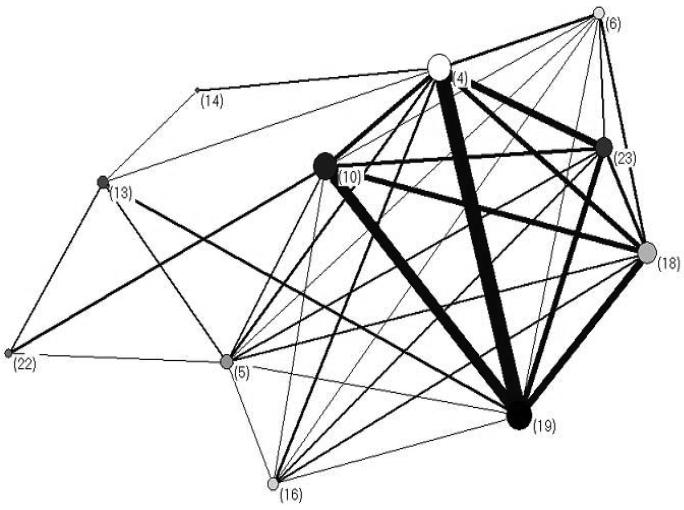
Figure 4 complements Figure 3 by providing information about committee members' affiliations with one another. Because a network of 157 separate individuals is difficult to interpret, committee members have been collapsed within departments, which are represented by circles in the diagram. The thickness of lines between departments is proportional to the number of committees that shared members from that pair of departments. This view provides an overall summary of the number of times that members of each department jointly served on awardee committees.
These results mirror those of the awardee network. There are large numbers of faculty connections between the orange and blue departments. In general, the orange department appears to be at the center of this network, with large numbers of frequent connections with several other departments. Furthermore, the black department, although appearing relatively isolated from the network, is at the center of a “subnetwork” comprising the relatively isolated maroon, magenta, and pink departments. This depiction not only provides an economical way of looking at all the committee-membership simultaneously, but also suggests an inherent methodology for tracking efforts to improve interdisciplinarity – if such data were collected and analyzed yearly, this would provide an index by which institutional change could be measured. These data also help identify departments that may need some additional effort to become more interdisciplinary in their support of new researchers.
3. Leadership of a multidisciplinary research institute
As part of a multi-year NIH award to establish a Clinical Translational Sciences Institute (CTSI), our institution defines a series of 11 Key Functions, each with its own directors and staff. The shared purpose of these Key Functions is to promote translational research by giving investigators access to institution-wide services such as funding opportunities for pilot studies and for the development of novel research methodologies; research support services such as study design consulting, informatics support and a clinical research center; and education and training in the evolving disciplines of clinical and translational research.
As part of an initial evaluation of the structure of the CTSI, we asked all the Key Function directors to rate their current state of knowledge of the role of the other 10 Key Functions, as well as their anticipated frequency of interaction with the other Key Functions. We then averaged these responses, creating a mean level of knowledge and anticipated interaction of each possible pair of Key Functions. This allowed us to produce a customized report for each Key Function, which described the strength of their relationships with each of the other 9 Key Functions.
In order to produce a network diagram of these data, we assessed a number of possible cutoffs for these means – a mean above the cutoff represents an arrow between the respective Key Function. Note that these connections are thus bi-directional; if directors of a pair of Key Functions indicate a high level of knowledge or anticipated interaction with one another, then the connection between them is represented by a 2-headed arrow. On the other hand, the relationship would be one-way if one Key Function gave a high response about the second, but if that was not reciprocated.
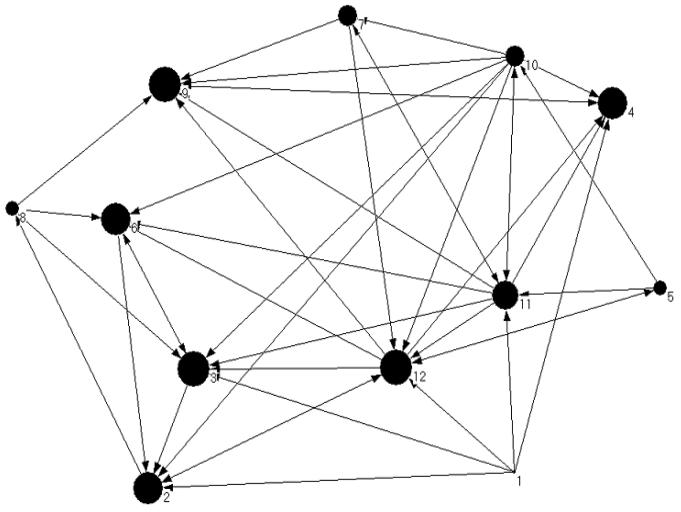
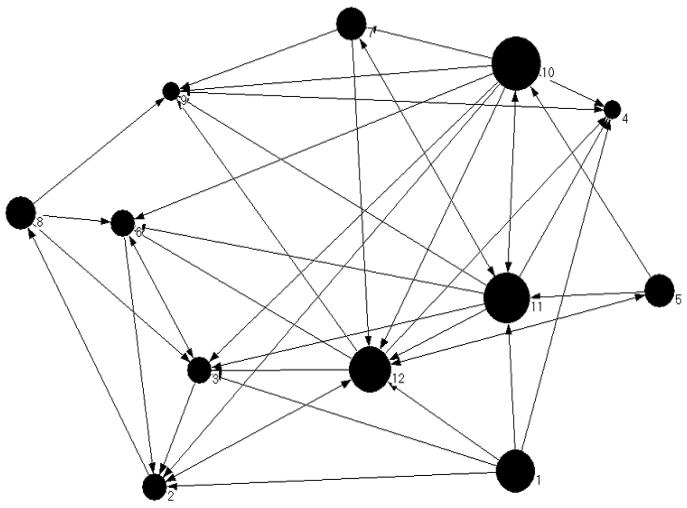
Figure 5 presents data about the Key Function directors' level of knowledge about one another's Key Functions. In this diagram, the size of the nodes is proportional to the number of incoming arrows (ie, the number of other Key Functions that report a high level of knowledge about them). Figure 6 represents the same data, but with the size of the nodes proportional to the number of outgoing arrows (ie, their knowledge of the other Key Functions). From inspection of these Figures, it is apparent that although Key Functions 2,3,4,6, and 9 are well understood by many other Key function directors, their own directors report relatively less understanding of the other Key Functions. By contrast, Key functions 1 and 10 are relatively less well understood, although their directors report a relatively high level of understanding of the role of many other Key Functions. Furthermore, the diagrams also illustrate potential weaknesses in relationships between specific pairs of Key functions. Thus, these results reveal specific gaps in knowledge that could be addressed early through targeted interventions.
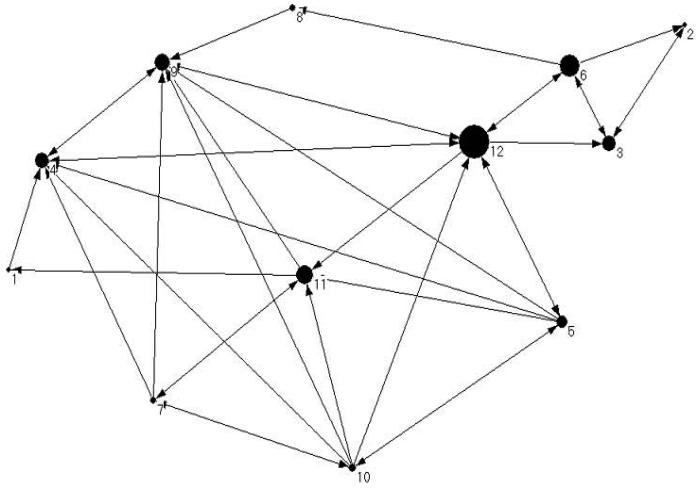
Figure 7 presents data about Key Function directors' anticipated interactions with one another. The size of the nodes is proportional to each Key function's betweenness, which is a measure of the degree to which each Key Function is on a pathway between all other possible pairs of Key Functions. Thus, those with high betweenness values are more critical to connecting other Key Functions that would otherwise have little contact with one another. Key Functions 9 and 12 owes much of their high betweenness to the fact that they connect the larger network to the smaller subnetwork comprising Key Functions 2,3,6, and 8. Key Function 6 is also prominent due to its exclusive connections with Key Functions 2 and 3. Finally, Key Function 11 also uniquely connects numerous other Key Functions, although this is not immediately apparent from simply inspecting the arrows between nodes. These analyses can thus be used to identify deficits and strengths in the network. If efforts are made to promote different interrelationships between Key Functions, these diagrams can serve as a baseline from which to assess institutional change.
Discussion and Conclusions
These examples highlight some ways that the tools of SNA can shed light on a range of organizational dynamics. In addition to these purely visual representations of data, SNA also permits for computation of a range of numerical indices, both for individuals as well as for networks as a whole. Thus, use of SNA methodology also permits for computation of numerical trends in network structure over time.
The results of SNA must be interpreted in light of other sources of information about organizational structure and function, which are typically more qualitative and nuanced. Nonetheless, with its standardized methodology and reporting formats, SNA provides a useful complement to such subjective impressions, and provides standard metrics for assessment of change in organizational structure over time. Furthermore, SNA data are relatively simple and rapid to collect and analyze, and thus offer an appealing complement to more involved methods involving observers or structured interviews of network members. SNA is also relatively free of observer bias. Thus, SNA provides a promising addition to the set of tools currently used to assess and evaluate organizational structure.
Acknowledgements
The authors thank Tina McCoy, Nicole O'Dell and Nikki Murray for their help in data collection.
This publication was made possible by Grant Number UL1 RR024160 from the National Center for Research Resources (NCRR), a component of the National Institutes of Health (NIH), and the NIH Roadmap for Medical Research.
Footnotes
Publisher's Disclaimer: Disclaimer: This publication's contents are solely the responsibility of the authors and do not necessarily represent the official view of NCRR or NIH. Information on NCRR is available at http://www.ncrr.nih.gov/.
Information on Re-engineering the Clinical Research Enterprise can be obtained from http://nihroadmap.nih.gov/clinicalresearch/overview-translational.asp.
References
- 1.National Institutues of Health NIH roadmap for medical research; research teams of the future. http://nihroadmap.nih.gov/researchteams. Accessed Sept 17, 2007.
- 2.Carey TS, Howard DL, Goldmon M, et al. Developing effective interuniversity partnerships and community-based research to address health disparities. Acad Med. 2005 Nov;80(11):1039–1045. doi: 10.1097/00001888-200511000-00012. [DOI] [PMC free article] [PubMed] [Google Scholar]
- 3.Kindig DA, Dunham NC, Eisenberg JM. Needs and challenges for health services research at academic health centers. Acad Med. 1999 Nov;74(11):1193–1201. doi: 10.1097/00001888-199911000-00011. [DOI] [PubMed] [Google Scholar]
- 4.Gibson R. The competent institution. ACGME Bulletin. 2005 April; http://www.acgme.org/acWebsite/bulletin/bulletin04_05.pdf.
- 5.Sostman HD, Forese LL, Boom ML, et al. Building a transcontinental affiliation: a new model for academic health centers. Acad Med. 2005 Nov;80(11):1046–53. doi: 10.1097/00001888-200511000-00013. [DOI] [PubMed] [Google Scholar]
- 6.Cohen JJ, Siegel EK. Academic medical centers and medical research: the challenges ahead. JAMA. 2005 Sep 21;294(11):1367–72. doi: 10.1001/jama.294.11.1367. [DOI] [PubMed] [Google Scholar]
- 7.Holmes EW, Burks TF, Dzau V, et al. Measuring contributions to the research mission of medical schools. Acad Med. 2000 Mar;75(3):303–13. doi: 10.1097/00001888-200003000-00027. [DOI] [PubMed] [Google Scholar]
- 8.Wasserman S, Faust K. Social Network analysis. Cambridge University Press; Cambridge: 1994. [Google Scholar]
- 9.Durland MM, Fredericks KA, editors. Social Network Analysis in Program Evaluation. Jossey-Bass; San Francisco: 2006. [Google Scholar]
- 10.de Nooy W, Mrvar A, Batagelj V. Exploratory Social Network Analysis with Pajek. Cambridge University Press; Cambridge: 2005. [Google Scholar]
- 11.Scott J, Tallia A, Crosson JC, et al. Social network analysis as an analytic tool for interaction patterns in primary care practices. Ann Fam Med. 2005;3:443–448. doi: 10.1370/afm.344. [DOI] [PMC free article] [PubMed] [Google Scholar]
- 12.Hallinan MT, Williams RA. Interracial friendship choices in secondary schools. Am Social Rev. 1989;54:67–78. [Google Scholar]
- 13.Loomis CP, Morales JO, Clifford RA, Leonard OE. Turrialba: Social Systems and the Introduction of Change. The Free Press; Glencoe Ill: 1953. [Google Scholar]
- 14.Burt RS, Minor MJ, editors. Applied Network Analysis: A Methodologic Introduction. Sage; Beverly Hills: 1983. pp. 195–222. [Google Scholar]
- 15.Michael JH. Labor dispute reconciliation in a forest products manufacturing facility. Forest Prod J. 1997;47:41–45. [Google Scholar]
- 16.Christakis NA, Fowler JH. The spread of obesity in a large social network over 32 years. N Engl J Med. 2007;357(4):370–379. doi: 10.1056/NEJMsa066082. [DOI] [PubMed] [Google Scholar]
- 17.Keating NL, Ayanian JZ, Cleary PD, Marsden PV. Factors affecting influential discussions among physicians: A social network analysis of a primary care practice. J Gen Intern Med. 2007;22(6):794–798. doi: 10.1007/s11606-007-0190-8. [DOI] [PMC free article] [PubMed] [Google Scholar]
- 18.Introcaso DM. Who you know. FedTech. 2005 November; www.fedtechmagazine.com/article.asp?item_id=152. Accessed August 22, 2006.


