Abstract
Biliary atresia is a neonatal obstructive cholangiopathy that progresses to end-stage liver disease. Although the etiology is unknown, a neonatal adaptive immune signature has been mechanistically linked to obstruction of the extrahepatic bile ducts. Here, we investigated the role of the innate immune response in the pathogenesis of biliary atresia. Analysis of livers of infants at diagnosis revealed that NK cells populate the vicinity of intrahepatic bile ducts and overexpress several genes involved in cytotoxicity. Using a model of rotavirus-induced biliary atresia in newborn mice, we found that activated NK cells also populated murine livers and were the most abundant cells in extrahepatic bile ducts at the time of obstruction. Rotavirus-primed hepatic NK cells lysed cholangiocytes in a contact- and Nkg2d-dependent fashion. Depletion of NK cells and blockade of Nkg2d each prevented injury of the duct epithelium after rotavirus infection, maintained continuity of duct lumen between the liver and duodenum, and enabled bile flow, despite the presence of virus in the tissue and the overexpression of proinflammatory cytokines. These findings identify NK cells as key initiators of cholangiocyte injury via Nkg2d and demonstrate that injury to the duct epithelium drives the phenotype of experimental biliary atresia.
Introduction
Biliary atresia is the most common cause of chronic progressive liver disease in children and results from an inflammatory and fibrosing obstruction of extrahepatic bile ducts. Early diagnosis and prompt surgical intervention are critical for improved bile drainage but are unable to stop progression to end-stage cirrhosis. Although the pathogenesis of disease is multifactorial (reviewed in refs. 1–3), recent analyses of livers and/or biliary remnants at diagnosis uncovered a prominent proinflammatory footprint and an enriched population of CD4+CD8+ lymphocytes, with evidence of an oligoclonal expansion to as-yet-unidentified antigens (4–7). More direct support for the relevance of these findings to the pathogenesis of disease was obtained by mechanistic experiments in a neonatal mouse model of rhesus rotavirus–induced (RRV-induced) biliary atresia, in which the loss of Ifnγ and CD8+ lymphocytes prevented obstruction of bile ducts and suppressed the disease phenotype (8, 9). Further, when virus-primed T cells were transferred to RRV-naive recipients, they homed to bile ducts and induced cholangitis (9, 10). These studies identified molecular and cellular effectors that regulate inflammation and obstruction of bile ducts, but the mechanisms by which the neonatal immune system initiates the injury to the duct epithelium remain undefined.
Traditionally, the response of the immune system to environmental challenges in the neonatal period ranges from non-responsiveness to fully mature function (11). Although the number of T cells in neonates is lower than in adults by 1–2 logs, adult-like Th1 function can be achieved in vivo (12–14), but it is generally limited in magnitude or partially biased toward a Th2 phenotype (15–17). Recent studies of 1- and 7-day-old mice suggest the existence of an intrinsic hyperresponsiveness of cellular immunity that renders the neonate more susceptible to virus- and lipopolysaccharide-induced morbidity (18, 19). This hyper-response is temporally restricted to the early neonatal period and functionally linked to a lower T cell number. Even if lower in number, neonatal T cells can activate a broad proinflammatory program following tissue infection, as demonstrated by the effective clearance of RRV from the liver/biliary tract by neonatal CD8+ cells (9). While clearing the virus, however, CD8+ cells can secondarily injure the epithelium and produce the obstructive phenotype typical of experimental biliary atresia (9). Although the immune mechanisms that initiate the epithelial injury and trigger this adaptive response are largely unexplored, they may be linked to NK cells (20). Here, we found evidence that activated NK cells populate the diseased human livers at diagnosis and are the most abundant inflammatory cells in extrahepatic bile ducts at the time of obstruction in experimental biliary atresia. Directly testing the hypothesis that NK cells play a key role in pathogenesis of bile duct injury, we found that NK cells engage and lyse cholangiocytes, are required for the initiation of epithelial injury, and use the natural killer group 2d (Nkg2d) receptor to unleash the duct injury that produces the biliary atresia phenotype.
Results
NK cells populate the livers of infants with biliary atresia.
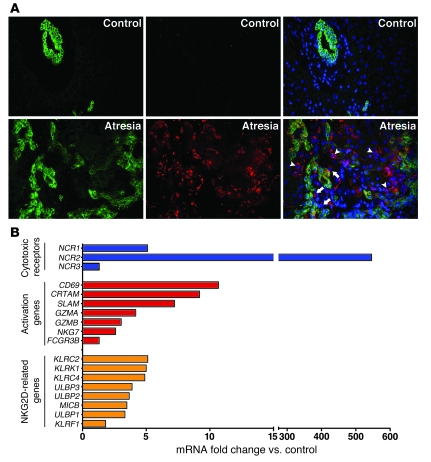
To explore the anatomical relationship between NK cells and bile ducts in human biliary atresia, we stained 5-μm sections of liver biopsy samples obtained at the time of diagnosis (1–3 months of age) with antibodies against CD56 (to detect NK cells) and cytokeratin (to detect bile duct epithelium). Controls consisted of liver biopsy samples obtained from organ transplant donors aged 2–3.5 years; age-matched donor controls from normal subjects were not available and were not pursued for ethical reasons. Immunofluorescence signals identified several NK cells populating the portal tracts, either in the vicinity of or immediately juxtaposed to epithelial cells, but were rarely observed in controls (Figure 1A). This population was distinct from CD3+ cells, which also populated the portal tract of infants with biliary atresia (Supplemental Figure 1A; supplemental material available online with this article; doi: 10.1172/JCI38879DS1). Searching for clues as to whether the anatomical relationship between NK cells and duct epithelial cells has functional relevance, we quantified the hepatic mRNA expression for genes involved in NK cell activation. We found that expression of 8 of 10 genes involved in cytotoxicity and all 7 genes related to the Nkg2d receptor increased 1.5- to approximately 500-fold in livers of infants with biliary atresia relative to controls (Figure 1B). Among these genes, the increased expression of those expressed primarily upon activation (NCR2, CRTAM, SLAM, CD69, and KLRC2) suggests that the molecular signature represents a functional state, rather than a reflection of increased cell number in portal tracts (Supplemental Figure 1B). Recognizing that some of these genes may also be expressed by cytotoxic T cells, which have been implicated in pathogenesis of biliary atresia, we used the rotavirus-induced model of biliary atresia to directly determine whether NK cells target the biliary epithelium and induce the disease phenotype.
Figure 1. Population and activation of NK cells in livers of infants with biliary atresia.
(A) Representative sections of livers from unaffected controls and from infants at the time of diagnosis of biliary atresia immunostained with anti-cytokeratin (to detect cholangiocytes; green, left panels) and anti-CD56 (to detect NK cells; red, middle panels) antibodies. Right panels represent overlays of left and middle panels after nuclear counterstaining with DAPI (blue). Arrowheads indicate NK cells in the portal tract; arrows indicate NK cells juxtaposed to cholangiocytes; original magnification, ×400. (B) mRNA fold change relative to controls for genes encoding cytotoxic receptors, activation markers, and NKG2D-related genes in livers of infants with biliary atresia. mRNA was quantified by real-time PCR and expressed as a ratio to human HPRT. n = 9 for biliary atresia and n = 7 for controls; fold changes for all genes, except for NCR3 and FCGR3B, are statistically significant (P < 0.05).
Activated NK cells populate the liver in experimental biliary atresia.
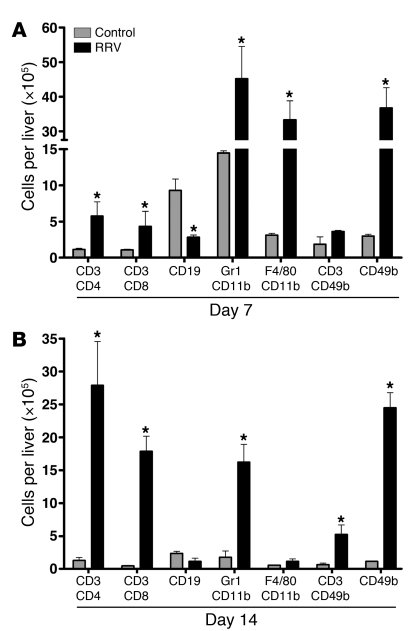
To precisely determine the number and functional commitment of hepatic NK cells in the pathogenesis of biliary atresia, we quantified lymphocyte subtypes, neutrophils, and macrophages in livers of neonatal BALB/c mice 7 and 14 days after i.p. injection of saline (as controls) or 1.5 × 10⁶ focus-forming units (FFU) of RRV within 24 hours of birth, as described previously (8, 9). We found that all mononuclear cell lineages increased in the liver after RRV injection at both time points, with NK cells increasing 8- to 10-fold compared with saline-injected controls (P < 0.05; Figure 2, A and B).
Figure 2. Population of neonatal livers by inflammatory cells after RRV challenge.
Flow cytometry–based quantification of hepatic mononuclear cells at 7 (A) and 14 (B) days after RRV or saline inoculation into 1-day-old mice. The vertical axes show the average number of cells per liver ± SD. n = 3–4 for each group and time point for all experiments; *P < 0.05, RRV versus saline (control) groups. The horizontal axes show the surface markers identifying specific cell types.
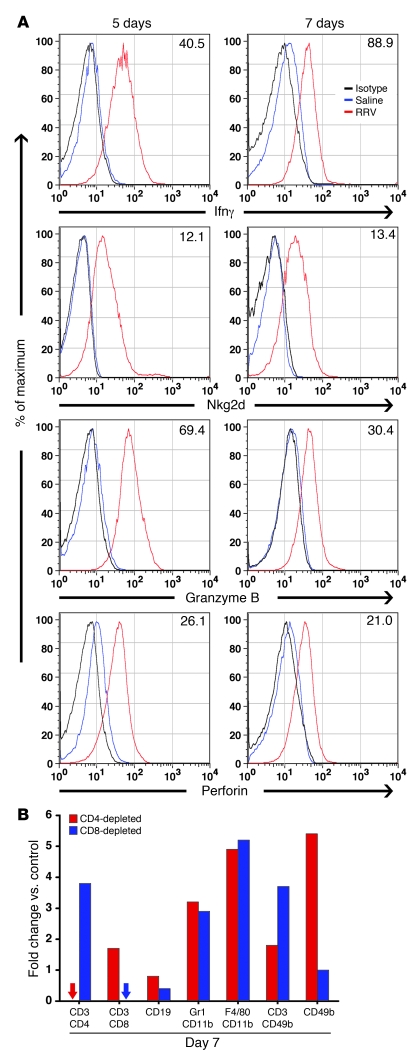
To gain further insight into whether this increase in NK cells may be important for the atresia phenotype, we first determined the expression of Ifnγ, Nkg2d surface receptor, granzyme B, and perforin (effectors of the immune synapse). Flow cytometric analysis showed that hepatic NK cells overexpressed all 4 inflammatory mediators in RRV-injected mice by several fold relative to saline controls just prior to (5 days) and at the onset (7 days) of duct obstruction (Figure 3A). Next, we compared the mononuclear cell populations following RRV injection in CD4+ cell–depleted mice (reported previously to develop atresia; ref. 9) and CD8+ cell–depleted mice (reported previously not to develop atresia; ref. 9). In these experiments, we noted again that RRV-injected, CD4+ cell–depleted mice developed obstruction of extrahepatic bile ducts at 7 days, while the ducts of RRV-injected, CD8+ cell–depleted mice remained patent. All inflammatory cell types increased after RRV injection in both groups; however, while CD4+ cell–depleted livers had a 5.5-fold increase in NK cells, the depletion of CD8+ cells prevented this increase and maintained NK cell numbers similar to those of saline controls (Figure 3B). Together, these data demonstrate preferential population of the liver by activated NK cells at the time of bile duct obstruction.
Figure 3. RRV-induced activation of hepatic NK cells after RRV challenge.
(A) Flow cytometry histograms showing the expression of Ifnγ, Nkg2d, granzyme B, and perforin by hepatic CD49b+ (NK) cells at 5 and 7 days after RRV or saline injection. For each individual cytokine/protease, the number represents the mean fluorescence intensity induced by RRV minus the median fluorescence intensity of the appropriate saline control. n = 3 livers per group per time point; % of maximum (vertical axis) represents a normalization of the number of events in specific quadrants of the flow cytometry grid. (B) Flow cytometric quantification of hepatic mononuclear cells is represented as fold changes in RRV-inoculated relative to saline-control mice that had been depleted of CD4+ or CD8+ cells (cells isolated at 7 days after injection of saline or RRV). n = 3–4 for each group; arrows indicate nondetectable cells; the horizontal axis shows the surface markers identifying specific cell types.
Prominent population of neonatal extrahepatic bile ducts by NK cells.
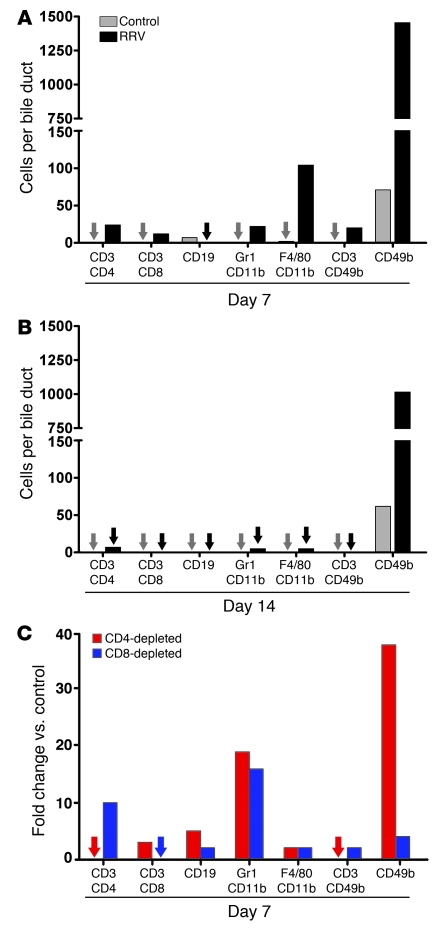
Because the extrahepatic bile duct is the primary target in biliary atresia, we quantified the cell lineages in extrahepatic bile ducts (including gallbladder) as described above. Extrahepatic ducts of control mice had normal histology, while the inoculation of RRV produced the biliary atresia phenotype in more than 90% of mice as reported previously (8). Flow cytometric analysis of mononuclear cells isolated from pools of 15–20 extrahepatic ducts identified NK cells as the most abundant inflammatory cells in the first 2 weeks of life in control mice (Figure 4, A and B, and Supplemental Table 1). After RRV inoculation, NK cells further increased and remained the highest in number by a factor of more than 10 relative to the other cells at 7 and 14 days. Comparing the mononuclear cell populations following RRV injection in CD4+ cell– and CD8+ cell–depleted mice (as above), we found that while NK cells increased 38-fold in CD4+ cell–depleted mice relative to controls, the loss of CD8+ cells blunted this response to only 4-fold relative to controls at 7 days (Figure 4C). Thus, NK cells are the most common resident inflammatory cells populating extrahepatic bile ducts of saline-control and RRV-injected neonatal mice. Based on these data and the selective increase in NK cells in extrahepatic ducts undergoing RRV-induced obstruction (as in CD4+ cell–depleted mice), we hypothesized that NK cells play a key role in pathogenesis of bile duct injury.
Figure 4. Population of the neonatal extrahepatic biliary tract by inflammatory cells after RRV challenge.
Flow cytometric quantification of mononuclear cells isolated from extrahepatic bile ducts/gallbladders microdissected en bloc at 7 (A) and 14 (B) days after saline or RRV injection into 1-day-old mice. The vertical axis shows the average number of cells per bile duct. (C) The number of cells per bile duct is shown as fold changes in RRV-inoculated relative to saline-control mice that had been depleted of CD4+ or CD8+ cells (cells isolated at 7 days after injection of saline or RRV). n = 15–20 mice per group and per time point for all experiments; arrows indicate nondetectable cells. The horizontal axis shows the surface markers identifying specific cell types.
Injury of cholangiocytes by RRV-primed NK cells.
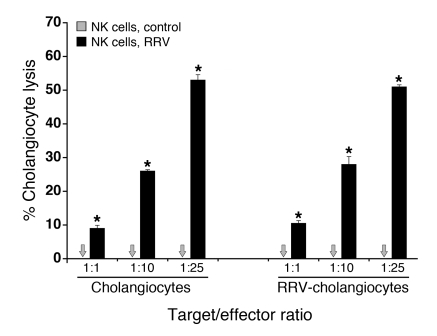
As an initial step to test this hypothesis, we determined whether hepatic NK cells induce lysis of the murine cholangiocyte line mCL in coculture (8, 9). Hepatic NK cells from saline-injected (control) mice did not lyse mCL, but RRV-primed hepatic NK cells induced lysis within 5 hours of coculture, regardless of the prior exposure of mCL to RRV (Figure 5). RRV-primed NK cells also induced similar lysis of a murine hepatocyte line (H2.35) and much less lysis of control murine lung epithelial (MLE-12) and breast carcinoma (4T1-MZ and 67-NR) cells (Supplemental Figure 2). To more directly explore whether NK cells are important to RRV-induced cholangiocyte injury in vivo, we examined the biliary epithelium and clinical course of mice injected with RRV and depleted of NK cells.
Figure 5. Lysis of cholangiocytes by hepatic NK cells.
Mean (±SD) percentage of 51Cr release by the murine cholangiocyte line mCL after 5 hours of coculture with hepatic NK cells purified 7 days after saline injection or RRV inoculation into 1-day-old mice. The horizontal axis shows mCL (target) to NK (effector) cell ratios. n = 3 wells per group; results are representative of 2 independent experiments, with hepatic NK cells obtained from pools of 10–15 livers (*P < 0.01); arrows indicate nondetectable cells.
Loss of NK cells prevents injury of the duct epithelium after RRV challenge.
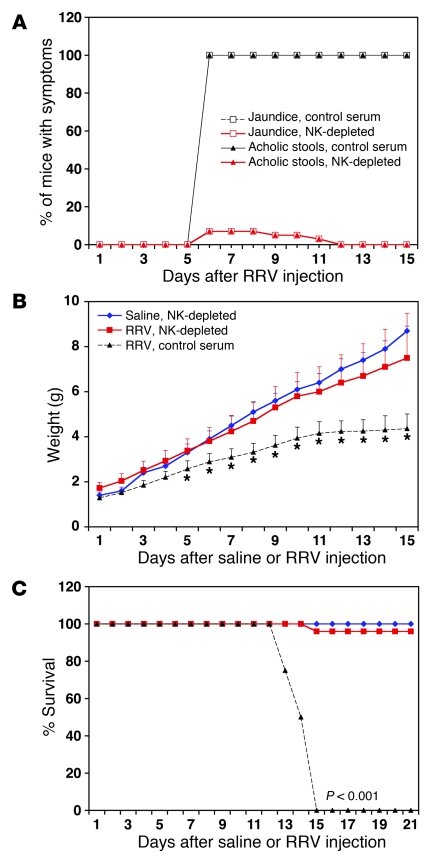
We injected saline or RRV into mice within 24 hours of birth and then injected half of the mice in each group with 30 μl of rabbit anti–asialo GM1 antiserum (known to deplete NK cells; ref. 21) or nonspecific rabbit serum (as controls) daily, beginning on the second day of life and extending through day 12, then every other day until day 21. Depletion efficiency was determined by the loss of more than 97% of hepatic NK cells (defined as the staining pattern of DX5+CD3–) at 1, 7, and 14 days (data not shown). Injections were well tolerated, as demonstrated by normal growth beyond 14 days in saline-injected mice receiving anti–NK cell or control serum. As expected, RRV infection resulted in persistent jaundice and 100% mortality by 15 days of life in mice receiving control serum. In contrast, loss of NK cells prevented the onset of RRV-induced jaundice and acholic stools in more than 90% of mice (Figure 6A), enabled normal growth (Figure 6B), and promoted long-term survival in more than 90% of mice (Figure 6C).
Figure 6. Improved outcome following RRV inoculation in NK cell–depleted mice.
Development of symptoms (A), weight gain (B), and survival (C) of neonatal mice after saline or RRV injection on the first day of life. Mice were also injected daily with NK cell–depleting serum or control serum. Saline, NK depleted: n = 10; RRV, NK depleted: n = 25; RRV, control serum: n = 16; *P < 0.001.
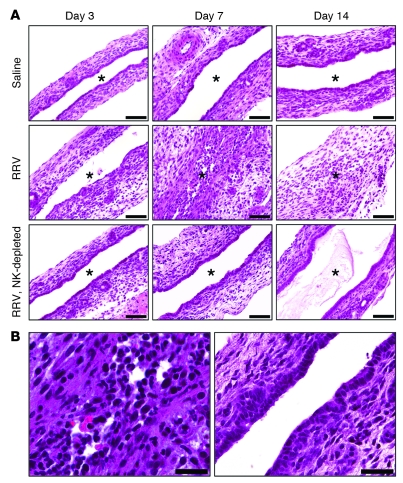
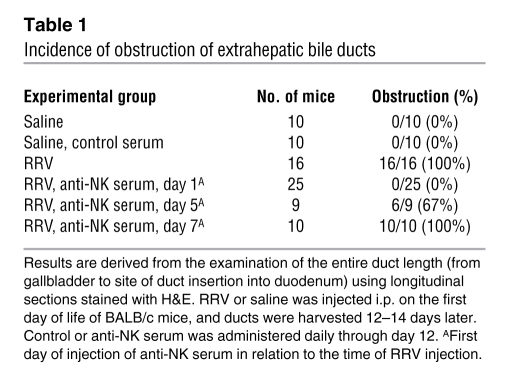
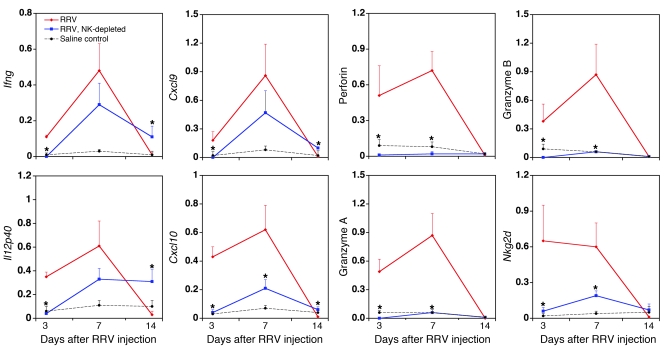
A detailed microscopic survey of extrahepatic bile ducts in all 4 groups revealed that NK cell depletion prevented the injury to the duct epithelium that is typically present 3 days after RRV inoculation (Figure 7). Further, mice showed no evidence of inflammation or obstruction of bile ducts at later time points, thus maintaining continuity of bile duct lumen between the liver and the duodenum (Figure 7). When initiation of injections for NK cell depletion was delayed to day 5 after RRV (which is after the onset of epithelial injury but before complete duct obstruction), 67% of mice showed obstruction of extrahepatic bile ducts at 12–14 days; when it was delayed to 7 days (time of duct obstruction and when mice become jaundiced), obstruction occurred in 100% of mice (Table 1). The absence of substantial histopathology in mice subjected to NK cell depletion within 1 day of RRV injection occurred despite the fact that there were similar amounts of RRV in the tissues of the 2 groups at 7 days (NK cell–depleted mice: 1.8 × 10⁶ ± 0.2 × 10⁶ FFU/100 mg of liver tissue versus control serum: 1.5 × 10⁶ ± 0.3 × 10⁶; P > 0.05). In fact, while control mice cleared the virus by 14 days, we found that viral titers increased in NK cell–depleted livers by 14 days (5.7 × 10⁶ ± 2.3 × 10⁶ FFU/100 mg of tissue versus no virus isolated from mice receiving control serum). Interestingly, the presence of RRV in livers of NK cell–depleted mice induced a hepatic mRNA expression of proinflammatory cytokines and chemokines to levels similar to (Ifng, Il12) or mildly suppressed (Cxcl9, Cxcl10) when compared with those in control serum–/RRV-injected mice, with a marked suppression of NK cell–enriched genes (Nkg2d, perforin, and granzymes; Figure 8). Taken together, these data demonstrate that although RRV may trigger a proinflammatory response independent of NK cells, the injury to the bile duct epithelium depends upon NK cells.
Figure 7. Prevention of bile duct injury and obstruction by NK cell depletion.
H&E staining of longitudinal sections of murine extrahepatic bile ducts at different time points after saline or RRV injection in the first day of life; the “RRV, NK depleted” group of mice was also injected daily with NK cell–depleting serum (A). (B) The photomicrograph on the left is a higher-magnification image of the middle panel in A showing the inflammatory obstruction of the duct lumen 7 days after RRV, while the photograph on the right shows the intact epithelium and unobstructed duct lumen 7 days after RRV infection of an NK cell–depleted mouse. Asterisks indicate the bile duct lumen. Scale bars: 50 μm.
Table 1 .
Incidence of obstruction of extrahepatic bile ducts
Figure 8. Expression of cytokines and chemokines after RRV infection.
Hepatic mRNA expression for Ifng, Il12p40, Cxcl9, Cxcl10, perforin, granzymes A and B, and Nkg2d at 3, 7, and 14 days after RRV injection into BALB/c mice and into NK cell–depleted BALB/c mice. The baseline level of mRNA expression is shown in saline-injected controls as dashed black lines. n = 3–4 per group and per time point; *P < 0.05.
Contact requirement for NK cell–induced lysis of cholangiocytes.
Contact-dependent cytotoxicity through the expression of cell-surface receptors is a key mechanism used by NK cells to injure target cells and minimize undesired bystander effects (22, 23). To determine whether NK cell–mediated cholangiocyte lysis requires direct contact/engagement, we modified the 51Cr release assays by including a Transwell membrane to prevent direct contact between the 2 cell types, while allowing for the exchange of soluble molecules secreted into the culture medium. In control wells, coculture without the membrane produced cholangiocyte lysis similar to the results in Figure 5; in contrast, separating the cell types with a membrane completely prevented cholangiocyte lysis, as demonstrated by less than 1% 51Cr release (or baseline level; data not shown).
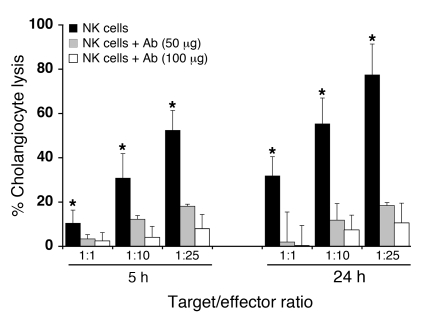
Based on the role of Nkg2d as a powerful activating receptor that regulates NK cell immune response and on its increased expression after RRV infection (see Figure 3A) and in affected human livers (see Figure 1B) (24), we quantified the expression of Nkg2d ligands by cholangiocytes and the liver. We found that cholangiocytes expressed the retinoic acid early transcript 1 (Rae1) ligands and that the liver overexpressed mRNA for the Rae1 family of genes, H60, and murine UL16-binding protein–like transcript 1 (Mult1) after RRV infection (Supplemental Figure 3). Next, to determine whether NK cells use Nkg2d-mediated signals to injure cholangiocytes, we preincubated RRV-primed hepatic NK cells with anti-Nkg2d blocking antibodies (anti-CX5 antibody) (25) prior to their use in 51Cr release assays; control IgG isotypes were used in separate wells as controls. We found that the antibody significantly suppressed cholangiocyte lysis after 5 hours, as well as in extended coculture (Figure 9). These data suggested that the expression of Nkg2d is an important mechanism used by NK cells to lyse mCL and raised the possibility that it may be critical for targeting RRV-infected cholangiocytes in vivo.
Figure 9. Block of cholangiocyte lysis by anti-Nkg2d antibodies.
Mean (±SD) percentage of 51Cr release by the murine cholangiocyte line mCL after 5 and 24 hours of coculture with hepatic NK cells purified 7 days after injection of RRV into 1-day-old mice. Hepatic NK cells were added directly to the culture or preincubated with 50 or 100 μg of blocking anti-Nkg2d antibodies before being added to the culture. The horizontal axis shows mCL (target) to NK (effector) cell ratios. n = 3 wells per group; results are representative of 2 independent experiments, with hepatic NK cells obtained from pools of 15–20 livers (*P < 0.01).
Prevention of RRV-induced epithelial injury by blocking Nkg2d.
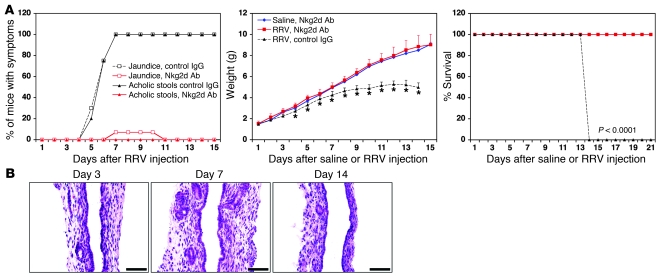
To directly examine the relevance of Nkg2d to RRV-induced biliary injury, we administered 100 μg of anti-Nkg2d blocking antibodies or isotype control daily to mice that were injected with RRV or saline in the first day of life. Administration of either type of antibody did not change the RRV-induced rise in hepatic CD3+CD4+ cells (mean ± SD: 52.8% ± 7.4% versus 59.5% ± 4.5% in Nkg2d-blocked mice, P > 0.05) or CD3+CD8+ cells (mean ± SD: 32.8% ± 2.9% versus 31.8% ± 1.5% in Nkg2d-depleted mice, P > 0.5) 7 days after infection. Interestingly, Nkg2d blocking also did not interfere with the typical rise in hepatic NK cells after RRV, the expression of the activation marker CD69 (Supplemental Figure 4, A and B) or the overexpression of the genes Ifng, Il12p40, Cxcl9, Cxcl10, perforin, and granzyme B following RRV (Supplemental Figure 5). Despite the increase in CD4+, CD8+, and NK cells, administration of anti-Nkg2d antibodies prevented the development of experimental biliary atresia, as demonstrated by clearance of jaundice, adequate growth throughout the suckling period, and long-term survival (Figure 10A). Microscopically, there was no evidence of bile duct epithelial injury, significant inflammation involving the duct wall, or obstruction of extrahepatic bile ducts after RRV inoculation (Figure 10B) — recapitulating the phenotype produced by NK cell depletion.
Figure 10. Improved outcome after blocking Nkg2d.
(A) Development of symptoms, weight gain, and survival after daily i.p. injections of 100 μg of anti-Nkg2d neutralizing antibodies (or IgG isotype control) into neonatal mice injected with saline or RRV on the first day of life. Saline, Nkg2d Ab: n = 8; RRV, Nkg2d Ab: n = 38; RRV, control IgG: n = 13. *P < 0.01. (B) H&E staining of representative longitudinal sections of murine extrahepatic bile ducts at different time points after injection of RRV on the first day of life, followed by the daily administration of 100 μg of blocking anti-Nkg2d antibodies. Scale bars: 50 μm.
Discussion
We found that NK cells populate the portal tracts of infants with biliary atresia at diagnosis, are the most abundant resident inflammatory cells in neonatal murine extrahepatic bile ducts, undergo activation, and increase in number during the process of duct obstruction in experimental biliary atresia. The relevance of these findings to pathogenesis of disease was further supported by complementary mechanistic studies in which we found that activated NK cells induced lysis of cholangiocytes in vitro and that either deprivation of the biliary ecosystem of NK cells or blocking of the Nkg2d receptor prevented epithelial injury and the obstructive phenotype typical of biliary atresia. Combined, these human and mouse data identify NK cells as key constituents of the biliary tract at the onset of symptoms (time of duct obstruction). Their biological function, however, is more temporally linked to early epithelial injury through direct contact with cholangiocytes engaging the Nkg2d receptor, thus providing insight into cellular and molecular events that regulate the initial phases of pathogenesis of biliary atresia.
The prevention of injury to the bile duct epithelium by the timely removal of NK cells suggests a key role for these cells in initiating tissue-specific injury. NK cells have long been recognized as resident liver cells and key responders to infectious challenges to the liver, providing signals for a T cell adaptive response through the expression of proinflammatory ligands (26–28). Our findings that NK cells are the most common resident inflammatory cells in the neonatal extrahepatic bile duct broaden the anatomical distribution of these cells during postnatal organ development and point to their potential function in balancing the local response to noxious challenges. Consistent with this function, the number of NK cells in the ducts substantially increased upon RRV challenge in the immediate postnatal period. This response aims at clearing infected cells, as supported by the ability of RRV-primed NK cells to promote lysis of cholangiocytes, one of the main cellular targets of neonatal RRV infection (8, 29). In doing so, NK cells disrupt the duct mucosa, produce proinflammatory signals, and promote an extension of the injury that leads to duct obstruction. When combined with the overexpression of cytotoxic markers in human livers, these findings suggest a causal relationship between the behavior of NK cells and triggering events in the pathogenesis of biliary atresia.
The maintenance of the mucosal integrity of extrahepatic bile ducts and the suppression of tissue inflammation by the removal of NK cells point to epithelial injury as being an early event in the pathogenesis of biliary atresia. Although previous studies reported a tropism of RRV to cholangiocytes and the ability of RRV to replicate and lyse cholangiocytes in vitro (8, 29), our data show that cholangiocyte infection alone is not sufficient to induce biliary atresia. Instead, it appears that infected cells are secondarily targeted by activated NK cells, which use the Nkg2d receptor to establish contact, injure cholangiocytes, and initiate a break in epithelial integrity. The ability of activated NK cells to also lyse an uninfected cholangiocyte cell line reported here raises the possibility that they may also injure neighboring uninfected cholangiocytes in vivo, perhaps via the recognition of cellular epitopes by molecular mimicry (5, 30). This has the potential to extend the mucosal injury and amplify the inflammatory response typical of biliary atresia.
NK cells are not the only effectors of epithelial injury. We reported previously that RRV-primed (but not naive) hepatic CD8+ cells can also lyse cholangiocytes in vitro, probably in a second wave of epithelial injury. In those studies, we found that the loss of CD8+ cells minimizes but does not fully abolish mucosal damage, still permitting an inflammatory infiltration of the duct wall that is not sufficient to obstruct the duct lumen (9). These concepts are consistent with a temporal and spatial coordination of cellular events that begin with viral infection of cholangiocytes, followed by the activation of NK cells. These, in turn, lead to contact-dependent injury of the infected epithelium and induce the adaptive immune system to generate a robust proinflammatory response. It is not clear whether these events are appropriate and proportional to the degree of virus infection or represent an out-of-proportion proinflammatory response of the immature neonatal immune system.
Neonatal immunity differs from that of adults quantitatively and qualitatively, with a transient balance skewed to a Th2 profile (15, 16). Although neonatal immune cells are able to mount an adequate cytotoxic response to Th1-inducing agents (31–33), the transient decrease in the number of T lymphocytes may render neonatal mice susceptible to an excessive inflammatory response. For example, 1- and 7-day-old mice injected with lipopolysaccharide overproduce TNF-α, monocyte chemotactic protein, and IL-6 and have increased mortality when compared with 2- and 10-week old mice (19). We have shown that, even if low in numbers in the immediate neonatal period, neonatal CD8+ cells are fully capable of mounting a proinflammatory program and promote an exuberant infiltration of inflammatory cells into extrahepatic bile ducts that obstruct the lumen (9). Either individually or in synergy, it is clear that neonatal NK and CD8+ cells effectively mount innate and adaptive responses that target the site of infection and ultimately produce a phenotype akin to a human disease in young infants. The search for an infectious etiology in biliary atresia has led to inconsistent results, variously implicating viruses such as rotavirus, reovirus, cytomegalovirus (2, 3). It is possible that this inconsistency is due to different sensitivities in techniques used to study tissues of affected infants. Alternatively, we favor the possibility that the difficulty in isolating an infectious agent is due to the ability of the neonatal immune system to effectively clear the infection (8, 29). It remains to be determined whether the atresia phenotype results from a hyperimmune response by NK or CD8+ cells that may be linked to the immaturity of counterregulatory circuits in the neonatal period.
In summary, analysis of livers of infants with biliary atresia and mechanistic studies in the RRV model identify NK cells as chief initiators of bile duct injury. The findings that depletion of NK cells or blocking of the Nkg2d receptor prevented both epithelial cell injury and the development of the atresia phenotype provide new insights into early cellular and molecular events driving the pathogenesis of this disease. Our data clearly show that an injury to the duct epithelium by NK cells must occur for a proinflammatory footprint to develop and for the atresia phenotype to emerge. These findings underscore the role of the developing immune system in the pathogenesis of biliary atresia and have implications for the development of new therapies that target individual or combined cell types or proinflammatory circuits to block progression of disease.
Methods
Human livers.
Liver samples were taken by wedge biopsy from 2- to 3-month-old infants undergoing intraoperative cholangiogram at the time of diagnosis of biliary atresia at Cincinnati Children’s Hospital Medical Center. Controls consisted of biopsy samples obtained from livers of deceased donors aged 2–3.5 years being used for transplantation at Children’s Memorial Hospital. Liver samples were used for gene expression studies and immunostaining. Acquisition and research use of the liver biopsies were approved by the institutional review boards of both institutions, and written informed consent was obtained from the patients’ guardians.
Mouse model of biliary atresia.
Induction of biliary atresia in neonatal BALB/c mice by the inoculation of 1.5 × 10⁶ FFU of RRV i.p. in the first day of life and phenotyping by the presence of icterus on non-fur-covered skin and acholic stools were done as described previously (8). For depletion of individual lymphocyte lineage, RRV- or saline-injected mice were i.p. administered 80 μg of rat anti-mouse CD4 (GK1.5) or CD8 (GK2.43) depleting antibodies, 30 μl of rabbit anti–asialo GM1 depleting serum (or nondepleting serum controls), or 100 μg of anti-Nkg2d (CX5) antibody (provided by Lewis L. Lanier, UCSF, San Francisco, California, USA) according to published protocols (9). At the time of sacrifice, the gross appearance of individual organs was recorded, livers were excised, extrahepatic bile duct and gallbladder were microdissected en bloc, and the tissues were either used for isolation of mononuclear cells, formalin fixation, and paraffin embedding or snap-frozen in liquid nitrogen according to experimental designs. The number of mice in each experiment is presented in Results, in the table, or in figure legends. The Institutional Animal Care and Use Committee of the Cincinnati Children’s Research Foundation approved all animal protocols.
Flow cytometric analysis and cytokine staining.
At the time of sacrifice, neonatal livers were cleared of blood by the infusion of PBS through the portal vein. Then, mononuclear cells were isolated from livers or from extrahepatic bile ducts/gallbladders by gentle mincing, passage through a 40-μm cell strainer, centrifugation at 270 g at 4°C, and red blood cell lysis as described previously (9). Neonatal bile ducts/gallbladders were processed as groups of 15–20 owing to their very small sizes. NK cells were purified by using MACS CD49b (DX5) Microbeads and MidiMACS Separator (Miltenyi Biotec). Cellular phenotyping based on cell-surface markers was performed as described previously (8, 9) using the following fluorochrome-conjugated, species-specific antibodies: FITC-, PE-, or allophycocyanin (APC)-conjugated anti-NK (CD49b; DX5, IgM), anti-CD3 (17A2, IgG2b), anti-CD4 (RM4-4, IgG2b), anti-CD8a (53-6.7, IgG2a), and anti-CD19 (1D3, IgG2a) purchased from BD Biosciences; and anti–neutrophil CD11b (M1/70, IgG2b) and Gr-1 (RB6-8C5, IgG2b) and anti–macrophage CD11b (M1/70, IgG2b) and F4/80 (BM8, IgG2a) purchased from eBioscience. Rat monoclonal anti–mouse Nkg2d (191004, IgG2b) and rat monoclonal anti–mouse pan-specific Rae1 (186107, IgG2a) were purchased from R&D Systems.
Intracellular cytokine staining was performed using the Cytofix/Cytoperm (with GolgiPlug) kit according to the manufacturer’s instructions (BD Biosciences) and then stained with PE-conjugated anti-Ifnγ (XMG1.2, IgG1), anti-Tnfα (MP6-XT22, IgG1) (BD Biosciences), anti–granzyme B (16G6, IgG2b), and anti-perforin (eBioOMAK-D, IgG2a) (eBioscience) antibodies or the respective isotype controls. Stained cells were analyzed in a FACSCalibur dual-laser flow cytometer (BD Biosciences), and at least 50,000 (for surface staining) or 150,000 (for intracellular staining) events were acquired for livers and 10,000 events for bile ducts. Data were analyzed using FlowJo software (Tree Star), with cell populations selected according to forward/side scatter (away from cell debris and dead cells), gated according to isotype controls to account for background fluorescence, and subjected to secondary analysis based on fluorescence signals by individual antibodies. For histograms, gates were established using signals from cell-surface markers; median fluorescence intensity was determined according to the costaining of selected cytokines; and the overlays of graphs were scaled to the number of events in a specific quadrant (represented as “% of maximum” in Figure 3A) (9).
Gene expression.
RNA was isolated from livers, extrahepatic bile duct/gallbladder, or purified NK cells from RRV- or saline-injected mice using the RNeasy Mini Kit, according to the manufacturer’s protocol (QIAGEN). The same procedure was used for RNA isolation from human livers. RNA integrity was verified by the 260:280 ratios and agarose gel electrophoresis, and the samples were reverse transcribed and used in real-time quantitative PCR (qPCR) as described previously (9). The primers and qPCR cycling parameters to quantify expression of murine Ifng, Tnfa, Il12p40, Cxcl9, Cxcl10, Nkg2d, perforin, granzymes A and B, Rae1a, Rae1b, Rae1g, Rae1d, Rae1e, Mult1, and H60 and human CD69, CRTAM, SLAM, granzymes A and B, NKG7, FCGR3B, KLRC2, KLRC4, ULBP1, ULBP2, ULBP3, KLRF1, MICB, NCR1, NCR2, and NCR3 are listed in Supplemental Table 2.
NK cytotoxicity to cholangiocytes.
Hepatic NK cell–induced lysis of cholangiocytes was measured in a chromium release assay using 51Cr and the murine cholangiocyte cell line mCL in various effector/target ratios as described previously (9); the cell lines H2.35 (hepatocytes; ATCC-1995), MLE-12 (lung epithelial cells; ATCC-2110), and 4T1-MZ and 67-NR (mouse breast tumor epithelial cells, provided by David Manka, University of Cincinnati College of Medicine) were used as controls. To determine whether cell-cell contact was necessary for NK-mediated cytotoxicity, the assay was modified by using a 96-well Transwell apparatus with a 0.4-μm pore size (Millipore) separating NK cells (in the Transwell chamber) from 51Cr-labeled mCL (in the bottom chamber). For experiments testing the role of Nkg2d on cell lysis, the anti–mouse Nkg2d antibody (CX5) or its isotype (rat IgG1) was incubated with hepatic NK cells at a concentration of 50 or 100 μg/ml for 1 hour at 37°C before the cells were used in the lysis assay. All assays were done in triplicate wells.
Histopathology and immunofluorescence staining.
Paraffin-embedded sections of livers and extrahepatic bile ducts were examined after staining with H&E. Cryostat sections from frozen human liver biopsies were fixed with acetone; submitted to blocking of nonspecific binding by using normal goat serum; and incubated with rabbit anti–cow cytokeratin antibody (Dako) to stain cholangiocytes, with mouse anti–human CD56 antibody (clone NCAM16.2; BD Biosciences) to stain NK cells, or with anti–human CD3 antibody (CD3complex; Dako) to stain T cells. Specific signals were detected using FITC-conjugated goat anti-rabbit and Texas red–conjugated anti-mouse secondary antibodies (Jackson ImmunoResearch Laboratories Inc.). Images were captured using either a Zeiss Axiophot 2 microscope or an Olympus BX51 microscope with appropriate filters.
Statistics.
Values are expressed as mean ± SD, and statistical significance was determined by unpaired 2-tailed t test, with a significance set at P < 0.05. Survival curves were created using the method of Kaplan and Meier utilizing GraphPad Prism (GraphPad Software).
Supplementary Material
Acknowledgments
We thank Lewis L. Lanier for providing the anti-Nkg2d (CX5) antibody, David Manka for providing the 4T1-MZ and 67-NR cell lines, and William Balistreri and Kasper Hoebe (both of Cincinnati Children’s Hospital Medical Center and the University of Cincinnati College of Medicine) for reviewing the manuscript and providing insightful comments. This work was supported by NIH grants DK-064008 (to J.A. Bezerra) and DK-078392 (Integrative Morphology Core, Digestive Disease Research Core Center).
Footnotes
Conflict of interest: The authors have declared that no conflict of interest exists.
Nonstandard abbreviations used: FFU, focus-forming unit(s); Nkg2d, natural killer group 2d; Rae, retinoic acid early transcript; RRV, rhesus rotavirus.
Citation for this article: J. Clin. Invest. 119:2281–2290 (2009). doi:10.1172/JCI38879
References
- 1.Balistreri W.F., et al. Biliary atresia: current concepts and research directions. Summary of a symposium. Hepatology. 1996;23:1682–1692. doi: 10.1002/hep.510230652. [DOI] [PubMed] [Google Scholar]
- 2.Mack C.L. The pathogenesis of biliary atresia: evidence for a virus-induced autoimmune disease. Semin. Liver Dis. 2007;27:233–242. doi: 10.1055/s-2007-985068. [DOI] [PMC free article] [PubMed] [Google Scholar]
- 3.Sokol R.J., et al. Screening and outcomes in biliary atresia: summary of a National Institutes of Health workshop. Hepatology. 2007;46:566–581. doi: 10.1002/hep.21790. [DOI] [PMC free article] [PubMed] [Google Scholar]
- 4.Bezerra J.A., et al. Genetic induction of proinflammatory immunity in children with biliary atresia. Lancet. 2002;360:1653–1659. doi: 10.1016/S0140-6736(02)11603-5. [DOI] [PubMed] [Google Scholar]
- 5.Mack C.L., et al. Oligoclonal expansions of CD4+ and CD8+ T-cells in the target organ of patients with biliary atresia. Gastroenterology. 2007;133:278–287. doi: 10.1053/j.gastro.2007.04.032. [DOI] [PMC free article] [PubMed] [Google Scholar]
- 6.Mack C.L., et al. Biliary atresia is associated with CD4+ Th1 cell-mediated portal tract inflammation. Pediatr. Res. 2004;56:79–87. doi: 10.1203/01.PDR.0000130480.51066.FB. [DOI] [PMC free article] [PubMed] [Google Scholar]
- 7.Shinkai M., Shinkai T., Puri P., Stringer M.D. Increased CXCR3 expression associated with CD3-positive lymphocytes in the liver and biliary remnant in biliary atresia. J. Pediatr. Surg. 2006;41:950–954. doi: 10.1016/j.jpedsurg.2006.01.060. [DOI] [PubMed] [Google Scholar]
- 8.Shivakumar P., et al. Obstruction of extrahepatic bile ducts by lymphocytes is regulated by IFN-gamma in experimental biliary atresia. J. Clin. Invest. 2004;114:322–329. doi: 10.1172/JCI21153. [DOI] [PMC free article] [PubMed] [Google Scholar]
- 9.Shivakumar P., et al. Effector role of neonatal hepatic CD8+ lymphocytes in epithelial injury and autoimmunity in experimental biliary atresia. Gastroenterology. 2007;133:268–277. doi: 10.1053/j.gastro.2007.04.031. [DOI] [PMC free article] [PubMed] [Google Scholar]
- 10.Mack C.L., Tucker R.M., Sokol R.J., Kotzin B.L. Armed CD4+ Th1 effector cells and activated macrophages participate in bile duct injury in murine biliary atresia. Clin. Immunol. 2005;115:200–209. doi: 10.1016/j.clim.2005.01.012. [DOI] [PMC free article] [PubMed] [Google Scholar]
- 11.Adkins B., Leclerc C., Marshall-Clarke S. Neonatal adaptive immunity comes of age. Nat. Rev. Immunol. 2004;4:553–564. doi: 10.1038/nri1394. [DOI] [PubMed] [Google Scholar]
- 12.Forsthuber T., Yip H.C., Lehmann P.V. Induction of TH1 and TH2 immunity in neonatal mice. Science. 1996;271:1728–1730. doi: 10.1126/science.271.5256.1728. [DOI] [PubMed] [Google Scholar]
- 13.Ridge J.P., Fuchs E.J., Matzinger P. Neonatal tolerance revisited: turning on newborn T cells with dendritic cells. Science. 1996;271:1723–1726. doi: 10.1126/science.271.5256.1723. [DOI] [PubMed] [Google Scholar]
- 14.Sarzotti M., Robbins D.S., Hoffman P.M. Induction of protective CTL responses in newborn mice by a murine retrovirus. Science. 1996;271:1726–1728. doi: 10.1126/science.271.5256.1726. [DOI] [PubMed] [Google Scholar]
- 15.Adkins B. Development of neonatal Th1/Th2 function. Int. Rev. Immunol. 2000;19:157–171. doi: 10.3109/08830180009088503. [DOI] [PubMed] [Google Scholar]
- 16.Garcia A.M., Fadel S.A., Cao S., Sarzotti M. T cell immunity in neonates. Immunol. Res. 2000;22:177–190. doi: 10.1385/IR:22:2-3:177. [DOI] [PubMed] [Google Scholar]
- 17.Siegrist C.A. Vaccination in the neonatal period and early infancy. Int. Rev. Immunol. 2000;19:195–219. doi: 10.3109/08830180009088505. [DOI] [PubMed] [Google Scholar]
- 18.Kim K.D., et al. Adaptive immune cells temper initial innate responses. Nat. Med. 2007;13:1248–1252. doi: 10.1038/nm1633. [DOI] [PMC free article] [PubMed] [Google Scholar]
- 19.Zhao J., et al. Hyper innate responses in neonates lead to increased morbidity and mortality after infection. Proc. Natl. Acad. Sci. U. S. A. 2008;105:7528–7533. doi: 10.1073/pnas.0800152105. [DOI] [PMC free article] [PubMed] [Google Scholar]
- 20.Davenport M., et al. Immunohistochemistry of the liver and biliary tree in extrahepatic biliary atresia. J. Pediatr. Surg. 2001;36:1017–1025. doi: 10.1053/jpsu.2001.24730. [DOI] [PubMed] [Google Scholar]
- 21.Osaki T., et al. IFN-gamma-inducing factor/IL-18 administration mediates IFN-gamma- and IL-12-independent antitumor effects. J. Immunol. 1998;160:1742–1749. [PubMed] [Google Scholar]
- 22.Newman K.C., Riley E.M. Whatever turns you on: accessory-cell-dependent activation of NK cells by pathogens. Nat. Rev. Immunol. 2007;7:279–291. doi: 10.1038/nri2057. [DOI] [PubMed] [Google Scholar]
- 23.Vivier E., Tomasello E., Baratin M., Walzer T., Ugolini S. Functions of natural killer cells. Nat. Immunol. 2008;9:503–510. doi: 10.1038/ni1582. [DOI] [PubMed] [Google Scholar]
- 24.Eagle R.A., Trowsdale J. Promiscuity and the single receptor: NKG2D. Nat. Rev. Immunol. 2007;7:737–744. doi: 10.1038/nri2144. [DOI] [PubMed] [Google Scholar]
- 25.Ogasawara K., et al. Impairment of NK cell function by NKG2D modulation in NOD mice. Immunity. 2003;18:41–51. doi: 10.1016/S1074-7613(02)00505-8. [DOI] [PubMed] [Google Scholar]
- 26.Itoh Y., et al. Time course profile and cell-type-specific production of monokine induced by interferon-gamma in Concanavalin A-induced hepatic injury in mice: comparative study with interferon-inducible protein-10. Scand. J. Gastroenterol. 2001;36:1344–1351. doi: 10.1080/003655201317097236. [DOI] [PubMed] [Google Scholar]
- 27.McIntyre K.W., Welsh R.M. Accumulation of natural killer and cytotoxic T large granular lymphocytes in the liver during virus infection. . J. Exp. Med. 1986;164:1667–1681. doi: 10.1084/jem.164.5.1667. [DOI] [PMC free article] [PubMed] [Google Scholar]
- 28.Salazar-Mather T.P., Orange J.S., Biron C.A. Early murine cytomegalovirus (MCMV) infection induces liver natural killer (NK) cell inflammation and protection through macrophage inflammatory protein 1alpha (MIP-1alpha)-dependent pathways. J. Exp. Med. 1998;187:1–14. doi: 10.1084/jem.187.1.1. [DOI] [PMC free article] [PubMed] [Google Scholar]
- 29.Allen S.R., et al. Effect of rotavirus strain on the murine model of biliary atresia. J. Virol. 2007;81:1671–1679. doi: 10.1128/JVI.02094-06. [DOI] [PMC free article] [PubMed] [Google Scholar]
- 30.Mack C.L., et al. Cellular and humoral autoimmunity directed at bile duct epithelia in murine biliary atresia. Hepatology. 2006;44:1231–1239. doi: 10.1002/hep.21366. [DOI] [PMC free article] [PubMed] [Google Scholar]
- 31.Bot A., Bot S., Bona C. Enhanced protection against influenza virus of mice immunized as newborns with a mixture of plasmids expressing hemagglutinin and nucleoprotein. Vaccine. 1998;16:1675–1682. doi: 10.1016/S0264-410X(98)00054-1. [DOI] [PubMed] [Google Scholar]
- 32.Brazolot Millan C.L., Weeratna R., Krieg A.M., Siegrist C.A., Davis H.L. CpG DNA can induce strong Th1 humoral and cell-mediated immune responses against hepatitis B surface antigen in young mice. Proc. Natl. Acad. Sci. U. S. A. 1998;95:15553–15558. doi: 10.1073/pnas.95.26.15553. [DOI] [PMC free article] [PubMed] [Google Scholar]
- 33.Hassett D.E., Zhang J., Slifka M., Whitton J.L. Immune responses following neonatal DNA vaccination are long-lived, abundant, and qualitatively similar to those induced by conventional immunization. J. Virol. 2000;74:2620–2627. doi: 10.1128/jvi.74.6.2620-2627.2000. [DOI] [PMC free article] [PubMed] [Google Scholar]
Associated Data
This section collects any data citations, data availability statements, or supplementary materials included in this article.


