

Abstract
We have analyzed US AD mortality rates 1999-2004, after 10th ICD Revision coding made AD death certificate reporting more accurate. Age-standardized rates were calculated by year, age, sex, race, ethnicity, education, marital status, and geography. AD mortality increased 31% from 1999 to 2004. AD rates were higher in the northwest and the southeast. Stroke mortality shows a similar pattern; the correlation in state rates between stroke and AD is 0.79. Female AD mortality was 28% higher than male mortality. Whites had 56% higher rates than non-whites, and non-Hispanics had a 72% higher rate than Hispanics. Both less education and single marital status were associated with higher rates. The correlation between state rates for stroke and AD mortality could be due to artifacts of coding, or a true relationship, given that stroke is a risk factor for subsequent AD. While AD mortality in the US has been increasing over time it is not known whether incidence is increasing, due to lack of recent incidence data. AD reporting on death certificates is known to be poor. This is the first analysis of recent trends in AD mortality since the advent of ICD-10.
Keywords: Alzheimer's disease, mortality, stroke
Introduction
Alzheimer's disease (AD) affects 10% of the population over age 651. It is estimated that there are now more than 5.1 million persons with AD in the United States, and by 2050, this number will increase to somewhere in the range of 11-16 million2. AD is characterized by substantial cognitive deficits in at least two domains (including memory) of sufficient severity to impair normal activities3,4. It is thought that there is widespread under-ascertainment of AD, with estimates that fewer than 50% of cases are diagnosed1.
Previous reports on AD mortality have been based on data during the 1980s and 1990s have shown that AD mortality rates were increasing over time5-6. However, the reports defined AD as code 331.0 based on the 9th revision of the International Classification of Disease (ICD). This tended to under-estimate the occurrence of AD, since some AD was classified as other disorders, notably pre-senile dementia (ICD code 290.1). Consolidation of AD into a single code (G30) took place in ICD-107,8, which was implemented nationally in the US in 1999. For example, a death certificate reading “Alzheimer's dementia” or “Alzheimer's-type dementia” was coded under ICD-9 rules to pre-senile dementia under ICD-9; nearly all death certificates coded to pre-senile dementia under ICD-9 would be expected to be coded to AD (code G30) under ICD-107. In 1998, the last year of ICD-9, there were 22,725 US deaths from AD, and 15,672 deaths from pre-senile dementia (CDC Wonder). In 1999, the first year of ICD-10, there were 44,535 deaths from AD (ICD-10 code G30). To our knowledge there have been no comprehensive published reports of AD mortality rates since the inception of ICD-10.
Incidence data for Alzheimer's disease is limited in the US, while mortality data is readily available. We have analyzed data from both the underlying cause of death and the multiple causes of death listed on the death certificates, for the United States from 1999 to 2004. We describe AD mortality by year, age, race, ethnicity, sex, education, marital status, and geographical region.
Materials and Methods
Numerator data came from the National Center for Health Statistics (NCHS) multiple cause-of-death public-use data files, for 1999 to 2004. Reported Alzheimer's disease (ICD-10 G30) deaths, based on either underlying cause of death, or as “multiple-cause” of death (underlying or contributing cause, on the entity axis) were used in this analysis. The U.S. Standard Certificate of Death allows the recording of a single “underlying cause of death,” which is commonly defined as the disease or injury initiating the train of events leading directly to death. In addition, each certificate may list up to 20 additional disease and conditions as “contributing causes” of death, and together these causes are referred to as “multiple causes of death.” We here present data on both underlying-cause and multiple cause AD mortality, but the focus is one underlying cause analyses.
We calculated age-adjusted mortality rates by sex, race, education, ethnicity, and marital status, using the appropriate U.S. population as denominators. Annual estimates of age and sex-specific populations were taken from between census population estimates and 2000 U.S. Census data9-10. Annual estimates of age, sex, and race-specific populations were taken from NCHS bridged-race population estimates on CDC Wonder (www.wonder.cdc.gov). Annual estimates of population stratified by educational attainment and marital status were taken from the American Community Survey Microdata Sample File 2000-2004 (PUMS). This survey is conducted by the US Census Bureau and provides additional data not available from the year 2000 census itself (www.census.gov/acs/www/index.html). Data on education and marital status were available from this data set for the years 2000-2004, but were unavailable for 1999. All mortality rates were standardized to the 2000 U.S. population via direct standardization using five year age groups. In addition, mortality rates were also standardized by race and sex. In some instances we have calculated standardized rates over the entire six year study period (eg, when presenting data on gender, race, education, and marital status), in which case we summed age, race, and sex-specific numerator and denominator data across all six years, and then standardized.
We also used the above data to conduct Poisson regression to analyze the effects of calendar year, age, race, education, marital status, ethnicity, and race simultaneously, for the years 2000 to 2004. Poisson regression was conducted using SAS (PROC GENMOD). Data were cross-classified by all the above-mentioned factors, the observed number of deaths were considered as Poisson variates, and the denominators were used as an offset.
We also calculated the Pearson correlation coefficient between age-adjusted AD and stroke mortality rates (underlying cause) for the period 1999-2004, weighting the correlation by the size of the state population during those years (summed across the years).
Results
Underlying and Multiple Cause of Death
Alzheimer's disease mortality rates have continued to increase from 1999 through 2004, as both an underlying and multiple cause death (Figure 1). The age-standardized mortality rate of Alzheimer's disease as the underlying cause of death increased from 15.9 per 100,000 in 1999, to 20.9 per 100,000 in 2004 (31% increase); as of 2004 AD was the 7th leading cause of death. The corresponding age-standardized mortality rate for Alzheimer's disease as a multiple causes of death (underlying and contributory causes combined) increased from 28.2 per 100,000 in 1999 to 32.0 per 100,000 in 2004 (13% increase). Both these increases were statistically significant at the p<0.05 level. During this same period the age-adjusted rate of death from all causes combined declined 9%, indicating that the increase in AD mortality was in contrast to most other causes of death whose rates were decreasing.
Figure 1.

Age-adjusted underlying and multiple-cause AD death rates, United States.
Stroke and diabetes have been identified as two risk factors for AD11,12. During the period 1999-2004 the Centers for Disease Control reported that diabetes incidence increased 30% (from 5.6 to 7.3/1000) (http://www.cdc.gov/diabetes/statistics/incidence/fig2.htm), although diabetes death rates showed little change in this period. Stroke incidence has been generally declining over the last 50 years13, but are there are few published incidence data for recent years. One longitudinal study of hospitalization for stroke (n=41,947) based on Medicare records has shown a 21% increase in admissions for stroke from 1984-1990 to 1991-200114.
Geographic Distribution (underlying cause analyses)
Alzheimer's disease mortality rates (underlying cause, adjusted for age, race, and sex) for 1999-2004 show some evidence of geographical clustering in the northwest and the southeast (Figure 2 and Table 1). The highest mortality rates were observed in Washington (33.7 per 100,000) and Maine (31.0 per 100,000 standard population), while the lowest mortality rates were in New York (8.2 per 100,000 standard population) and Connecticut (12.5 per 100,000 standard population). The large range of rates (more than 4 fold) across states is remarkable.
Figure 2.

Alzheimer's disease mortality rates (underlying cause, adjusted for age, race, sex) by state, United States: 1999-2004.
Table 1.
Alzheimer's disease deaths and death rates by State, US 1999-2004.
| State | AD Deaths (underlying cause) | Denominator | Standardized AD rate per 100,000* | Standardized stroke rate per 100,000* |
|---|---|---|---|---|
| United States | 336,232 | 1,729,015,539 | 19.1 | 55.4 |
| Washington | 12,234 | 36,148,745 | 33.7 | 62.4 |
| Maine | 2,858 | 7,755,042 | 31.0 | 55.4 |
| South Carolina | 5,707 | 24,512,099 | 26.5 | 70.3 |
| Louisiana | 6,013 | 26,883,455 | 26.1 | 59.7 |
| California | 32,855 | 208,378,606 | 26.1 | 73.1 |
| Oregon | 6,349 | 20,981,365 | 26.0 | 67.0 |
| Wyoming | 688 | 2,987,865 | 25.9 | 54.3 |
| North Dakota | 1,531 | 3,823,290 | 25.5 | 56.7 |
| Alabama | 6,612 | 26,865,465 | 25.1 | 66.4 |
| North Carolina | 11,262 | 49,500,300 | 25.0 | 68.1 |
| Arizona | 7,927 | 32,248,759 | 24.8 | 47.9 |
| Colorado | 5,085 | 26,627,439 | 24.4 | 52.8 |
| Georgia | 8,599 | 50,712,912 | 24.2 | 64.9 |
| Kentucky | 5,606 | 24,488,923 | 23.0 | 64.5 |
| New Hampshire | 1,772 | 7,585,562 | 22.5 | 49.2 |
| Tennessee | 7,496 | 34,628,249 | 22.4 | 71.5 |
| Idaho | 1,815 | 8,000,069 | 22.2 | 58.2 |
| Texas | 21,600 | 129,158,827 | 22.1 | 62.4 |
| Montana | 1,421 | 5,462,940 | 21.7 | 56.6 |
| Alaska | 280 | 3,829,228 | 21.4 | 58.9 |
| Vermont | 917 | 3,684,825 | 21.0 | 46.4 |
| Indiana | 8,088 | 36,860,113 | 21.0 | 62.2 |
| Kansas | 4,088 | 16,245,406 | 20.7 | 58.6 |
| Minnesota | 7,076 | 29,983,108 | 20.5 | 52.6 |
| Iowa | 5,092 | 17,608,865 | 20.1 | 57.1 |
| Virginia | 7,509 | 43,388,412 | 20.1 | 60.5 |
| Ohio | 15,189 | 68,394,204 | 20.0 | 57.1 |
| Wisconsin | 7,790 | 32,536,646 | 20.0 | 58.8 |
| Mississippi | 3,035 | 17,188,661 | 19.9 | 64.7 |
| Oklahoma | 4,288 | 20,876,203 | 19.3 | 65.9 |
| Utah | 1,912 | 13,788,708 | 19.3 | 55.1 |
| Nebraska | 2,494 | 10,347,969 | 19.0 | 55.9 |
| Massachusetts | 9,000 | 38,324,302 | 18.5 | 46.3 |
| West Virginia | 2,441 | 10,853,083 | 18.4 | 59.7 |
| New Mexico | 1,833 | 11,098,907 | 18.1 | 45.4 |
| Michigan | 11,203 | 60,095,396 | 18.1 | 56.3 |
| Rhode Island | 1,562 | 6,375,357 | 17.9 | 44.3 |
| Missouri | 6,977 | 33,964,361 | 17.8 | 61.0 |
| Illinois | 13,844 | 75,265,060 | 17.6 | 56.1 |
| Maryland | 5,076 | 32,457,366 | 17.4 | 55.1 |
| Delaware | 782 | 4,811,699 | 17.3 | 48.0 |
| South Dakota | 1,074 | 4,560,602 | 16.9 | 54.2 |
| Arkansas | 3,041 | 16,210,407 | 16.7 | 73.5 |
| District of Columbia | 548 | 3,386,452 | 16.4 | 38.3 |
| Florida | 22,642 | 99,239,305 | 16.1 | 47.0 |
| Pennsylvania | 16,539 | 73,954,072 | 16.0 | 53.6 |
| Nevada | 1,434 | 12,793,449 | 15.7 | 56.0 |
| New Jersey | 8,553 | 51,218,013 | 14.7 | 43.0 |
| Hawaii | 822 | 7,390,529 | 13.7 | 48.6 |
| Connecticut | 3,414 | 20,681,476 | 12.5 | 44.9 |
| New York | 10,259 | 114,557,909 | 8.2 | 36.8 |
Standardized for race, sex, and age, using the US 2000 population as the standard; both AD and stroke rates are for underlying cause
Mortality from stroke (ICD 10th revision code I60-I69) shows a similar geographical pattern as AD mortality, whether mapped at the county level (data from 1999-2003 from the CDC, see www.cdc.gov/DHDSP/library/fs_stroke.htm) or at the state level (Figure 3, data for 1999-2004 from CDC Wonder, www.wonder.cdc.gov). The correlation between state rates for AD mortality and stroke mortality during the period 1999-2004 is a surprisingly high 0.79, adjusted for age, race, and gender, and weighted by state population. CDC data on stroke prevalence15 also shows a concentration in the southeast (the ‘stroke belt’). However, in contrast to stroke mortality, stroke prevalence fails to show any concentration in the northwest.
Figure 3.

Stroke (underlying cause) mortality in the US from 1999-2004
Diabetes, another risk factor for AD, also shows a concentration in prevalence in the southeast (http://apps.nccd.cdc.gov/brfss/), although neither diabetes prevalence nor mortality shows any concentration in the northwest.
Demographic Risk Factors (underlying cause analyses)
The most important risk factor for death from Alzheimer's disease is age. Mortality rates (underlying cause) increase dramatically with age, from 0.7 per 100,000 among persons 45-49 years of age, to 1,095.4 per 100,000 for persons 85 years of age and over (Figure 4).
Figure 4.
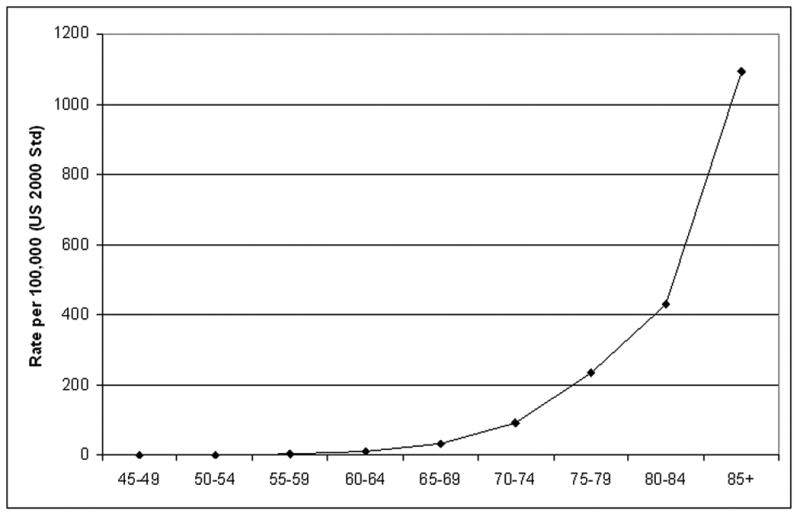
Mortality rate (underlying cause) for Alzheimer's disease by age, United States, 1999-2004.
In addition, the risk of dying from Alzheimer's disease is higher for women than for men (Table 2). The age-adjusted mortality rate for women (1999-2004) was 20.4 per 100,000, significantly elevated over men which had the mortality rate was 16.0 per 100,000 (28% higher). The difference between females and males has increased since an earlier analysis of US AD death rates in 1996, when the women had 7% higher rates6.
Table 2.
Age-adjusted mortality rates per 100,000 for Alzheimer's disease by race and sex: United States, 1999-2004*.
| Number Deaths | Mortality Rate All Races | Mortality Rates Whites | Mortality Rates Non-Whites | |||||||
|---|---|---|---|---|---|---|---|---|---|---|
| Both Sexes | Male | Female | Both Sexes | Male | Female | Both Sexes | Male | Female | ||
| <45 years | 57 | 0.3 | 0.4 | 0.3 | 0.4 | 0.4 | 0.3 | 0.3 | 0.3 | 0.2 |
| 45-49 years | 123 | 0.7 | 0.6 | 0.8 | 0.8 | 0.7 | 0.9 | 0.4 | 0.4 | 0.4 |
| 50-54 years | 305 | 1.7 | 1.7 | 1.8 | 1.9 | 1.8 | 2.0 | 0.8 | 0.9 | 0.7 |
| 55-59 years | 871 | 4.7 | 4.3 | 5.1 | 5.2 | 4.7 | 5.7 | 2.2 | 2.3 | 2.1 |
| 60-64 years | 2,203 | 12.3 | 11.7 | 12.8 | 13.2 | 12.4 | 13.9 | 6.8 | 7.1 | 6.5 |
| 65-69 years | 5,478 | 32.1 | 30.8 | 33.2 | 33.4 | 31.9 | 34.7 | 23.9 | 23.4 | 24.3 |
| 70-74 years | 15,658 | 94.2 | 91.6 | 96.2 | 97.7 | 94.3 | 100.4 | 68.6 | 70.0 | 67.7 |
| 75-79 years | 40,457 | 239.3 | 226.1 | 248.7 | 247.1 | 233.1 | 257.1 | 174.6 | 162.8 | 182.0 |
| 80-84 years | 74,369 | 417.6 | 384.5 | 437.4 | 431.9 | 396.9 | 453.2 | 283.7 | 262.7 | 295.4 |
| 85+ years | 196,760 | 1,098.6 | 850.1 | 1,204.5 | 1,141.5 | 883.2 | 1,251.6 | 694.1 | 539.1 | 760.3 |
| All Ages | 336,281 | 19.0 | 16.0 | 20.4 | 19.7 | 16.6 | 21.2 | 12.6 | 10.7 | 13.4 |
age-adjustment using the US 2000 population as the standard, all years combined 1999-2004
Age-adjusted Alzheimer's disease mortality rates were significantly higher for whites than for non-whites (Table 2)(56% higher, 19.7 per 100,000 for white vs 12.6 per 100,000 for non-whites (85% of whom are African-American)). This finding is similar to an earlier finding based on 1996 US mortality data, in which whites have a 47% higher rate than blacks6. Non-Hispanics in our data had a 72% higher AD rate (19.1/100,000) than Hispanics (11.1/100,000).
Data for education and marital status are shown in Figures 5 and 6, respectively. Figure 5 shows that those with a less than college education had a 17% higher AD death rate than those with at least some college (22.9 per 100,000 vs. 19.6 per 100,000, respectively). Similarly Figure 6 shows that unmarried individuals of either sex had higher rates than married individuals. The unmarried had an 61% higher age-adjusted AD death rate than the married (26.7 per 100,000 vs. 16.6 per 100,000).
Figure 5.

Age-adjusted mortality rate (underlying cause) for Alzheimer's disease by educational attainment, United States: 2000-2004
Figure 6.

Age-adjusted mortality rate (underlying cause) for Alzheimer's disease by sex and marital status, United States: 2000-2004
Multivariate results (underlying cause analyses)
Poisson regression results combining the demographic risk factors discussed above are shown in Table 3. Results for individual risk factors in this Table are adjusted for all other risk factors. Clearly age has strongest influence, with the very large rate increases from lowest to highest age category. The same patterns seen in the Figures and earlier Tables are seen here for sex, race, ethnicity, marital status, and education, with all of these risk factors being statistically significant at the p=0.05 level.
Table 3.
Poisson Regression Results
| Variable | Rate ratio | 95% CI |
|---|---|---|
| Age | ||
| <60 years | Referent | |
| 60-64 years | 34.47 | 25.28-47.47 |
| 65-69 years | 103.54 | 79.04-137.00 |
| 70-74 years | 311.06 | 239.85.403.43 |
| 75-79 years | 925.19 | 713.37-1187.97 |
| 80-84 years | 2344.90 | 1826.21-3010.92 |
| 85+ years | 8103.08 | 6310.69-10404.57 |
| Year | ||
| 2000 | Referent | |
| 2001 | 1.09 | 1.03–1.15 |
| 2002 | 1.17 | 1.12–1.23 |
| 2003 | 1.22 | 1.16–1.27 |
| 2004 | 1.25 | 1.19–0.31 |
| Sex | ||
| Male | Referent | |
| Female | 1.20 | 1.16-1.26 |
| Race | ||
| White | 2.05 | 1.93-2.18 |
| Non-white | Referent | |
| Ethnicity | ||
| Hispanic | 0.61 | 0.55-0.66 |
| Non-Hispanic | Referent | |
| Marital Status | ||
| Married | Referent | |
| Non-married | 1.42 | 1.36-1.48 |
| Education | ||
| 0-8 years | 1.25 | 1.20-1.31 |
| 9-12 years | 1.15 | 1.15-1.20 |
| >12 years | Referent |
Discussion
AD mortality rates (both underlying and multiple cause) increased in the US over the period 1999-2004 covered in this study. As there is no curative treatment for AD and incident cases of AD may be expected to die of AD or related conditions, one would expect incidence and mortality trends to parallel each other. However, there are insufficient data on trends in incident AD to judge whether incidence is also increasing. Longitudinal data from Rochester, Minnesota indicated increasing prevalence in three studies over a 25 year period, but these findings were later revised in a re-analysis which indicated stable incidence over time16. Lacking conclusive evidence from incidence data, it is not known whether the increase in AD mortality is due to truly increasing rates of disease; alternative explanations include increased recording of AD on the death certificate or worse survival rates. Existing data indicate poor recording of AD on the death certificate using ICD-9 in the 1990's17-19, but we have found no published data on the accuracy of AD on death certificates using ICD-10.
There is a remarkable variation in state AD mortality rates (underlying cause), with a range from 8.1/100,000 to 34.5/100,000. There is some evidence of clustering of high rates in the northwest and the southeast, which was also noted earlier by other authors in the 1990s6. There is a rather remarkable parallel to similar clustering of stroke mortality rates in these two areas. Two recent review of risk factors for AD cite several studies indicating that silent brain infarcts at autopsy or upon MRI are a risk factor for AD, and suggest possible mechanisms 11,20. Given that stroke is a risk factor for AD, there could be a causal relationship to common clustering of stroke mortality and AD mortality. If stroke were a risk factor for AD, as the literature suggests, non-fatal stroke would lead to increased AD mortality. Assuming the risk factors for stroke incidence and mortality are similar, one scenario is that in areas where stroke (both incidence and mortality) is more common, AD mortality would also be more common.
There are significant differences in AD mortality rates by gender, race, ethnicity, marital status, and education. Some of these differences could be due to difference in the accuracy of death certificate by demographic factors. For example, better medical care will lead to more diagnoses of AD and more AD on death certificates, which could play a role in differences by race. On the other hand, the racial differences are seen after controlling in multivariate analyses for education, which is a strong marker of socio-economic status and presumably therefore of quality of medical care. Furthermore, the data show that those with less education have higher AD mortality, which is consistent with several studies of AD incidence21-23. It is possible that racial and ethnic differences exist in coding practices for AD independent of medical care. For example, the findings could be explained if doctors and funeral directors responsible for recording cause of death were less likely less to diagnosis, or record a diagnosis of AD, in blacks than whites. There is some limited evidence blacks have less information about AD compared to whites, and are more likely to view AD as a normal part of aging24,25. It is not clear if such differences might extend to the way in which cause of death is recorded on black vs. white death certificates.
On possible limitation to our analysis was our use of 5-year age categories to control for confounding by age. We used 5-year age categories, rather than finer categories, to facilitate data management and analysis of already very large files. The concern with 5-year age categories is that residual confounding by age might occur within a too-broad age category. For example, in comparing women's AD mortality rates to men, within a five year age category (say 80-84), women on the whole would be older than men (given higher male all cause death rates), and the women would have a higher AD mortality rate within this age stratum as a consequence. To test this possibility, we calculated female to male rate ratios for AD mortality with data from 2002 for men and women aged 65-89, using both 5-year categories and 1-year age categories to adjust for age (via direct standardization using the year 2000 US population as the standard). The crude rate ratio (no control over age) for women to men was 1.46, which was artificially high due to confounding by age. The directly-standardized rate ratio using 1-year age categories was 1.16, and using 5-year age categories was 1.17, indicating little effect of the choice of age-categories.
In summary, our data show increasing AD mortality rates. Data on time trends in AD incidence are not available, although clearly needed. As the burden of AD increases in the US, a major step forward would be the creation of AD population-based registries which will enable better characterization of the basic patterns of this disease.
Acknowledgments
This work was partly supported by The National Institute on Aging (grant AG025688; KS and AL). No authors have any conflict of interest regarding this manuscript. Dr. Steenland had full access to all of the data in the study and takes responsibility for the integrity of the data and the accuracy of the data analysis.
References
- 1.Solomon PR, Murphy CA. Should we screen for Alzheimer's disease? A review of the evidence for and against screening Alzheimer's disease in primary care practice. Geriatrics. 2005;60:26–31. see comment. [PubMed] [Google Scholar]
- 2.Alzheimer's Association. Alzheimer's Disease: Facts and Figures. 2007 www.alz.org.
- 3.Shankle WR, Romney AK, Hara J, et al. Methods to improve the detection of mild cognitive impairment. Proceedings of the National Academy of Sciences of the United States of America. 2005;102:4919–4924. doi: 10.1073/pnas.0501157102. [DOI] [PMC free article] [PubMed] [Google Scholar]
- 4.Petersen RC. Mild cognitive impairment: current research and clinical implications. Seminars in Neurology. 2007;27:22–31. doi: 10.1055/s-2006-956752. [DOI] [PubMed] [Google Scholar]
- 5.Hoyert DL, Rosenberg HM. Alzheimer's disease as a cause of death in the United States. Public Health Rep. 1997;112(6):497–505. [PMC free article] [PubMed] [Google Scholar]
- 6.Hoyert DL, Rosenberg HM. Mortality from Alzheimer's disease: an update. Natl Vital Stat Rep. 1999;47(20):1–8. [PubMed] [Google Scholar]
- 7.Anderson RN, Minino AM, Hoyert DL, Rosenberg HM. Comparability of cause of death between ICD-9 and ICD-10: preliminary estimates. Natl Vital Stat Rep. 2001;49(2):1–32. [PubMed] [Google Scholar]
- 8.World Health Organization. International Statistical Classification of Diseases and Related Health Problems. Tenth Revision. Geneva: World Health Organiztion; 1992. [Google Scholar]
- 9.Population Estimates Program, Population Division, US Census Bureau. Resident Population Estimates of the United States by Age and Sex: April 1 tJ, 1999, with Short-Term Projection to November 1, 2000. Release Date: December 20, 2000. [Google Scholar]
- 10.Population Division, US Census Bureau. Table 1: Annual Estimates of the Population by Five-Year Age Groups and Sex for the United States: April 1 tJ, 2006 (NC-EST200601) Release Date: May 17, 2007. [Google Scholar]
- 11.Stampfer MJ. Cardiovascular disease and Alzheimer's disease: common links. J Intern Med. 2006 Sep;260(3):211–23. doi: 10.1111/j.1365-2796.2006.01687.x. [DOI] [PubMed] [Google Scholar]
- 12.Honig LS, Tang MX, Albert S, Costa R, Luchsinger J, Manly J, Stern Y, Mayeux R. Stroke and the risk of Alzheimer disease. Arch Neurol. 2003;60:1707–12. doi: 10.1001/archneur.60.12.1707. [DOI] [PubMed] [Google Scholar]
- 13.Carandang R, Seshadri S, Beiser A, Kelly-Hayes M, Kase CS, Kannel WB, Wolf PA. Trends in incidence, lifetime risk, severity, and 30-day mortality of stroke over the past 50 years. JAMA. 2006;296:2939–46. doi: 10.1001/jama.296.24.2939. [DOI] [PubMed] [Google Scholar]
- 14.Ukraintseva S, Sloan F, Arbeev K, Yashin A. Increasing rates of dementia at time of declining mortality from stroke. Stroke. 2006;37:1155–9. doi: 10.1161/01.STR.0000217971.88034.e9. [DOI] [PubMed] [Google Scholar]
- 15.CDC. Morbidity and Mortality Weekly Report. Vol. 56. 2007. Prevalence of stoke, US 2005; pp. 469–474. [PubMed] [Google Scholar]
- 16.Rocca WA, Cha RH, Waring SC, Kokmen E. Incidence of dementia and Alzheimer's disease: a reanalysis of data from Rochester, Minnesota, 1975-1984. Am J Epidemiol. 1998 Jul 1;148(1):51–62. doi: 10.1093/oxfordjournals.aje.a009560. [DOI] [PubMed] [Google Scholar]
- 17.Pippenger M, Holloway RG, Vickrey BG. Neurologists' use of ICD-9CM codes for dementia. Neurology. 2001;56:1206–9. doi: 10.1212/wnl.56.9.1206. [DOI] [PubMed] [Google Scholar]
- 18.Olichney JM, Hofstetter CR, Galasko D, Thal LJ, Katzman R. Death certificate reporting of dementia and mortality in an Alzheimer's disease research center cohort. J Am Geriatr Soc. 1995;43:890–3. doi: 10.1111/j.1532-5415.1995.tb05532.x. [DOI] [PubMed] [Google Scholar]
- 19.Macera C, Sun R, Yeager K, Brandes D. Sensitivity and specificity of death certificate diagnoses for dementing illnesses, 1988-1990. J Am Geriatr Soc. 1992;40:479–481. doi: 10.1111/j.1532-5415.1992.tb02015.x. [DOI] [PubMed] [Google Scholar]
- 20.De la Torre. How do heart disease and stroke become risk factors for Alzheimer's Disease. Neurol Res. 2006;28:637–644. doi: 10.1179/016164106X130362. [DOI] [PubMed] [Google Scholar]
- 21.Stern Y, Gurland B, Tatemichi TK, Tang MX, Wilder D, Mayeux R. Influence of education and occupation on the incidence of Alzheimer's disease. JAMA. 1994 Apr 6;271(13):1004–10. [PubMed] [Google Scholar]
- 22.Wilson RS, Bennett DA, Bienias JL, Aggarwal NT, Mendes De Leon CF, Morris MC, Schneider JA, Evans DA. Cognitive activity and incident AD in a population-based sample of older persons. Neurology. 2002 Dec 24;59(12):1910–4. doi: 10.1212/01.wnl.0000036905.59156.a1. [DOI] [PubMed] [Google Scholar]
- 23.Cobb JL, Wolf PA, Au R, White R, D'Agostino RB. The effect of education on the incidence of dementia and Alzheimer's disease in the Framingham Study. Neurology. 1995 Sep;45(9):1707–12. doi: 10.1212/wnl.45.9.1707. [DOI] [PubMed] [Google Scholar]
- 24.Connell CM, Scott Roberts J, McLaughlin SJ. Public opinion about Alzheimer disease among blacks, hispanics, and whites: results from a national survey. Alzheimer Dis Assoc Disord. 2007;21:232–40. doi: 10.1097/WAD.0b013e3181461740. [DOI] [PubMed] [Google Scholar]
- 25.Roberts JS, Connell CM, Cisewski D, Hipps YG, Demissie S, Green RC. Differences between African Americans and whites in their perceptions of Alzheimer disease. Alzheimer Dis Assoc Disord. 2003;17:19–26. doi: 10.1097/00002093-200301000-00003. [DOI] [PubMed] [Google Scholar]