Abstract
The woolly mammoth (Mammuthus primigenius) died out about several thousand years ago, yet recent paleogenomic studies have successfully recovered genetic information from both the mitochondrial and nuclear genomes of this extinct species. Mammoths belong to Afrotheria, a group of mammals exhibiting extreme morphological diversity and large genome sizes. In this study, we found that the mammoth genome contains a larger proportion of interspersed repeats than any other mammalian genome reported so far, in which the proliferation of the RTE family of retrotransposons (covering 12% of the genome) may be the main reason for an increased genome size. Phylogenetic analysis showed that RTEs in mammoth are closely related to the family BovB/RTE. The incongruence of the reconstructed RTE phylogeny indicates that RTEs in mammoth may be acquired through an ancient lateral gene transfer event. A recent proliferation of SINEs was also found in the probocidean lineage, whereas the Afrotherian-wide SINEs in mammoth have undergone a rather flat and stepwise expansion. Comparisons of the transposable elements (TEs) between mammoth and other mammals may shed light on the evolutionary history of TEs in various mammalian lineages.
Interspersed repeats (also called transposable elements [TEs]) comprise a significant fraction of all eukaryotic genomes. Based on their mechanism of transposition, TEs can be classified into two types: retrotransposons and DNA transposons. The major difference between them is that retrotransposons propagate themselves by RNA-mediated transposition, but the latter do not (Deininger and Batzer 2002; Deininger et al. 2003; Feschotte and Pritham 2007; Wicker et al. 2007; Belancio et al. 2008). Retrotransposons can be further subdivided into two classes on the basis of either the presence or absence of long terminal repeats (LTRs). LTR retrotransposons are similar to retroviruses in structure, with several open reading frames encoding proteins necessary for retrotransposition and transcriptional regulatory elements located in the flanking LTRs. Non-LTR retrotransposons consist of long interspersed elements (LINEs) and short interspersed elements (SINEs). The autonomous LINEs can be mobilized by their encoded reverse transcriptase, whereas SINEs do not encode functional proteins and rely on other mobile elements for transposition.
In current fully sequenced mammalian genomes, TEs comprise from 30% to more than half of the sequence (Lander et al. 2001; Waterston et al. 2002; Gibbs et al. 2004; Lindblad-Toh et al. 2005; Han et al. 2007; Mikkelsen et al. 2007; Pontius et al. 2007). Recently published genomes of two early diverged mammals, short-tailed opossum (Monodelphis domestica) and platypus (Ornithorhynchus anatinus), shed novel light on mammalian genome evolution. The opossum genome contains a higher proportion of TEs (∼52%), compared with ∼44% for human and ∼38% for mouse (Gentles et al. 2007). Compared with other mammals, opossum is significantly rich in non-LTR elements from the L1, CR1, and RTE families. Similarly, the platypus genome is composed of a large proportion of TEs (∼50%), in which the most abundant and still active repeats are LINE2 and its nonautonomous companion, the mammalian-wide interspersed repeat (MIR) (Warren et al. 2008).
Afrotheria is one of four major groups within placental animals (Springer et al. 1997; Stanhope et al. 1998), containing a large number of morphologically divergent species, such as elephant shrews, tenrecs, elephants, manatees, hyraxes, aardvarks, and golden moles. Many members of Afrotheria appear to be at high risk of extinction, and, indeed, the woolly mammoth (Mammuthus primigenius) was extinct by about 10,000 yr ago, except for a tiny subpopulation that survived for a few thousand more years (Vartanyan et al. 1993). Fortunately, well preserved samples and newly developed sequencing protocols enable us to investigate ancestral genome content as well as the evolutionary dynamics of both extinct and extant lineages. Greenwood et al. (2001) amplified short fragments (∼110 bp) of the endogenous retrovirus-like elements (ERVL) from the wooly mammoth. In our previous studies, we have recently sequenced both mitochondrial and nuclear genomes of the woolly mammoth by generating more than 4 billion bases (Poinar et al. 2006; Gilbert et al. 2007; Miller et al. 2008). This provides a unique opportunity to study the composition and structure of transposable elements in the mammoth genome and their possible roles in Afrotherian evolution. In this study, we investigated the evolutionary pattern of TEs in mammoth and highlighted differences from other species. We found that mammoth contains a higher proportion of TEs than any other mammalian genome studied so far, with RTE elements covering ∼12% of the genome. Phylogenetic relationship among various RTE subfamilies was investigated. The unprecedented expansion of LINE/RTE elements may contribute to an increase of mammoth genome size.
Results
Comparison of mammoth, human, and opossum repeats
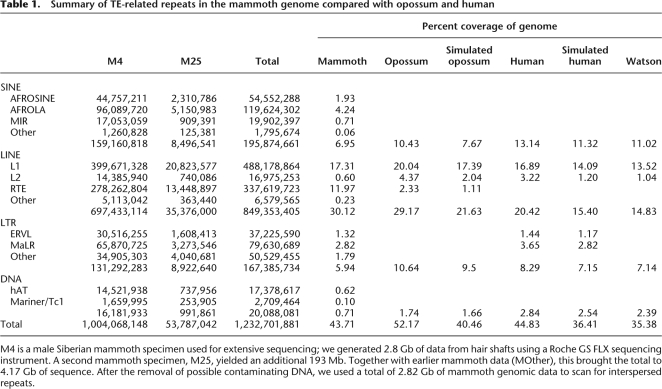
Interspersed repeats were identified and classified using homology-based and de novo methods as described in the Methods. A summary of the main groups of interspersed repeats of the mammoth genome compared with human and opossum is listed in Table 1. LINEs are the most abundant element, contributing 30.12% of the genomic mammoth sequence. Other SINEs, LTR retroposons, and DNA transposons comprise 6.95%, 5.94%, and 0.71% of the sequences, respectively. As shown in Table 1, short and fragmented reads can lead to an underestimation of the actual abundance of interspersed repeats in both human and opossum genomes because divergent repetitive elements are less likely to be identified in short reads under a stringent threshold. A similar result was also found in the Watson genome sequenced by the same 454 Life Sciences (Roche) sequencing technology, where the repeat abundance is much lower than that from the assembled human genome but comparable to that from the simulated human sequences. The total interspersed repeat content in mammoth is 43.71%, which is substantially higher than the corresponding proportions in the simulated human (36.41%) and opossum data sets (40.46%).
Table 1.
Summary of TE-related repeats in the mammoth genome compared with opossum and human
M4 is a male Siberian mammoth specimen used for extensive sequencing; we generated 2.8 Gb of data from hair shafts using a Roche GS FLX sequencing instrument. A second mammoth specimen, M25, yielded an additional 193 Mb. Together with earlier mammoth data (MOther), this brought the total to 4.17 Gb of sequence. After the removal of possible contaminating DNA, we used a total of 2.82 Gb of mammoth genomic data to scan for interspersed repeats.
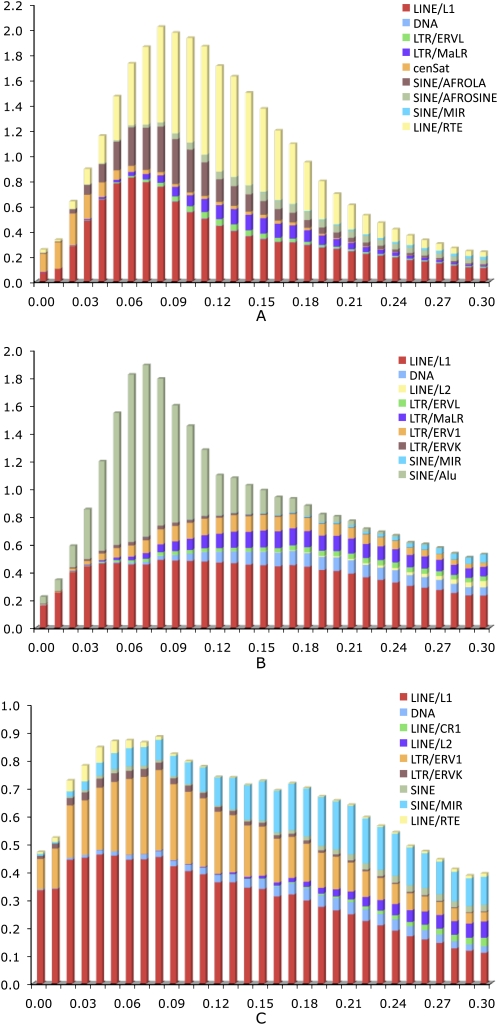
Comparison of the content and age distribution of interspersed repeats among three mammalian genomes (Fig. 1) clearly showed that on average the interspersed repeats in mammoth are substantially less divergent than those in the other two species; the majority may have inserted into the mammoth genome ∼100 million years ago (Mya). In all three species, the predominant class of interspersed repeats consists of LINEs. L1 activity surged in the mammoth lineage ∼75 Mya, as indicated by a peak of L1 copies that are 6% diverged from the consensus sequence. L1 activity remained relatively stable in human. In opossum, however, L1 elements are even younger, and ∼15% of L1 elements are at <5% divergence.
Figure 1.
Age distribution of interspersed repeats in the mammoth (A), human (B), and opossum (C) genomes. The x-axis represents the substitution rate from consensus sequences. The y-axis represents the fraction of the genome comprised by repeat class (%). Note that the age distributions of interspersed repeats for human and opossum were based on the simulated data sets.
In the mammoth genome, the activity of all repeat families except the satellite repeat has decreased most recently, as shown by the distribution of repeats with <5% divergence from the consensus. Similar results were also found in the human genome. In contrast, both L1 and LTR/ERV1 in opossum still exhibit strong transpositional activities. Compared with human and opossum, one striking difference in mammoth is the high abundance of LINE/RTE elements (∼12%), which exhibit a long period of activity between 50 and 200 Mya. DNA transposons are quite rare in mammoth. Even if we took only the simulated data into account, the percentage of DNA transposons in mammoth (0.71%) is still much smaller than that in human (2.54%) and opossum (1.66%). MIR elements, which are found widely in placental mammals, marsupials, and monotremes, are considered the most ancient SINE family detected so far in mammals (Murnane and Morales 1995). The mammoth genome contains about 9 × 10⁵ copies of MIRs (representing 0.71% of the genomic sequence), which are usually >20% diverged from the consensus sequence. In contrast, many more copies of MIRs can be identified in opossum, where they represent 2.2% of the total genome.
To investigate whether the 454 Sequencing errors and DNA damage could distort the substitution rate analyses, we used the simulated human sequences containing point mutations to calculate the substitution rate for each type of repeats. The age distribution was slightly skewed to the right (Supplemental Fig. 1), indicating that these errors may lead to overestimating the actual age of the mammoth repeats but at a very low rate (∼0.1%). When using the 454-sequenced Watson genome as a benchmark, we found that the average overestimated rate of the age distribution is 0.7%. It should be noted that such discrepancy might also come from genetic divergence between the Watson genome and the reference human genome. Similar results were also found in the comparison of age distribution between mammoth and elephant (data not shown). In all these three comparisons, no significant difference was found on the general trend of the age distribution of repeats. These findings suggest that sequencing errors or DNA damage in the mammoth genome could lead to an overestimation of substitution rate, but at a very low level.
Two distinct modes in mammoth SINE evolution
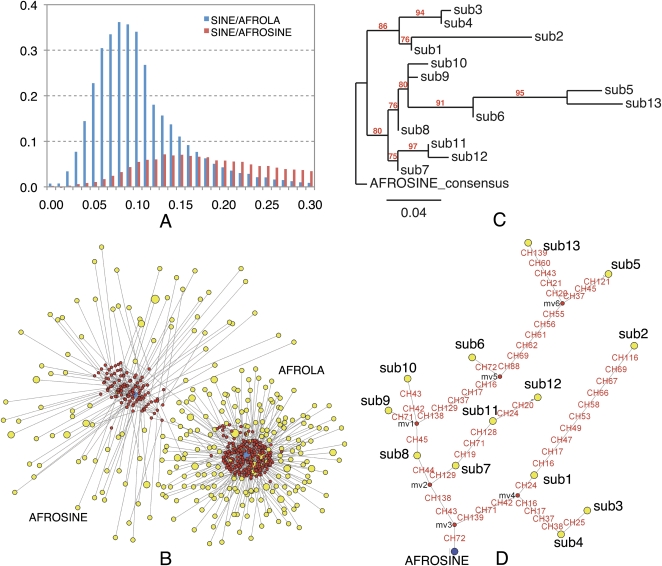
SINEs are nonautonomous retrotransposons that are widely distributed among eukaryotic genomes. Mammals usually contain two to four families of SINEs. Two dominant types of SINEs in mammoth are AFROSINE and AFROLA, which represent 1.93% and 4.24% of the genome, respectively. Both AFROSINE and AFROLA may come from the same tRNA gene and present the typical structural features of the tRNA-derived family of SINEs: a tRNA-related region, a much more conserved tRNA-unrelated region, two promoters of RNA polymerase III (A and B boxes), and a 3′ AT-rich tail. The AFROSINE family is found exclusively among the Afrotherian species, including elephant, hyrax, sea cow, tenrec, and elephant shrew (Nikaido et al. 2003). AFROLA is the most abundant type of SINE in mammoth and shares a high sequence similarity with AFROSINE. The age distributions (Fig. 2A) clearly showed that AFROLA is a relatively young SINE family, which apparently proliferated in the genome after the divergence from AFROSINE. AFROSINE retrotransposons have been active in Afrotherian lineages for the past 100 million yr, reaching a copy of number of ∼0.5 million in the mammoth genome. By comparison, AFROLA is a relative newcomer to the proboscidian lineage, ∼1.1 million copies in the mammoth genome.
Figure 2.
Distinct evolutionary patterns between AFROSINE and AFROLA in the mammoth genome. (A) Comparison of the age distributions of two SINE subfamilies. The x-axis represents the percent substitution from consensus sequences. The y-axis represents the fraction of the genome comprised by repeat class (in percent). (B) A median-joining network of two SINE subfamilies. The network was constructed with randomly selected SINE sequences from the M25 data set. (Yellow circles) SINEs; (red circles) the reconstructed nodes; (blue circles) the consensus sequences of two SINE subfamilies. The size of the circle is proportional to the number of sequences. (Lines) Substitutions. (C) A phylogenetic tree of the consensus sequences of different subgroups of AFROSINEs, as described in Methods. (Red) Bootstrap values. (D) Phylogenetic network of the consensus sequences used in C. The legends are the same as those in B. Nucleotide mutations are labeled in red along each line.
A median-joining network was constructed to investigate the relationships and expansion patterns of both SINE families that have recently expanded in the mammoth genome. Compared with traditional phylogenetic methods, network approaches have been designed for investigating relationships among closely related sequences by allowing identification of persistent ancestral nodes and multifurcations. As shown in Figure 2B, the consensus sequence of AFROLA occupies a central position in the AFROLA cluster, and the relationship between members is star-like. In contrast, the expansion of AFROSINE exhibits a relatively discrete mode, in which descendant leaves may have arisen from various intermediate ancestral nodes. Evolutionary relationships among consensus sequences of various subgroups of AFROSINEs also revealed that various subfamilies members had the capability to generate new copies of repeats, and several descendant lineages roughly followed a sequential order (Fig. 2C,D).
Unprecedented expansion of LINE/RTE elements in mammoth
RTE denotes a group of autonomous retrotransposons in mammals, which consist of a single ORF encoding a protein with endonuclease and reverse transcriptase activity (Malik and Eickbush 1998). It was widely identified in various phylogenetic lineages, such as mosquito, zebrafish, diatom, and plants, but absent in many species including human and mouse. Previously, Monodelphis was considered the richest in RTE elements, with ∼265,000 copies (∼2.3% of the genome) (Gentles et al. 2007). Mammoth, however, contains a much higher proportion of RTE elements, accounting for ∼12% of the genome sequence.
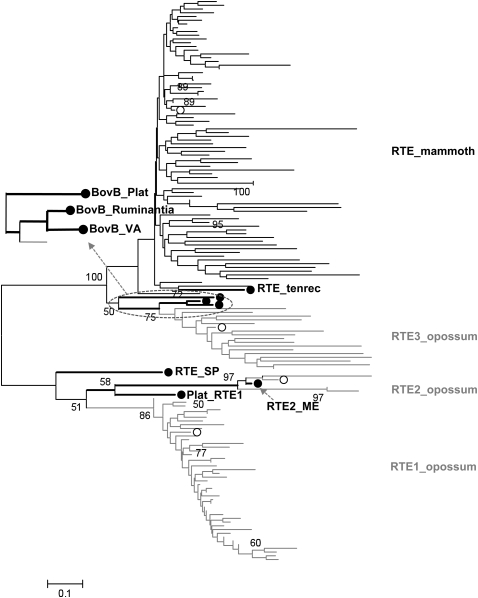
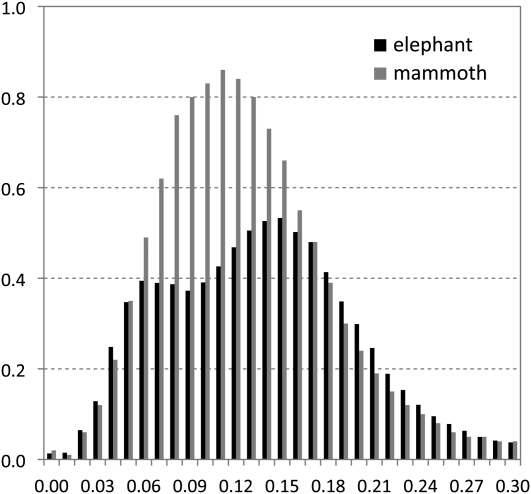
We then investigated the evolutionary origin of mammoth's RTEs and found that the majority, if not all, of RTE retrotransposons in mammoth are monophyletic and derived from the common ancestor shared with the BovB element (Fig. 3). Interestingly, these mammoth RTE sequences form the most basal branch within the known BovB-type elements. We also screened the RTE-like sequences in the available Dasypus novemcinctus (armadillo) and Echinops telfairi (tenrec) genomes, and found that tenrec possesses several BovB-type elements, whereas armadillo does not. Phylogenetic analysis revealed that RTE_tenerec is basal to the mamoth's RTEs, which is well consistent with their taxonomic closeness. Similar to previous studies (Zupunski et al. 2001; Gentles et al. 2007), BovB-type RTE elements from opossum (RTE3_MD), snake (BovB_VA), and cattle (BovB_Ruminantia) are closely related. Gentles et al. (2007) found that RTE1_MD has a relatively recent origin and expansion in opossum. Our simulation studies showed that 42.8% of the opossum RTEs are in the RTE1_MD subfamily, which exhibit much lower sequence divergence than the other two types of RTE elements. However, only the RTE3 type of retroposons has successfully proliferated in the mammoth genome. We also compared the distribution of RTE elements in the mammoth and elephant genomes (Fig. 4) and found that RTEs are more abundant in mammoth (∼12%) than in elephant (∼9%). RTE activity has surged in the probocidean lineage long before the split of mammoth and elephant, as indicated by a peak of RTE copies with 11% divergence from the consensus. However, elephant may have undergone two rounds of RTE proliferation, one at the divergence of 0.06, and the other at the divergence of 0.15.
Figure 3.
Phylogenetic relationships among different types of RTE elements in mammoth and opossum. Numbers above nodes indicate the bootstrap support values (only support of ≥50% is shown). (White circles) The position of the consensus sequence for each type of RTE elements; (black circles) other source of RTE sequences. (Black) The sequences derived from the mammoth genome; (gray) the sequences from the opossum genome.
Figure 4.
Comparison of the age distributions of RTE elements in mammoth and elephant. The x-axis represents the substitution rate from the RTE consensus. The y-axis represents the fraction of the genome comprised by RTEs (in percent).
A satellite repeat in mammoth
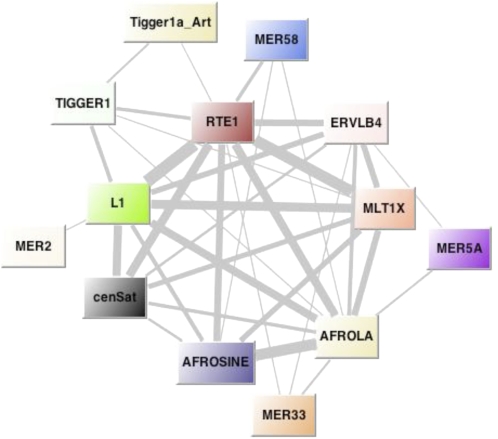
Through de novo repeat identification, we found a new type of repetitive element in mammoth, which comprises 1.49% of the genome sequence. We also found this type of repeat (hereafter denoted as “cenSat”) present in the elephant genome, but absent in other Afrotherian lineages (e.g., tenrec, armadillo). Similarly, many other mammals such as primates and rodents entirely lack this type of repeat. Based on the available assembly results for both mammoth and elephant genomes, we found that these repeats are clustered into a tandem head-to-tail fashion with a unit size of 850 bp. It does not appear to encode any domain that is necessary for its transposition. Age distribution and phylogenetic network clearly suggest that it is much more conserved than any known interspersed repeats in mammoth (Fig. 1; Supplemental Fig. 2). Moreover, none of these autonomous elements shares a similar age distribution pattern with this new repeat. To investigate the possible associations between cenSat and interspersed repeats, we extracted the reads that are composed of two different types of repeats from the M25 data set. As shown in Figure 5, cenSats are mostly associated with L1 and RTE elements, instead of endogenous retrovirus elements (e.g., ERVLB4). The age distribution shows that cenSats share a similar evolutionary pattern with the associated L1 elements instead of RTE elements (data not shown).
Figure 5.
Chromosomal associations among various types of interspersed repeats. The network was constructed with the reads from sample M25. A node represents a repeat class; a line represents the connection between two types of repeats, which was estimated by the number of reads that contain both kinds of repeats. The width of the line is proportional to the number of connections.
The centromere of eukaryotic chromosomes is generally composed of repetitive DNA including satellite repeats, retroelements, and transposons and is responsible for chromosome segregation (Schueler et al. 2001; Lamb et al. 2004). The centromeric satellite repeats generally have a similar monomer length, ranging from 150 to 180 bp (Henikoff et al. 2001), which is close to the range of nucleosomal unit length. However, the cenSat element in mammoth is five times longer than the centromeric satellites in any other known eukaryotic genomes. The actual role and location of cenSats in the mammoth genome still need more experimental evidence.
DNA transposons
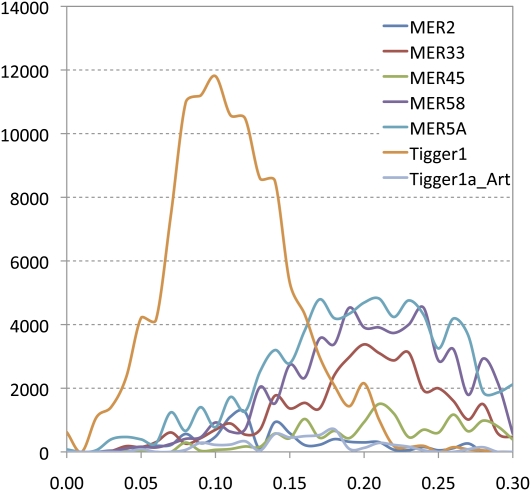
The dominant types of DNA transposons in mammoth include hAT (e.g., MER33, MER45, MER58, MER5A) and Mariner/Tc1 (e.g., MER2, Tigger1, Tigger1_Art), among which the nonautonomous MER5A and MER58 are the most abundant, with ∼4.38, and 2.24 copies/Mb, respectively. There appears to be at least one autonomous Mariner-type element, Tigger1, having ∼0.45 copies/Mb in mammoth. Compared with retrotransposons, DNA transposons in mammoth are mostly ancient copies, with the average divergence exceeding 0.2. Apparently, as shown in Figure 6, the autonomous Tigger1 is a much younger repeat, as indicated by a peak of RTE copies with 10% divergence from the consensus.
Figure 6.
Comparison of the age distributions of different types of DNA transposons in mammoth. The x-axis represents the percent substitution from consensus sequences. The y-axis represents the total length of each repeat class (in base pairs) in the M25 data set.
Discussion
In this study, we compared the patterns of transposable elements in mammoth with those from human and M. domestica. The total identifiable genomic distribution of TEs is 43.71% in mammoth, compared with 36.41% and 40.46% in the simulated human data set and the simulated opossum data set, respectively. The difference is largely due to the expansion of LINE/RTE in mammoth (∼12% of the genome). In contrast, there are only ∼2% of RTEs in the opossum genome, and none in primates. Age distributions and a phylogenetic analysis of RTE elements clearly showed that RTEs in mammoth originated from a subfamily of RTEs in the opossum lineage and proliferated before the divergence of elephant and mammoth. All other types of TEs, however, are less abundant in mammoth than those in human and opossum. Hence, the proliferation of RTEs in mammoth may be the main reason accounting for the large genome size, currently estimated at well in excess of a 4.7-Gb genome (Gregory et al. 2007; Redi et al. 2007; Miller et al. 2008), compared with ∼3.1 Gb for human and ∼3.6 Gb for opossum. It should be noted that the percentage of TEs in mammoth was probably underestimated here because (1) unassembled short reads may decrease the possibility to identify more divergent repetitive elements, as evidenced by simulation studies on both human and opossum data sets; (2) unassembled repetitive reads that are fragmented by nonrepetitive sequences and below a certain threshold would be overlooked; and (3) current repeat-element databases have few proboscidea-specific repeats. The dearth of older age of repetitive elements (e.g., MIRs) in mammoth may be an artifact of the fact that the sequencing reads must be high similar to the consensus sequences. As compared to the fully assembled human genome, the simulated human data also reveals an underestimation of older repeats. However, the position of the peak in the age distribution usually stays the same, indicating that it is still robust enough to estimate the proliferation period for each repetitive element.
Although SINEs are ubiquitous in eukaryotic genomes, specific SINE families are generally restricted in their distribution to a particular taxonomic lineage. The content and distribution of SINEs in mammoth are distinct from those in other non-Afrotherian lineages. In general, the abundance of SINEs for mammoth (∼7%) is considerably lower compared with ∼13% for human and ∼10% for opossum. In mammoth, the most ancient type of SINEs is MIR, which constitutes only 0.71% of the genome. A previous study reported a new family of SINEs (AFROSINE) from African endemic mammals, so we also searched for them in the armadillo and tenrec genomes, and found that armadillo does not contain either type of SINE, while tenrec possesses only AFROSINE (data not shown). This suggests that AFROSINEs emerged after the split of Afrotherian mammals from the common ancestor shared with Xenarthra, while AFROLAs have diverged from AFROSINE more recently, which is consistent with their age distributions.
The transposition of SINEs is dependent on proteins encoded by autonomous LINE partners (Deininger and Batzer 2002), and the expansion of SINEs in a genome can be roughly classified into two distinct models—the single master gene model and the transposon model (Brookfield 1993; Deininger and Batzer 2002; Cordaux et al. 2004). The master gene model posits that only one element (thus termed the “master gene”) is capable of being copied to new locations. In contrast, the transposon model posits that the subsequent members are also able to produce new elements. However, in view of the complicated history and sequence diversity among SINE subfamilies, the reconstructed expansion scenarios of SINEs generally do not strictly follow either of the two models. Cordaux et al. (2004) found that human Alu subfamilies contain secondary source genes that can contribute a substantial portion of subfamily members. In this study, two closely related SINEs in mammoth provide a good opportunity to understand how these elements spread within their host genomes. As a younger element, AFROLA presents a star-like expansion, where the majority of descendants are birthed from the central node(s), representing a recent explosion of AFROLA amplification in the proboscidean lineage. In contrast, the age distribution of AFROSINE is rather flat, and phylogenetic analyses show that subsequent descendants also have the capability to generate new copies of repeats. It is understandable that as a long-lived element, AFROSINE should have a series of “master” genes for expansion to avoid mutational inactivation or purifying selection (Cordaux et al. 2004). Actually, AFROLA appears to be the most successful master gene derived from the ancestral form of AFROSINE in the Afrotherian SINE expansion.
The BovB type of LINEs was originally believed to be specific for ruminants (Duncan 1987; Jobse et al. 1995; Modi et al. 1996). However, highly conserved BovB elements have been detected in Viperidae snakes (Kordis and Gubensek 1997) and several early diverged mammals, including marsupials (Mikkelsen et al. 2007) and monotremes (Warren et al. 2008). In most cases, these identified BovB elements do not follow a vertically inherited relationship. Horizontal transfer of these elements was proposed as the most plausible explanation of their discontinuous distribution and taxonomic incongruence (Kordis and Gubensek 1999; Zupunski et al. 2001). In this study, we found that BovB/RTE elements are also present in several lineages of Afrotheria (e.g., mammoth and tenrec). Phylogenetic analysis revealed that these Afrotherian BovB/RTE elements form a monophyletic clade, with RTE_tenrec as the basal branch, indicating BovB/RTE may have been acquired by a more ancestral Afrotherian species before the split of elephants and tenrecs. However, more genomic data are needed to verify its presence in all other Afrotherian lineages. Kordis and Gubensek (1998) suggested that the ancestor of Squamata is a possible donor of BovB/RTE elements to Ruminantia. But with more data available from platypus, opossum, and also mammoth, the actual direction of lateral gene transfer among these vertebrates becomes complicated. The closest relative of the BovB in Squamata is the RTE3 element in opossum, followed by Ruminantia, whereas the mammoth-derived RTE is the most divergent element. These results suggest that the spread of BovB/RTE elements in the vertebrate may have multiple donors and directions.
Methods
Computational identification of interspersed repeats
Our woolly mammoth DNA samples came from three sources: M4 (a male Siberian mammoth specimen, ∼2.8 Gb [where Gb denotes a billion bases]), M25 (a specimen from another clade of mammoth, ∼0.19 Gb), and MO (other samples, ∼1.12 Gb). Of these data, which are a mix of authentic mammoth sequences and environmental contaminants, ∼2.63 Gb was mapped to the 2× elephant assembly. An additional ∼0.19 Gb can be assigned to the mammoth based on MEGAN analysis (Huson et al. 2007).
We first scanned the resulting 2.82 Gb of mammoth genomic data to identify putative repeat-containing reads using a homology-based program, RepeatMasker (http://www.repeatmasker.org), with the latest version of Repbase 13.04 (Jurka et al. 2005). For each type of repetitive elements, we randomly picked up 5% to 10% of the identified reads (≥120 bp) to build a consensus. There are several types of repeats (SINE/AFROSINE, SINE/AFRO_LA, and LINE/RTE1_LA) available in Repbase 13.04 that share high sequence similarity with the corresponding repeats in the mammoth genome. In this way, we successfully constructed the consensus sequences for these repeats. To identify more divergent autonomous repeats (e.g., L1, RTE, ERV, and DNA transposon) that encode proteins, mammoth genomic data were screened against selected protein sequences from autonomous elements in Repbase using TBLASTN. We also used the Sanger-sequenced 2× elephant genome (The Broad Institute; http://www.broad.mit.edu/node/1085) to assist in construction of consensus sequences for divergent repeats. A sample assembly of short reads used for the construction of consensus sequences is shown in Supplemental Figure 3. The derived consensus sequences of mammoth's repeats were reincorporated into the repeat library (Repbase) used in RepeatMasker, and the above repeat-identification process was iterated until no further repeats could be found. BLAST tools (Altschul et al. 1997), MUSCLE (Edgar 2004), and ad hoc programs developed in the laboratory were used to map short reads and build consensus sequences.
In addition, a de novo strategy was used to identify repeats that may not be included in the current Repbase. We randomly selected 10,000 long reads (≥150 bp) from the already repeat-masked mammoth reads to perform a self-by-self BLASTN comparison. For each family, the highly abundant reads were assembled into a contig to get the potential full-length repeat. Moreover, we used the elephant genomic data as a reference to ensure that the putative mammoth-specific repeats are not caused by sequencing artifacts or contamination.
Age distribution of interspersed repeats
The average number of substitutions per site (K) for each fragmented repeat was estimated using the one-parameter Jukes-Cantor model [−3/4ln(1 − 4/3p)], where p represents the proportion of sites that differ between the fragmented repeat and consensus sequence. Insertions and deletions (indels) were excluded from the calculation of substitution rate. The percent substitution from the consensus is roughly correlated with age of repeat elements. For SINEs, as suggested in a previous study (Lander et al. 2001), CpG dinucleotides in the consensus were excluded from the calculation of substitution rates because the C → T transition rate in CpG pairs can cause distortions in comparing SINEs with high and low CpG content. Estimates of the ages of TEs were obtained by using the equation t = K/2r, where t is the age, and r is the average nucleotide substitution rate. The average nucleotide substitution rates for mitochondrial and nuclear DNA in proboscidean species are 4.2 × 10⁻⁹ and 4.0 × 10⁻¹⁰, respectively (Rohland et al. 2007; Miller et al. 2008), and the latter was used to estimate the ages of TEs. However, it should be noted that the value of r in the nuclear genome may be underestimated and thus lead to an overestimation of the age of TEs, because this value was calculated from the conserved alignment between mammoth and elephant, instead of from neutral sites (e.g., synonymous sites), and repetitive sequences generally evolve at a faster rate. Moreover, it is suggested that nucleotide substitutions are fixed in recent elephantid lineages at only half of the rate in great apes and humans (Miller et al. 2008). Therefore, the r used here would overestimate the age of ancient TEs arising before the split of elephantid lineages.
Simulation studies
Unlike human and opossum genomic data, our mammoth data are a collection of unassembled 454 reads. To ensure the reliability of the comparison of repeat content between mammoth and other mammals, we first analyzed the read length distribution of the mammoth genomic data set (Supplemental Fig. 4) and then simulated 1 million short reads randomly and uniformly from across the human (NCBI 36 assembly, Oct. 2005; http://www.ensembl.org) and opossum (monDom5, Oct 2006; http://www.ensembl.org) genomes based on the same read-length distribution. The total length of simulated reads accounts for 21% (689,835,765 bp) and 20% (689,855,068 bp) of the human and opossum genomes, respectively. Then we used the same protocol as described in the Methods to identify interspersed repeats in the human and opossum genomes.
To evaluate the effect of 454 sequencing error and ancient DNA damage on the substitution rate analysis, we first used the unassembled 454 reads from the Watson genome (Wheeler et al. 2008) to estimate the age distribution using the same method described above. Second, we incorporated point mutations into the simulated human reads to mimic the 454 sequencing errors and C → T and G → A DNA damage. In our previous study, Miller et al. (2008) assessed the error rate of the mammoth sample and found that the sequencing error rate was ∼0.08%, and the total DNA damage rate was ∼0.06%. Here, we randomly incorporated 0.08% point mutations and 0.06% C → T or G → A mutations into the 1 million human reads. Because indels do not have a direct effect on the estimation of age distribution, we did not incorporate any indels. Then these simulated human reads with or without mutations were used to evaluate the extent of distortions coming from sequencing errors or DNA damage. Third, we compared the age distribution of the repeats in the mammoth genome to that in the Sanger-sequenced elephant genome.
Phylogenetic construction of RTE elements
We used three RTE sequences (RTE1_MD, RTE2_MD, and RTE3_MD) of opossum, one RTE consensus sequence from mammoth, and several typical RTE sequences (BovB_Plat, Plat_RTE1, BovB_VA, BovB_Ruminantia, RTE_SP) from Repbase to retrieve the encoded reverse transcriptase (RT) protein sequences, and aligned them using MUSCLE (Edgar 2004). A conserved domain (100 amino acids) of RT was used to search the mammoth and the simulated opossum data sets using BLASTX (1 × 10⁻²). Protein sequences of the identified hits were aligned using MUSCLE, and poorly aligned regions were removed. We then used the neighbor-joining (NJ) method implemented in MEGA 4.0 (Tamura et al. 2007) to reconstruct the phylogenetic relationship between different groups of RTE elements from both the mammoth and opossum genomes.
Phylogenetic network of SINE elements in mammoth
Because the length of SINEs in mammoth is ∼140–160 bp, 454 sequencing reads can completely cover the full-length SINEs. We randomly selected the full-length or nearly full-length (≥90% of the total length) SINE-containing reads from the M25 data set to construct phylogenetic networks using NETWORK 4.1 (Bandelt et al. 1999). First, we assigned these raw sequences into subfamilies based on their phylogeny, which was constructed using the NJ method implemented in MEGA 4.0. Second, for each subfamily with >85% bootstrap support, a consensus sequence was constructed based on multiple alignments using MUSCLE. These consensus sequences may represent various stages of ancestral sequences in the evolution of AFROSINE repeats. To reveal the relationship between the consensus sequences, we built a phylogenetic tree using the PhyML method implemented on the phylogeny.fr server with the default parameters (Dereeper et al. 2008) and also constructed a phylogenetic network using NETWORK 4.1.
Acknowledgments
We thank Webb Miller for thoughtful readings of the manuscript. We thank the Broad Institute for making the elephant, armadillo, and tenrec assemblies available prior to publication (K. Lindblad-Toh, pers. comm.). We also thank three anonymous reviewers for their useful comments on the manuscript. This research was supported in part by the Gordon and Betty Moore Foundation.
Footnotes
[Supplemental material is available online at www.genome.org.]
Article published online before print. Article and publication date are at http://www.genome.org/cgi/doi/10.1101/gr.091363.109.
References
- Altschul SF, Madden TL, Schaffer AA, Zhang J, Zhang Z, Miller W, Lipman DJ. Gapped BLAST and PSI-BLAST: A new generation of protein database search programs. Nucleic Acids Res. 1997;25:3389–3402. doi: 10.1093/nar/25.17.3389. [DOI] [PMC free article] [PubMed] [Google Scholar]
- Bandelt HJ, Forster P, Rohl A. Median-joining networks for inferring intraspecific phylogenies. Mol Biol Evol. 1999;16:37–48. doi: 10.1093/oxfordjournals.molbev.a026036. [DOI] [PubMed] [Google Scholar]
- Belancio VP, Hedges DJ, Deininger P. Mammalian non-LTR retrotransposons: For better or worse, in sickness and in health. Genome Res. 2008;18:343–358. doi: 10.1101/gr.5558208. [DOI] [PubMed] [Google Scholar]
- Brookfield JF. The generation of sequence similarity in SINEs and LINEs. Trends Genet. 1993;9:38–39. doi: 10.1016/0168-9525(93)90172-E. [DOI] [PubMed] [Google Scholar]
- Cordaux R, Hedges DJ, Batzer MA. Retrotransposition of Alu elements: How many sources? Trends Genet. 2004;20:464–467. doi: 10.1016/j.tig.2004.07.012. [DOI] [PubMed] [Google Scholar]
- Deininger PL, Batzer MA. Mammalian retroelements. Genome Res. 2002;12:1455–1465. doi: 10.1101/gr.282402. [DOI] [PubMed] [Google Scholar]
- Deininger PL, Moran JV, Batzer MA, Kazazian HH., Jr Mobile elements and mammalian genome evolution. Curr Opin Genet Dev. 2003;13:651–658. doi: 10.1016/j.gde.2003.10.013. [DOI] [PubMed] [Google Scholar]
- Dereeper A, Guignon V, Blanc G, Audic S, Buffet G, Chevenet F, Dufayard J-F, Guindon S, Lefort V, Lescot M, et al. Phylogeny.fr: Robust phylogenetic analysis for the non-specialist. Nucleic Acids Res. 2008;36:W465–W469. doi: 10.1093/nar/gkn180. [DOI] [PMC free article] [PubMed] [Google Scholar]
- Duncan CH. Novel Alu-type repeat in artiodactyls. Nucleic Acids Res. 1987;15:1340. doi: 10.1093/nar/15.3.1340. [DOI] [PMC free article] [PubMed] [Google Scholar]
- Edgar RC. MUSCLE: Multiple sequence alignment with high accuracy and high throughput. Nucleic Acids Res. 2004;32:1792–1797. doi: 10.1093/nar/gkh340. [DOI] [PMC free article] [PubMed] [Google Scholar]
- Feschotte C, Pritham EJ. DNA transposons and the evolution of eukaryotic genomes. Annu Rev Genet. 2007;41:331–368. doi: 10.1146/annurev.genet.40.110405.090448. [DOI] [PMC free article] [PubMed] [Google Scholar]
- Gentles AJ, Wakefield MJ, Kohany O, Gu W, Batzer MA, Pollock DD, Jurka J. Evolutionary dynamics of transposable elements in the short-tailed opossum Monodelphis domestica. Genome Res. 2007;17:992–1004. doi: 10.1101/gr.6070707. [DOI] [PMC free article] [PubMed] [Google Scholar]
- Gibbs RA, Weinstock GM, Metzker ML, Muzny DM, Sodergren EJ, Scherer S, Scott G, Steffen D, Worley KC, Burch PE, et al. Genome sequence of the Brown Norway rat yields insights into mammalian evolution. Nature. 2004;428:493–521. doi: 10.1038/nature02426. [DOI] [PubMed] [Google Scholar]
- Gilbert MT, Tomsho LP, Rendulic S, Packard M, Drautz DI, Sher A, Tikhonov A, Dalen L, Kuznetsova T, Kosintsev P, et al. Whole-genome shotgun sequencing of mitochondria from ancient hair shafts. Science. 2007;317:1927–1930. doi: 10.1126/science.1146971. [DOI] [PubMed] [Google Scholar]
- Greenwood AD, Lee F, Capelli C, DeSalle R, Tikhonov A, Marx PA, MacPhee RD. Evolution of endogenous retrovirus-like elements of the woolly mammoth (Mammuthus primigenius) and its relatives. Mol Biol Evol. 2001;18:840–847. doi: 10.1093/oxfordjournals.molbev.a003865. [DOI] [PubMed] [Google Scholar]
- Gregory TR, Nicol JA, Tamm H, Kullman B, Kullman K, Leitch IJ, Murray BG, Kapraun DF, Greilhuber J, Bennett MD. Eukaryotic genome size databases. Nucleic Acids Res. 2007;35:D332–D338. doi: 10.1093/nar/gkl828. [DOI] [PMC free article] [PubMed] [Google Scholar]
- Han K, Konkel MK, Xing J, Wang H, Lee J, Meyer TJ, Huang CT, Sandifer E, Hebert K, Barnes EW, et al. Mobile DNA in Old World monkeys: A glimpse through the rhesus macaque genome. Science. 2007;316:238–240. doi: 10.1126/science.1139462. [DOI] [PubMed] [Google Scholar]
- Henikoff S, Ahmad K, Malik HS. The centromere paradox: Stable inheritance with rapidly evolving DNA. Science. 2001;293:1098–1102. doi: 10.1126/science.1062939. [DOI] [PubMed] [Google Scholar]
- Huson DH, Auch AF, Qi J, Schuster SC. MEGAN analysis of metagenomic data. Genome Res. 2007;17:377–386. doi: 10.1101/gr.5969107. [DOI] [PMC free article] [PubMed] [Google Scholar]
- Jobse C, Buntjer JB, Haagsma N, Breukelman HJ, Beintema JJ, Lenstra JA. Evolution and recombination of bovine DNA repeats. J Mol Evol. 1995;41:277–283. [PubMed] [Google Scholar]
- Jurka J, Kapitonov VV, Pavlicek A, Klonowski P, Kohany O, Walichiewicz J. Repbase Update, a database of eukaryotic repetitive elements. Cytogenet Genome Res. 2005;110:462–467. doi: 10.1159/000084979. [DOI] [PubMed] [Google Scholar]
- Kordis D, Gubensek F. Bov-B long interspersed repeated DNA (LINE) sequences are present in Vipera ammodytes phospholipase A2 genes and in genomes of Viperidae snakes. Eur J Biochem. 1997;246:772–779. doi: 10.1111/j.1432-1033.1997.00772.x. [DOI] [PubMed] [Google Scholar]
- Kordis D, Gubensek F. Unusual horizontal transfer of a long interspersed nuclear element between distant vertebrate classes. Proc Natl Acad Sci. 1998;95:10704–10709. doi: 10.1073/pnas.95.18.10704. [DOI] [PMC free article] [PubMed] [Google Scholar]
- Kordis D, Gubensek F. Horizontal transfer of non-LTR retrotransposons in vertebrates. Genetica. 1999;107:121–128. doi: 10.1023/a:1004082906518. [DOI] [PubMed] [Google Scholar]
- Lamb JC, Theuri J, Birchler JA. What's in a centromere? Genome Biol. 2004;5:239. doi: 10.1186/gb-2004-5-9-239. [DOI] [PMC free article] [PubMed] [Google Scholar]
- Lander ES, Linton LM, Birren B, Nusbaum C, Zody MC, Baldwin J, Devon K, Dewar K, Doyle M, FitzHugh W, et al. Initial sequencing and analysis of the human genome. Nature. 2001;409:860–921. doi: 10.1038/35057062. [DOI] [PubMed] [Google Scholar]
- Lindblad-Toh K, Wade CM, Mikkelsen TS, Karlsson EK, Jaffe DB, Kamal M, Clamp M, Chang JL, Kulbokas EJ, III, Zody MC, et al. Genome sequence, comparative analysis and haplotype structure of the domestic dog. Nature. 2005;438:803–819. doi: 10.1038/nature04338. [DOI] [PubMed] [Google Scholar]
- Malik HS, Eickbush TH. The RTE class of non-LTR retrotransposons is widely distributed in animals and is the origin of many SINEs. Mol Biol Evol. 1998;15:1123–1134. doi: 10.1093/oxfordjournals.molbev.a026020. [DOI] [PubMed] [Google Scholar]
- Mikkelsen TS, Wakefield MJ, Aken B, Amemiya CT, Chang JL, Duke S, Garber M, Gentles AJ, Goodstadt L, Heger A, et al. Genome of the marsupial Monodelphis domestica reveals innovation in non-coding sequences. Nature. 2007;447:167–177. doi: 10.1038/nature05805. [DOI] [PubMed] [Google Scholar]
- Miller W, Drautz DI, Ratan A, Pusey B, Qi J, Lesk AM, Tomsho LP, Packard MD, Zhao F, Sher A, et al. Sequencing the nuclear genome of the extinct woolly mammoth. Nature. 2008;456:387–390. doi: 10.1038/nature07446. [DOI] [PubMed] [Google Scholar]
- Modi WS, Gallagher DS, Womack JE. Evolutionary histories of highly repeated DNA families among the Artiodactyla (Mammalia) J Mol Evol. 1996;42:337–349. doi: 10.1007/BF02337544. [DOI] [PubMed] [Google Scholar]
- Murnane JP, Morales JF. Use of a mammalian interspersed repetitive (MIR) element in the coding and processing sequences of mammalian genes. Nucleic Acids Res. 1995;23:2837–2839. doi: 10.1093/nar/23.15.2837. [DOI] [PMC free article] [PubMed] [Google Scholar]
- Nikaido M, Nishihara H, Hukumoto Y, Okada N. Ancient SINEs from African endemic mammals. Mol Biol Evol. 2003;20:522–527. doi: 10.1093/molbev/msg052. [DOI] [PubMed] [Google Scholar]
- Poinar HN, Schwarz C, Qi J, Shapiro B, Macphee RD, Buigues B, Tikhonov A, Huson DH, Tomsho LP, Auch A, et al. Metagenomics to paleogenomics: Large-scale sequencing of mammoth DNA. Science. 2006;311:392–394. doi: 10.1126/science.1123360. [DOI] [PubMed] [Google Scholar]
- Pontius JU, Mullikin JC, Smith DR, Lindblad-Toh K, Gnerre S, Clamp M, Chang J, Stephens R, Neelam B, Volfovsky N, et al. Initial sequence and comparative analysis of the cat genome. Genome Res. 2007;17:1675–1689. doi: 10.1101/gr.6380007. [DOI] [PMC free article] [PubMed] [Google Scholar]
- Redi CA, Garagna S, Zuccotti M, Capanna E. Genome size: A novel genomic signature in support of Afrotheria. J Mol Evol. 2007;64:484–487. doi: 10.1007/s00239-006-0237-1. [DOI] [PubMed] [Google Scholar]
- Rohland N, Malaspinas AS, Pollack JL, Slatkin M, Matheus P, Hofreiter M. Proboscidean mitogenomics: Chronology and mode of elephant evolution using mastodon as outgroup. PLoS Biol. 2007;5:e207. doi: 10.1371/journal.pbio.0050207. [DOI] [PMC free article] [PubMed] [Google Scholar]
- Schueler MG, Higgins AW, Rudd MK, Gustashaw K, Willard HF. Genomic and genetic definition of a functional human centromere. Science. 2001;294:109–115. doi: 10.1126/science.1065042. [DOI] [PubMed] [Google Scholar]
- Springer MS, Cleven GC, Madsen O, de Jong WW, Waddell VG, Amrine HM, Stanhope MJ. Endemic African mammals shake the phylogenetic tree. Nature. 1997;388:61–64. doi: 10.1038/40386. [DOI] [PubMed] [Google Scholar]
- Stanhope MJ, Waddell VG, Madsen O, de Jong W, Hedges SB, Cleven GC, Kao D, Springer MS. Molecular evidence for multiple origins of Insectivora and for a new order of endemic African insectivore mammals. Proc Natl Acad Sci. 1998;95:9967–9972. doi: 10.1073/pnas.95.17.9967. [DOI] [PMC free article] [PubMed] [Google Scholar]
- Tamura K, Dudley J, Nei M, Kumar S. MEGA4: Molecular Evolutionary Genetics Analysis (MEGA) software version 4.0. Mol Biol Evol. 2007;24:1596–1599. doi: 10.1093/molbev/msm092. [DOI] [PubMed] [Google Scholar]
- Vartanyan SL, Garutt VE, Sher AV. Holocene dwarf mammoths from Wrangel Island in the Siberian Arctic. Nature. 1993;362:337–340. doi: 10.1038/362337a0. [DOI] [PubMed] [Google Scholar]
- Warren WC, Hillier LW, Marshall Graves JA, Birney E, Ponting CP, Grützner F, Belov K, Miller W, Clarke L, Chinwalla AT, et al. Genome analysis of the platypus reveals unique signatures of evolution. Nature. 2008;453:175–183. doi: 10.1038/nature06936. [DOI] [PMC free article] [PubMed] [Google Scholar]
- Waterston RH, Lindblad-Toh K, Birney E, Rogers J, Abril JF, Agarwal P, Agarwala R, Ainscough R, Alexandersson M, An P, et al. Initial sequencing and comparative analysis of the mouse genome. Nature. 2002;420:520–562. doi: 10.1038/nature01262. [DOI] [PubMed] [Google Scholar]
- Wheeler DA, Srinivasan M, Egholm M, Shen Y, Chen L, McGuire A, He W, Chen YJ, Makhijani V, Roth GT, et al. The complete genome of an individual by massively parallel DNA sequencing. Nature. 2008;452:872–876. doi: 10.1038/nature06884. [DOI] [PubMed] [Google Scholar]
- Wicker T, Sabot F, Hua-Van A, Bennetzen JL, Capy P, Chalhoub B, Flavell A, Leroy P, Morgante M, Panaud O, et al. A unified classification system for eukaryotic transposable elements. Nat Rev Genet. 2007;8:973–982. doi: 10.1038/nrg2165. [DOI] [PubMed] [Google Scholar]
- Zupunski V, Gubensek F, Kordis D. Evolutionary dynamics and evolutionary history in the RTE clade of non-LTR retrotransposons. Mol Biol Evol. 2001;18:1849–1863. doi: 10.1093/oxfordjournals.molbev.a003727. [DOI] [PubMed] [Google Scholar]


