

Abstract
DNA methylation contributes to carcinogenesis by silencing key tumor suppressor genes. Here we report an ultrasensitive and reliable nanotechnology assay, MS-qFRET, for detection and quantification of DNA methylation. Bisulfite-modified DNA is subjected to PCR amplification with primers that would differentiate between methylated and unmethylated DNA. Quantum dots are then used to capture PCR amplicons and determine the methylation status via fluorescence resonance energy transfer (FRET). Key features of MS-qFRET include its low intrinsic background noise, high resolution, and high sensitivity. This approach detects as little as 15 pg of methylated DNA in the presence of a 10,000-fold excess of unmethylated alleles, enables reduced use of PCR (as low as eight cycles), and allows for multiplexed analyses. The high sensitivity of MS-qFRET enables one-step detection of methylation at PYCARD, CDKN2B, and CDKN2A genes in patient sputum samples that contain low concentrations of methylated DNA, which normally would require a nested PCR approach. The direct application of MS-qFRET on clinical samples offers great promise for its translational use in early cancer diagnosis, prognostic assessment of tumor behavior, as well as monitoring response to therapeutic agents.
Aberrant DNA hypermethylation is observed at classic tumor-suppressor genes, which are known to be genetically mutated and cause inherited forms of cancer (Jones and Baylin 2002). Tumor cells display a larger number of genes inactivated by promoter hypermethylation than by genetic mutations (Schuebel et al. 2007). Furthermore, these abnormal epigenetic changes appear to be an early event that precedes detection of genetic mutations (Esteller et al. 1999; Feinberg and Tycko 2004; Yamada et al. 2005). Thus, detection of promoter hypermethylation is a valuable tool for early diagnosis of cancer, monitoring tumor behavior, as well as measuring response of tumors to targeted therapy (Esteller et al. 2000; Gore et al. 2006b; Brock et al. 2008).
The number of tools available to assess DNA methylation demonstrates the extensive interest that has been invested in understanding the role of epigenetics in carcinogenesis (Laird 2003). One of the more common techniques used for the detection of methylation is methylation-specific PCR (MSP) (Herman et al. 1996). The technique relies on sodium bisulfite treatment of DNA, which converts unmethylated cytosines to uracils while leaving methylated cytosines unaffected. The modified sequences are then amplified with specific primers, and the amplified products are identified using gel electrophoresis. However, this standard MSP approach offers only qualitative analysis and cannot discern relative amounts of methylation. Although real-time PCR-based MSP methods (Lo et al. 1999; Eads et al. 2000) enable quantitative analysis, they may lack the sensitivity for direct screening of challenging samples, such as sputum, where the DNA from tumor cells is minimal, thereby requiring a nested PCR approach (Brandes et al. 2005; Belinsky et al. 2006; Machida et al. 2006; Kim et al. 2007).
Methylation-specific quantum dot fluorescence resonance energy transfer (MS-qFRET) combines the high specificity of MSP and the high sensitivity and simplicity of the quantum dot FRET (QD-FRET) technology (Zhang et al. 2005). MS-qFRET facilitates a straightforward approach for both a qualitative and quantitative detection of methylated DNA, as well as allowing detection of low-abundance methylated DNA. The sensitivity of the MS-qFRET is first examined here, followed by a demonstration of its ability to quantify methylation, both in cell lines, as well as in myelodysplastic syndrome (MDS) patient samples. The advantages of MS-qFRET are also highlighted by its capability of multiplexing reactions and its potential application for high-throughput screening. Finally, the sensitivity of this technique is validated in patient sputum samples that contain very low concentrations of DNA.
Results
In MS-qFRET, the bisulfite-treated DNA is amplified through PCR, wherein the forward primer is biotinylated and the reverse primer is labeled with an organic fluorophore (Fig. 1). Next, streptavidin-conjugated quantum dots (QDs) are introduced to capture the labeled PCR products via streptavidin-biotin binding, bringing the QDs (serving as donors) and fluorophores (serving as acceptors) in close proximity allowing FRET to occur. Finally, PCR products are detected by emissions of fluorophores accompanied by quenching of QDs. Spectral information is processed to determine the level of DNA methylation.
Figure 1.

Principle of MS-qFRET for detection of DNA methylation. In step 1, extracted genomic DNA is subject to sodium bisulfite conversion, wherein unmethylated cytosines are converted to uracil while methylated cytosines remain unaffected. In step 2, DNA is amplified using PCR wherein the forward and reverse primers are labeled with a biotin (black dot) and a fluorophore (red dot), respectively. In step 3, the resulting labeled-PCR product is captured by streptavidin functionalized QDs through streptavidin-biotin affinity. Finally, in step 4, upon suitably exciting the QD, the nanoassembly formed allows for FRET to occur between the QD donor and the fluorophore acceptor. Consequently, the labeled-PCR products are detected by emissions of fluorophores accompanied by quenching of QDs to reveal the status of DNA methylation.
Feasibility of MS-qFRET
To examine the background noise level of MS-qFRET, control experiments were conducted using in vitro-methylated DNA (IVD) and unmethylated DNA (normal lymphocytes [NL]) with methylation-specific primers for the CDKN2A promoter (Table 1). Using a fluorospectrometer, MS-qFRET detected PCR products as early as eight cycles of amplification with starting quantities of DNA typical for MSP (150 ng) (Herman et al. 1996) (Fig. 2A). Signal obtained from MS-qFRET for methylated product after eight cycles of amplification was significantly higher than that of the water control. The purpose of such early detection was to characterize the QD-FRET sensor and demonstrate that the extremely low background noise from QD-FRET allowed for detection after just few cycles of amplification. In addition, early detection allowed for increased throughput as well as the ability to quantify in the log-linear phase of PCR amplification. In contrast, conventional gel or real-time based MSP methods (Eads et al. 2000; Fackler et al. 2004) generally required amplification of >20 cycles to detect the presence of amplicons (Fig. 2B; data not shown).
Table 1.
Primers used for DNA amplification

MS-qFRET primers are identical to those of MSP, with the only exception of a biotin and fluorophore conjugation on the forward and reverse strands, respectively. Amplicon sizes vary from 68 bp to 151 bp.
Figure 2.

High analytical sensitivity facilitated by inherent low-background noise. (A) Methylation for CDKN2A can be detected as early as eight cycles as demonstrated by the FRET efficiency, which is significantly higher than that of water control. FRET efficiency from the standard 35-cycle control is much higher due to both a stronger acceptor emission accompanied by stronger QD quenching. Error bars are computed from five separate experiments. (B) Corresponding MSP gel readout indicates no visible band at eight cycles for methylated CDKN2A product but a clear band for the standard 35 cycles. (C) Confocal spectroscopy is used to observe differences in the positive control (IVD only) and negative control (NL only) through 2000-msec single-particle traces. (Top) In positive control, each Cy5 peak seen is the fluorescence burst associated with labeled-MSP products that is linked to a single QD passing through the focal detection volume of a confocal spectroscopy setup. (Bottom) The negative control has very low background noise. (D) IVD was serially diluted in NL DNA (150 ng) and subject to MS-qFRET with 40 cycles of amplification. Confocal spectroscopy is used to analyze fluorescent bursts for the acceptor (Cy5) and was plotted for the entire time duration (three separate runs of 100 sec) for 1/10, 1/100, 1/1000, and 1/10,000 and 0 methylated/unmethylated CDKN2A alleles (IVD/NL). This indicates the successful detection of methylation with as little as 15 pg of methylated DNA (∼5 genomic equivalents) in 150 ng of excess unmethylated DNA.
To analyze the analytical sensitivity of MS-qFRET, we used a confocal fluorescence spectroscope sensitive even to single-molecule fluorescence (Wang et al. 2005). IVD was serially diluted in NL DNA (150 ng) and subject to MS-qFRET with 40 cycles of amplification. As seen in Figure 2C, each Cy5 peak seen is the FRET-induced fluorescence burst associated with labeled-MSP products that is linked to a single QD passing through the focal detection volume of the confocal spectroscopy setup (burst count). Figure 2D plots the burst counts for the entire time duration (3 separate runs of 100 sec) for 1/10, 1/100, 1/1000, and 1/10,000 and 0 methylated/unmethylated CDKN2A alleles (IVD/NL), which corresponds to 5000, 500, 50, and five copies of methylated CDKN2A alleles in the PCR reaction. The burst count analysis used here is a qualitative analysis to test the analytical sensitivity of MS-qFRET. Triplicates of the same reaction samples were used to capture the variability and reproducibility of the detection technology. FRET signals were observed using as little as 15 pg (∼5 genomic equivalents) of methylated DNA (IVD) in an excess of 150 ng of unmethylated DNA (NL), which is distinctly above the signal observed with only NL DNA (Fig. 2D). These results indicate that MS-qFRET is sensitive to detect as little as five copies of methylated DNA when combined with a sensitive detection setup. The true sensitivity however is dependent on various factors including PCR reaction conditions, efficiency of primers, product size, and sampling effects, especially when diluting to five copies per reaction. Any variability arising from sampling will be reflected in the amount of PCR product, and therefore the burst counts. To account for such sample variability, we performed the burst count analysis of PCR reactions that used templates from triplicates of separate serial dilutions. An increase in variance of the burst counts is observed with increasing dilutions (Supplemental Fig. 1). This is consistent with what would be expected at high dilutions, especially in the range of five copies per reaction wherein 43.1% of the reactions will have less than five copies per reaction and 38.3% will have more than five copies per reaction. Most importantly, signal observed from MS-qFRET from the 1:10,000 dilution samples indicates a clear difference from the NL control. Together, the results shown in Figure 2 and Supplemental Figure 1 demonstrate successful detection of as little as 15 pg of methylated DNA, thereby illustrating the ultrasensitive capability MS-qFRET.
Analysis showed strong FRET signals for a wide range of amplicon sizes ranging from 68 bp to 151 bp (Table 1; Figs. 2–4). Since most amplicon sizes lie within this range, MS-qFRET is easily adaptable to current MSP techniques in analyzing numerous genes. Notably, the background level was minimal in the presence of only NL, while strong FRET signals were clearly observed in the presence of IVD, when amplified with methylation-specific primers (Fig. 2C,D).
Figure 4.

Detection of methylation in human sputum samples. (A) Representative gel from sputum DNA using conventional MSP for PYCARD for eight patients indicates the presence of only unmethylated products. Electrophoresis gel from nested MSP products detects methylation in Patients 3, 7, and 8. (B) Representative fluorescence spectra from two patients with differing methylation status. Significant acceptor (Cy5) emission at 670 nm is observed for patients with methylated PYCARD promoter (yellow trace). (C) Normalized FRET efficiencies (En) for 20 patients, conducted in a blinded fashion, indicate that Patients 3, 7, and 8 have methylation for PYCARD. An arbitrary En cut-off of 0.1 is used to determine positive methylation. All patients show unmethylated PYCARD product as well (data not shown).
Quantification of methylation
The capability of PCR detection at the early log-linear stage makes quantifying DNA methylation possible. To examine the quantitative accuracy of MS-qFRET, IVD and NL were mixed in different ratios and analyzed using a fluorospectrometer after 16 cycles at the CDKN2A promoter with methylation-specific primers. As shown in Figure 3A, with an increasing amount of input methylated DNA in the mixture (with a fixed total DNA concentration), there is a corresponding increase in the intensity of the acceptor (Cy5) emission and donor (QD605) quenching. Figure 3B shows a linear correlation between the normalized FRET efficiency, herein referred to as the q-score (see Methods), and the input methylation level. Standard error bars are computed from five separate experiments. By including a methylated or unmethylated dilution series in every assay with a known total input DNA, a standard curve can be created to quantify methylation of unknown samples from the q-score.
Figure 3.

Quantitative ability of MS-qFRET. (A) Experiments with different ratios of unmethylated and methylated DNA (see Methods) show that increasing percent CDKN2A methylation levels are accompanied by an increase in acceptor (Cy5) emission at 670 nm and corresponding donor (QD605) quenching at 605 nm. (B) q-scores are plotted for the varying levels of CDKN2A methylation and a linear fit is observed with r2 = 0.999. Results are plotted from five separate mixing experiments. (C) Quantitative ability of MS-qFRET to estimate CDKN2A methylation reversal in DNA from RKO cells treated with DAC for different time points. Error bars are generated from three separate repetitions. q-scores indicate a drop in the level of methylation post-treatment. (D) Quantification of methylation reversal at CDKN2B using MS-qFRET in six MDS patients using 150 ng of input DNA during their first cycle of epigenetic therapy. Changes in levels of methylation are effectively captured to show varying cellular responses to therapy with 5-azacytidine and MS-275.
Monitoring methylation changes after drug treatment in cell lines and samples from patients with MDS
The quantitative ability of MS-qFRET was further tested in cell lines and in patient samples as a function of response to a DNA demethylating agent. Reversal of methylation in the colorectal cancer cell line RKO was quantified at specific time points after treatment with 5-aza-2′-deoxycytidine (DAC). Figure 3C is from triplicate data and shows a 10 to 20% decrease in methylation at CDKN2A within 24 to 36 h with maximal reversal seen at 60 h post-treatment. Since DNA replication is necessary for incorporation of DAC into DNA, reversal of methylation may be best observed only after inhibition of DNA methyltransferases due to cell cycling. The low amount of methylation reversal in the initial 24 to 36 h could be attributed to the 22-h doubling time for RKO cells. These results are consistent with methylation reversal studies using Ms-SNuPE (Bender et al. 1999).
To demonstrate the quantitative ability of MS-qFRET directly in a clinical setting, reversal of methylation at the CDKN2B promoter (Herman et al. 1997; Quesnel et al. 1998; Daskalakis et al. 2002; Christiansen et al. 2003; Shimamoto et al. 2005) was analyzed on bone marrow aspirate samples from patients with MDS who received epigenetic therapy as part of an Institutional Review Board-approved clinical trial. Patients were treated with combination therapy using both 5-azacytidine (Vidaza) and MS-275 (Entinostat), a histone deacetylase inhibitor. Bone marrow aspirate samples were obtained pretreatment (day 0) and on day 14 and day 29 of the first cycle of combination therapy. Gel electrophoresis is a common means to monitor the response to such therapy (Fahrner et al. 2002; Christiansen et al. 2003; Gore et al. 2006a). However, after many cycles of PCR amplification, the data does not remain quantifiable and resolving methylation becomes challenging. MS-qFRET allows for computing such differences in methylation by measuring methylation at the early stage of amplification. As shown for six patients (Fig. 3D), MS-qFRET is used for detecting and tracking methylation changes for each patient in a quantitative manner, with the day 0 sample being the “control” for the following sample time points (day 15 and day 29) for each patient. Results obtained from 16-cycle analysis of MS-qFRET were consistent with trends observed from 40 cycles of real-time PCR (Supplemental Fig. 2). These data highlight that individual patients have unique responses to epigenetic agents in vivo and that these subtle changes are easily quantifiable using MS-qFRET.
Ultrasensitive methylation detection in human sputum samples
To validate the high analytical sensitivity in clinical patient samples with low concentrations of methylated DNA, the methylation status of PYCARD, CDKN2B, and CDKN2A in sputum DNA was tested. It is known that PYCARD protein level is reduced in lung cancer and hypermethylation of PYCARD is a marker for late-stage lung cancer, making it a potential predictor of recurrence in patients following surgery for early-stage disease (Machida et al. 2006). CDKN2A is frequently hypermethylated in early-stage cancer and CDKN2B is not methylated in patients with lung cancer.
Twenty sputum samples from individuals with stage III lung cancer or previously resected cancer were examined with both standard and nested MSP to detect methylation. While only a signal from unmethylated sequences was detected with conventional MSP for all samples, the nested assay detected methylated sequences in three samples for PYCARD (representative samples shown for PYCARD, Fig. 4A). Comparison of these results to detection with MS-qFRET was performed in a blinded fashion. A representative spectroscopic trace for two patients with differing methylation is shown in Figure 4B, where a prominent peak seen at 670 nm (Cy5 emission) indicates the presence of a methylated PYCARD promoter. In this case, since higher PCR cycles were used, normalized FRET efficiency (En) (see Methods) for all 20 patients is shown in Figure 4C, which indicates that the same three samples found to be methylated at PYCARD by nested MSP were also detected using MS-qFRET. For CDKN2A, unmethylated bands were detected with both standard MSP and the nested MSP in all 20 patients. While 13 patients were found to have methylated CDKN2A using MS-qFRET, 12 of the same patients also showed methylation using the nested approach, but none were methylated by standard MSP (Supplemental Fig. 4). The difference between nested and MS-qFRET in one patient sample can most likely be attributed to sampling effects seen with the presence of rare methylated DNA (Belinsky et al. 2006). For CDKN2B, both nested and MS-qFRET techniques demonstrated that all patients were unmethylated, suggesting that the enhanced sensitivity of MS-qFRET did not result in false positives (Supplemental Fig. 4). Together, these results illustrate the sensitivity of MS-qFRET in detecting very low amounts of methylation in patient samples. The ability to detect methylation in these clinical samples without the use of a nested approach could make this a promising approach for lung cancer screening.
Discussion
Common approaches to detect gene specific methylation include MSP, nested MSP, and real-time PCR, which all rely on bisulfite-converted DNA (Herman et al. 1996; Eads et al. 2000; Machida et al. 2006). For samples with low concentrations of DNA, nested MSP is frequently used and requires numerous amplification cycles (i.e., >40) (Machida et al. 2006). Drawbacks to the nested approach are that it can yield false-positive results and requires setting up more than one PCR reaction. Additionally, real-time PCR (either SYBR Green or TaqMan) offers a quantification method but is limited by inherent background fluorescence. MS-qFRET overcomes these limitations in a simple endpoint detection format. The unique optical properties of QDs, such as narrow emission bands and large Stokes shift, render them as ideal FRET donors. This allows minimal fluorescent cross-talk and direct excitation of acceptors (Medintz et al. 2003; Zhang et al. 2005) and permits the design of FRET-based assays with extremely low fluorescent background noise. MS-qFRET combines the advantages of the QD-FRET system with MSP. This report characterizes the feasibility and analytical sensitivity of MS-qFRET; demonstrates its ability to detect amplicons with few amplification cycles allowing for quantification of methylation in the log-linear phase of amplification; and directly demonstrates its sensitivity and potential application in methylation detection in patient samples.
Multiplexing allows for a more reliable comparison between methylated and unmethylated status for each individual sample as the input DNA is analyzed simultaneously (Supplemental Fig. 3A). Such multiplex reaction can be extended to a multigene analysis in the same reaction (data not shown). Direct visual inspection of donor quenching facilitates such a quick qualitative read-out (Supplemental Fig. 3B). Unlike most standard methylation detection techniques that are limited by the capacity of the number of wells or detectors, MS-qFRET can screen thousands of samples at a time using a standard UV scanner. Also, the feature of endpoint detection in a small detection volume renders MS-qFRET compatible with the standard microplate reader and can be straightforwardly implemented in the next-generation 1536-well format for high-throughput screening.
Application of MS-qFRET to cancer cell lines, MDS samples, and sputum samples demonstrates utility in a clinical setting. By quantifying methylation in cell lines and MDS patient samples, the application of MS-qFRET in monitoring cancer therapy is highlighted (Fig. 3C,D). A common method to assess gene specific response to epigenetic treatment is through gel electrophoresis and therefore is not quantitative (Cameron et al. 1999; Gore et al. 2006a). One advantage to MS-qFRET is easy adoption into current MSP methodology. Additionally, by assigning values through a q-score, MS-qFRET allows for a greater resolving capability in monitoring methylation reversal by being more sensitive and quantitative (Fig. 3). While one would expect decreased DNA methylation following the treatment with azacitidine, this is not observed in all patients, since some will have disease progression despite epigenetic treatment. In this study, there are not enough patient samples to test the correlation of a patient's gene-specific demethylation to corresponding clinical response, but we anticipate that MS-qFRET may provide an avenue to answer such questions in ongoing and future clinical trials using epigenetic therapy.
The ability to use MS-qFRET for methylation detection in sputum samples (Fig. 4) highlights the feasibility for its future application in routine processing of patient samples with low amounts of DNA such as serum, stool, and urine. Based on prior studies (Machida et al. 2006), we estimate the DNA concentration in the sputum samples to vary from 30 pg/μL to 200 pg/μL. However, this detection is even more challenging since DNA from the tumor or affected tissues represents a small minority of the sample, with most DNA coming from reactive inflammatory cells. Clear demonstration of methylation in patient sputum is observed when compared with the background noise using MS-qFRET (Fig. 4B). Since MS-qFRET is ultrasensitive, it will be a concern that the incidence of false positives will be high. Generally, false positives (for methylation) can arise from nonspecific amplification, which can best be avoided by careful design of primers and setting right controls. MS-qFRET uses the inherent low background signal for a QD-FRET sensor that allows setting of a robust cut-off that can help reduce false positives (Fig. 4C). As demonstrated in the analysis of methylation in sputum, 17 patients did not show methylation of PYCARD. These results were consistent with the nested results. Further, MS-qFRET analysis of CDKN2B and CDKN2A in the same sputum samples corresponded with the nested PCR data highlighting the high sensitivity of this technique in the absence of false positives. The technique is therefore capable of providing equivalent results as the nested approach without the need for an additional PCR step (Fig. 4; Supplemental Fig. 4).
The numerous attributes of QD-FRET nanosensors make them ideal for detecting and quantifying methylation. While the technique in its current setup has been described to be a multistep process, it can eventually be reduced to a single-step process wherein the analysis can be made through the plate spectrophotometer and the results analyzed using software that can read and analyze the spectral curves. The real advantage therefore lies in the high signal-to-noise ratio of QD-FRET sensors that allow for eliminating an extra PCR step, thereby increasing throughput in detection and has the potential for being fully automated. In addition, MS-qFRET is fully compatible with standard MSP (Herman et al. 1996) and significantly transforms this most widely used technology for methylation detection to become a quantitative, high-throughput, and ultrasensitive format via the end-labeling of existing MSP primers and the inclusion of off-the-shelf QDs for fluorescent measurements. Hence, MS-qFRET is a method that can be readily adopted by a broad range of laboratories and will likely have an immediate impact on basic and clinical research.
Methods
DNA isolation and bisulfite modification
IVD was obtained from treatment of leukocyte DNA with SssI methyltransferase. Peripheral blood NL were isolated from blood from the same normal volunteer, sputum samples were obtained from patients with a known smoking history, and bone marrow aspirate samples were obtained from MDS patients. RKO cells were cultured and treated with 1 μM DAC and collected at fixed time points. DAC (1 μM) was added to the cells every 24 h. DNA extraction and bisulfite modification was performed as previously described (Herman et al. 1996).
Primers
The primer sequences are described in Table 1 and have been previously validated (Herman et al. 1996; Machida et al. 2006). The primers for MS-qFRET were replicates of those used in standard MSP except for 5′ labeling of the forward primer with biotin and the reverse primer with an organic fluorophore (Integrated DNA Technologies [IDT]). Labeled primers were HPLC purified.
MSP and nested MSP
For CDKN2A, MSP conditions were 95°C for 15 min, followed by 35 cycles of 30 sec at 95°C, 30 sec at the annealing temperature, 64°C sec and 30 sec at 72°C, with a final extension cycle of 72°C for 5 min. Annealing temperature was 58°C for CDKN2B and PYCARD. Unmethylated (NL), methylated controls (IVD), and water controls (no template added) were used. All PCR products (5 μL) were loaded onto a 2% agarose gel, stained with GelStar (Lonza), and directly visualized under UV illumination. The nested MSP procedure required a two-step PCR process and was performed as previously described (Machida et al. 2006).
MS-qFRET
General procedure
PCR with labeled primers was run as previously described. Products were then subject to PCR purification (QIAquick PCR Purification Kit (50) [Qiagen Corp.] or Illustra MicroSpin G-50 Columns [GE Healthcare], and Illustra MicroSpin G-25 Columns [GE Healthcare]). Final QD concentration was 0.1 nM.
Quantitative analysis
Mixtures of defined methylation levels range from 100%, 75%, 50%, 25%, and 1% of the total 150 ng of input DNA, by varying quantities of IVD diluted in a background of NL. The mixture was used as input template for 16-cycle PCR reaction with labeled CDKN2A primers. To quantify the level of methylation, we defined a “q-score”: a score that is based on the normalized FRET efficiencies of acceptor and donor emission in MS-qFRET. In any FRET process, as the level of the acceptor emission increases, the decay of donor emission increases as well. The FRET efficiency can then be calculated based on the proximity ratio formalism,
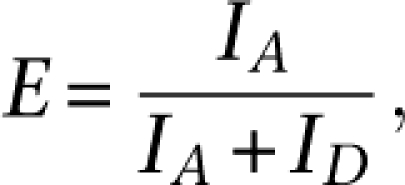 |
where ID and IA correspond to donor and acceptor intensity, respectively. Further, the q-score is determined by normalizing the calculated E for the DNA mixture to an appropriate concentration of IVD only as a methylated control (q-score = 1) and NL only as an unmethylated control (q-score = 0). By including positive and negative controls in every assay, it is possible to create a standard curve to quantify and compare methylation levels of unknown samples using low-amplification cycles.
Ultrasensitive screening
IVD (150 ng) is serially diluted to 1:10,000 and mixed with a background of NL (150 ng). PCR with labeled CDKN2A primers was run for 40 cycles. For analysis, QD concentration is at 5 pM. Upon QD605 conjugation, confocal spectroscopy (Zhang et al. 2005) is used to observe Cy5 peaks.
Determination through visualization
IVD and NL (100 ng) is used as input DNA in a MSP reaction with CDKN2A, CDKN2B, and PYCARD primers for 35 cycles. QD605 concentration is maintained at 2 nM for both conjugation and analysis under a UV lamp.
Multiplexed analysis
CDKN2A-methylated reverse primer is labeled with Alexa594 while the unmethylated reverse primer is labeled with a Cy5 fluorophore. Fifty nanograms of methylated target (IVD) and 75 ng of unmethylated target (NL) are each individually mixed with both unmethylated and methylated primers. A mixture of 35% methylated and 65% unmethylated target (125 ng of total DNA) was also subject to the same PCR conditions and primers. Thirty-five cycles of PCR were run with conditions as previously described. Finally, QD585 at 1 nM is used during conjugation and analysis.
Instrumentation
Fluorescence measurements for MS-qFRET were made using NanoDrop 3300 (NanoDrop). Using this setup, we were able to measure fluorescence readouts with as little as 2 μL of sample. The confocal spectroscope, sensitive at the level of single-molecule fluorescence, was set up and used as previously described (Zhang et al. 2005).
Acknowledgments
We thank Y.P. Ho, T.C. Lim, A. Chen, and Y. Yeh for the help with QD detection and calibration and invaluable advice. This work was supported by the National Cancer Institute grants SPORE P50-CA058184-10 and R21-CA120742-01 and National Science Foundation grants 0546012 and 0725528. V.J.B. was funded by the Hodson Foundation. H.E.C. acknowledges the Flight Attendant Medical Research Institute (FAMRI) for research support.
Footnotes
[Supplemental material is available online at www.genome.org.]
Article published online before print. Article and publication date are at http://www.genome.org/cgi/doi/10.1101/gr.088831.108.
References
- Belinsky SA, Liechty KC, Gentry FD, Wolf HJ, Rogers J, Vu K, Haney J, Kennedy TC, Hirsch FR, Miller Y, et al. Promoter hypermethylation of multiple genes in sputum precedes lung cancer incidence in a high-risk cohort. Cancer Res. 2006;66:3338–3344. doi: 10.1158/0008-5472.CAN-05-3408. [DOI] [PubMed] [Google Scholar]
- Bender CM, Gonzalgo ML, Gonzales FA, Nguyen CT, Robertson KD, Jones PA. Roles of cell division and gene transcription in the methylation of CpG islands. Mol Cell Biol. 1999;19:6690–6698. doi: 10.1128/mcb.19.10.6690. [DOI] [PMC free article] [PubMed] [Google Scholar]
- Brandes JC, van Engeland M, Wouters KA, Weijenberg MP, Herman JG. CHFR promoter hypermethylation in colon cancer correlates with the microsatellite instability phenotype. Carcinogenesis. 2005;26:1152–1156. doi: 10.1093/carcin/bgi058. [DOI] [PubMed] [Google Scholar]
- Brock MV, Hooker CM, Ota-Machida E, Han Y, Guo M, Ames S, Glockner S, Piantadosi S, Gabrielson E, Pridham G, et al. DNA methylation markers and early recurrence in stage I lung cancer. N Engl J Med. 2008;358:1118–1128. doi: 10.1056/NEJMoa0706550. [DOI] [PubMed] [Google Scholar]
- Cameron EE, Bachman KE, Myohanen S, Herman JG, Baylin SB. Synergy of demethylation and histone deacetylase inhibition in the re-expression of genes silenced in cancer. Nat Genet. 1999;21:103–107. doi: 10.1038/5047. [DOI] [PubMed] [Google Scholar]
- Christiansen DH, Andersen MK, Pedersen-Bjergaard J. Methylation of p15INK4B is common, is associated with deletion of genes on chromosome arm 7q and predicts a poor prognosis in therapy-related myelodysplasia and acute myeloid leukemia. Leukemia. 2003;17:1813–1819. doi: 10.1038/sj.leu.2403054. [DOI] [PubMed] [Google Scholar]
- Daskalakis M, Nguyen TT, Nguyen C, Guldberg P, Kohler G, Wijermans P, Jones PA, Lubbert M. Demethylation of a hypermethylated p15/INK4B gene in patients with myelodysplastic syndrome by 5-Aza-2′-deoxycytidine (decitabine) treatment. Blood. 2002;100:2957–2964. doi: 10.1182/blood.V100.8.2957. [DOI] [PubMed] [Google Scholar]
- Eads CA, Danenberg KD, Kawakami K, Saltz LB, Blake C, Shibata D, Danenberg PV, Laird PW. MethyLight: A high-throughput assay to measure DNA methylation. Nucleic Acids Res. 2000;28:e32. doi: 10.1093/nar/28.8.e32. [DOI] [PMC free article] [PubMed] [Google Scholar]
- Esteller M, Catasus L, Matias-Guiu X, Mutter GL, Prat J, Baylin SB, Herman JG. hMLH1 promoter hypermethylation is an early event in human endometrial tumorigenesis. Am J Pathol. 1999;155:1767–1772. doi: 10.1016/S0002-9440(10)65492-2. [DOI] [PMC free article] [PubMed] [Google Scholar]
- Esteller M, Garcia-Foncillas J, Andion E, Goodman SN, Hidalgo OF, Vanaclocha V, Baylin SB, Herman JG. Inactivation of the DNA-repair gene MGMT and the clinical response of gliomas to alkylating agents. N Engl J Med. 2000;343:1350–1354. doi: 10.1056/NEJM200011093431901. [DOI] [PubMed] [Google Scholar]
- Fackler MJ, McVeigh M, Mehrotra J, Blum MA, Lange J, Lapides A, Garrett E, Argani P, Sukumar S. Quantitative multiplex methylation-specific PCR assay for the detection of promoter hypermethylation in multiple genes in breast cancer. Cancer Res. 2004;64:4442–4452. doi: 10.1158/0008-5472.CAN-03-3341. [DOI] [PubMed] [Google Scholar]
- Fahrner JA, Eguchi S, Herman JG, Baylin SB. Dependence of histone modifications and gene expression on DNA hypermethylation in cancer. Cancer Res. 2002;62:7213–7218. [PubMed] [Google Scholar]
- Feinberg AP, Tycko B. The history of cancer epigenetics. Nat Rev Cancer. 2004;4:143–153. doi: 10.1038/nrc1279. [DOI] [PubMed] [Google Scholar]
- Gore SD, Baylin S, Sugar E, Carraway H, Miller CB, Carducci M, Grever M, Galm O, Dauses T, Karp JE, et al. Combined DNA methyltransferase and histone deacetylase inhibition in the treatment of myeloid neoplasms. Cancer Res. 2006a;66:6361–6369. doi: 10.1158/0008-5472.CAN-06-0080. [DOI] [PubMed] [Google Scholar]
- Gore SD, Jiemjit A, Silverman LB, Aucott T, Baylin S, Carraway H, Dauses T, Fandy T, Herman J, Karp JE, et al. Combined methyltransferase/histone deacetylase inhibition with 5-Azacitidine and MS-275 in patients with MDS, CMMoL and AML: Clinical response, histone acetylation and DNA damage. Blood (ASH Annual Meeting Abstracts) 2006b;108:517. [Google Scholar]
- Herman JG, Graff JR, Myohanen S, Nelkin BD, Baylin SB. Methylation-specific PCR: A novel PCR assay for methylation status of CpG islands. Proc Natl Acad Sci. 1996;93:9821–9826. doi: 10.1073/pnas.93.18.9821. [DOI] [PMC free article] [PubMed] [Google Scholar]
- Herman JG, Civin CI, Issa JP, Collector MI, Sharkis SJ, Baylin SB. Distinct patterns of inactivation of p15INK4B and p16INK4A characterize the major types of hematological malignancies. Cancer Res. 1997;57:837–841. [PubMed] [Google Scholar]
- Jones PA, Baylin SB. The fundamental role of epigenetic events in cancer. Nat Rev Genet. 2002;3:415–428. doi: 10.1038/nrg816. [DOI] [PubMed] [Google Scholar]
- Kim DS, Kim MJ, Lee JY, Kim YZ, Kim EJ, Park JY. Aberrant methylation of E-cadherin and H-cadherin genes in nonsmall cell lung cancer and its relation to clinicopathologic features. Cancer. 2007;110:2785–2792. doi: 10.1002/cncr.23113. [DOI] [PubMed] [Google Scholar]
- Laird PW. The power and the promise of DNA methylation markers. Nat Rev Cancer. 2003;3:253–266. doi: 10.1038/nrc1045. [DOI] [PubMed] [Google Scholar]
- Lo YM, Wong IH, Zhang J, Tein MS, Ng MH, Hjelm NM. Quantitative analysis of aberrant p16 methylation using real-time quantitative methylation-specific polymerase chain reaction. Cancer Res. 1999;59:3899–3903. [PubMed] [Google Scholar]
- Machida EO, Brock MV, Hooker CM, Nakayama J, Ishida A, Amano J, Picchi MA, Belinsky SA, Herman JG, Taniguchi S, et al. Hypermethylation of ASC/TMS1 is a sputum marker for late-stage lung cancer. Cancer Res. 2006;66:6210–6218. doi: 10.1158/0008-5472.CAN-05-4447. [DOI] [PubMed] [Google Scholar]
- Medintz IL, Clapp AR, Mattoussi H, Goldman ER, Fisher B, Mauro JM. Self-assembled nanoscale biosensors based on quantum dot FRET donors. Nat Mater. 2003;2:630–638. doi: 10.1038/nmat961. [DOI] [PubMed] [Google Scholar]
- Quesnel B, Guillerm G, Vereecque R, Wattel E, Preudhomme C, Bauters F, Vanrumbeke M, Fenaux P. Methylation of the p15(INK4b) gene in myelodysplastic syndromes is frequent and acquired during disease progression. Blood. 1998;91:2985–2990. [PubMed] [Google Scholar]
- Schuebel KE, Chen W, Cope L, Glockner SC, Suzuki H, Yi JM, Chan TA, Van Neste L, Van Criekinge W, van den Bosch S, et al. Comparing the DNA hypermethylome with gene mutations in human colorectal cancer. PLoS Genet. 2007;3:e157. doi: 10.1371/journal.pgen.0030157. [DOI] [PMC free article] [PubMed] [Google Scholar]
- Shimamoto T, Ohyashiki JH, Ohyashiki K. Methylation of p15(INK4b) and E-cadherin genes is independently correlated with poor prognosis in acute myeloid leukemia. Leuk Res. 2005;29:653–659. doi: 10.1016/j.leukres.2004.11.014. [DOI] [PubMed] [Google Scholar]
- Wang TH, Peng YH, Zhang CY, Wong PK, Ho CM. Single-molecule tracing on a fluidic microchip for quantitative detection of low-abundance nucleic acids. J Am Chem Soc. 2005;127:5354–5359. doi: 10.1021/ja042642i. [DOI] [PubMed] [Google Scholar]
- Yamada Y, Jackson-Grusby L, Linhart H, Meissner A, Eden A, Lin H, Jaenisch R. Opposing effects of DNA hypomethylation on intestinal and liver carcinogenesis. Proc Natl Acad Sci. 2005;102:13580–13585. doi: 10.1073/pnas.0506612102. [DOI] [PMC free article] [PubMed] [Google Scholar]
- Zhang CY, Yeh HC, Kuroki MT, Wang TH. Single-quantum-dot-based DNA nanosensor. Nat Mater. 2005;4:826–831. doi: 10.1038/nmat1508. [DOI] [PubMed] [Google Scholar]