Haemoglobin from Camelus dromedarius provides an interesting case study of adaptation to life in deserts at extremely high temperatures. An ambition to unravel the integrated structural and functional aspects of the casual survival of this animal at high temperatures led the authors to specifically work on this problem. This work reports the preliminary crystallographic study of camel haemoglobin.
Keywords: haemoglobin, Camelus dromedarius, oxygen affinity
Abstract
Haemoglobin is a prototypical allosteric protein that is mainly involved in the transportation of oxygen from the lungs to tissues and of carbon dioxide back to the lungs in an intrinsically coordinated manner to maintain the viability of cells. Haemoglobin from Camelus dromedarius provides an interesting case study of adaptation to life in deserts at extremely high temperatures. An ambition to unravel the integrated structural and functional aspects of the casual survival of this animal at high temperatures led us to specifically work on this problem. The present work reports the preliminary crystallographic study of camel haemoglobin. Camel blood was collected and the haemoglobin was purified by anion-exchange chromatography and crystallized using the hanging-drop vapour-diffusion method under buffered high salt concentration using PEG 3350 as a precipitant. Intensity data were collected using a MAR 345 dtb image-plate detector system. Camel haemoglobin crystallized in the monoclinic space group P21, with one whole biological molecule (α2β2) in the asymmetric unit and unit-cell parameters a = 52.759, b = 116.782, c = 52.807 Å, β = 120.07°.
1. Introduction
Organisms that live in extreme environments, such as extremely cold or hot conditions, are exposed to strong constraints. Their evolution includes special adaptations with significant implications at the biochemical, physiological and molecular levels (Di Prisco & Giardina, 2000 ▶).
The oxygen affinities of different species classified into the same family show significant differences depending on the altitude level they live at (Ostojic et al., 2000 ▶). Members of the camelid family living at different altitudes survive at varying temperatures with different environmental conditions. Structural study of haemoglobins from the camelid family provides an opportunity to relate oxygen affinity to adaptation to extremely high and dry environments.
The ability of camels, the ‘ships of the desert’, to survive in desert conditions without water for long periods of time is rivalled by none. Their ability to withstand heat and dryness does not depend on water storage, but on numerous physiological peculiarities, including many mechanisms aimed at water conservation. The body temperature of dromedaries deprived of water fluctuates by as much as 6 K (307.3–313.8 K) during the day, reaching its maximum in the afternoon and its minimum in the early morning. This reduces heat flow from the environment to the body and prevents the loss of water through perspiration. Camels resist sweating until their body temperature reaches 315 K (Köhler-Rollefson, 1991 ▶).
As body temperature increases, the affinity of haemoglobin for oxygen decreases owing to an increase in the P 50, which facilitates oxygen release (Hsia, 1998 ▶). The oxygen affinity (P 50) of camel haemoglobin is 5.9 in the absence of 2,3-disphosphoglycerate (DPG) and is 9.5 and 12.5 in its presence at 0.2 and 1.0 mM, respectively (Scott et al., 1977 ▶).
A replacement of the amino acid in the second position of the β-chain (βHis2→Asn) in Andean camelids increases the affinity for oxygen by suppressing the binding of DPG and aids in adaptation to high altitude, whereas in Asian and African camel haemoglobins βHis2 binds to DPG and substantially decreases the oxygen affinity. This may be the reason why these camels live in lowland environments (Storz, 2007 ▶). Haematological investigations of adaptation to extreme environments carried out on camels provides an excellent case study by enlightening its significance (Banerjee et al., 1962 ▶; Amin et al., 2007 ▶). This is the first crystallographic study on the three-dimensional structure of haemoglobin from the camelid family.
2. Experimental procedure
2.1. Isolation and purification
Fresh camel blood was collected and subsequently treated with 10% EDTA to avoid clotting (Scott et al., 1977 ▶). Red blood cells (RBC) were isolated from the whole blood by centrifugation at 1500g for 20 min. Isolated RBC were washed three times with two volumes of 0.9%(w/v) saline solution and haemolyzed by the addition of three times the volume of triple-distilled water. After 1 h, the haemolyzed solution was centrifuged at 5000g for 1 h, yielding cell-free haemoglobin solution as supernatant. The haemoglobin solution was carefully removed by suction. The sample was dialyzed in 50 mM phosphate buffer at pH 6.7 overnight, lyophilized and stored at 279 K.
The lyophilized camel haemoglobin sample was reconstituted with 50 mM phosphate buffer pH 6.7 and loaded onto a DEAE-Cellulose anion-exchange chromatographic column (15 × 1.5 cm) equilibrated with the same buffer. The column was initially eluted with 50 mM phosphate buffer pH 6.7, followed by stepwise elution with various concentrations of sodium chloride in the same buffer. A single peak was obtained at 0.1 M sodium chloride (Balasubramanian et al., 2009 ▶). The homogeneity of the purified camel haemoglobin was confirmed by native PAGE using silver staining as shown in Fig. 1 ▶ (Davis, 1964 ▶). The purified camel haemoglobin fractions were taken and dialyzed against 50 mM phosphate buffer pH 6.7 for 6 h. The dialyzed samples were then lyophilized and stored at 279 K.
Figure 1.

10% silver-stained native PAGE showing purified (lane 1) and partially purified (lane 2) camel haemoglobin.
2.2. Crystallization
Camel haemoglobin was crystallized at room temperature under buffered high salt concentration (Balasubramanian et al., 2009 ▶) using the hanging-drop vapour-diffusion method. Lyophilized camel haemoglobin powder was reconstituted with 50 mM phosphate buffer pH 6.7 and the concentration was estimated to be 30 mg ml−1 using the Bradford absorption method at 595 nm (Bradford, 1976 ▶). Samples were screened with various precipitants such as 2-methyl-2,4-pentanediol (MPD) and PEGs in the range 400–10 000 to crystallize the camel haemoglobin.
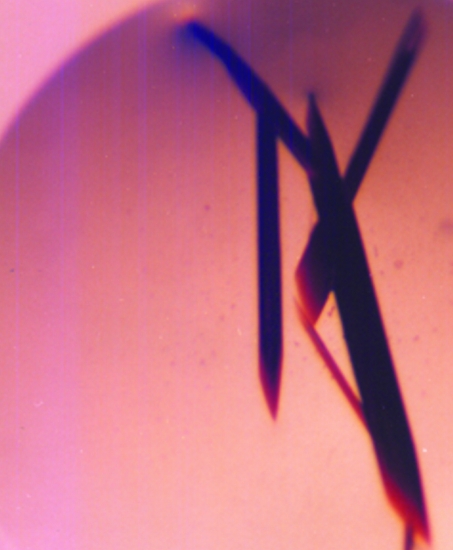
Diffraction-quality crystals were obtained from a drop containing 3 µl protein solution and 2 µl 45% PEG 3350 in 50 mM phosphate buffer pH 6.7, 1 M NaCl equilibrated against 1 ml reservoir containing the same solution. The crystals obtained after a week are shown in Fig. 2 ▶.
Figure 2.
Crystals of camel haemoglobin.
2.3. Data collection and processing
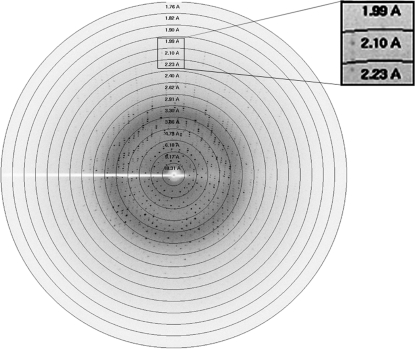
A crystal of dimensions 0.6 × 0.3 × 0.3 mm was mounted in a cryoloop and soaked in a cryoprotectant solution consisting of 25% glycerol for 30 s. Intensity data were collected using a MAR 345 dtb image plate at the in-house G. N. Ramachandran X-ray facility from a crystal cooled to 100 K using an Oxford cryosystem. The diffraction pattern of camel haemoglobin is shown in Fig. 3 ▶. Data-collection and data-processing statistics are presented in Table 1 ▶. The data sets collected were indexed, integrated, merged and scaled using the AUTOMAR and SCALEPACK software packages (Bartels & Klein, 2003 ▶).
Figure 3.
Diffraction pattern of camel haemoglobin with resolution rings.
Table 1. Data-collection and data-processing statistics for camel haemoglobin.
Values in parentheses are for the highest resolution shell.
| X-ray source | Cu Kα |
| Wavelength (Å) | 1.5418 |
| Temperature (K) | 100 |
| Oscillation angle (°) | 1 |
| No. of frames used | 120 |
| Exposure time (min) | 1 |
| Space group | P21 |
| No. of crystals used | 1 |
| Crystal size (mm) | 0.6 × 0.3 × 0.3 |
| Crystal-to-detector distance (mm) | 135 |
| Unit-cell parameters (Å, °) | a = 52.759, b = 116.782, c = 52.807, β = 120.07 |
| Resolution range (Å) | 20.0–2.0 (2.07–2.00) |
| Observed reflections | 87740 |
| Unique reflections | 35552 |
| Matthews coefficient (VM) (Å3 Da−1) | 2.25 |
| Solvent content (%) | 45.40 |
| No. of molecules in ASU | 1 |
| Rmerge† (%) | 7.74 (32.02) |
| Average redundancy | 2.43 (2.40) |
| Completeness | 94.2 (92.4) |
| Average I/σ(I) | 5.2 (1.0) |
R
merge = 
 , where I
i(hkl) is the measured intensity of reflection I and 〈I(hkl)〉 is the mean intensity.
3. Results and discussion
Camel haemoglobin crystallized in the monoclinic space group P21 and the crystal-packing parameters revealed that a whole biological molecule was present in the asymmetric unit, with a solvent content of 45.40% (Matthews, 1968 ▶).
Initial phase determination was attempted using the molecular-replacement method with aquomet porcine haemoglobin as a starting model (PDB id 2pgh) using AMoRe as implemented in the CCP4 suite (Collaborative Computational Project, Number 4, 1994 ▶). Further work to solve, model and refine the structure is in progress.
Acknowledgments
The authors wish to thank the Council of Scientific and Industrial Research (CSIR) for the award of a Senior Research Fellowship. The authors also thank Mr C. Raja of CAS in Crystallography and Biophysics, University of Madras, Chennai for his help during data collection. The Department of Biotechnology (DBT), Government of India is gratefully acknowledged for financial assistance for the creation of the in-house G. N. Ramachandran X-ray facility in the department.
References
- Amin, A. S., Abdoun, K. A. & Abdelatif, A. M. (2007). Pak. J. Biol. Sci.10, 1250–1256. [DOI] [PubMed]
- Balasubramanian, M., Moorthy, P. S., Neelagandan, K. & Ponnuswamy, M. N. (2009). Acta Cryst. F65, 313–316. [DOI] [PMC free article] [PubMed]
- Banerjee, S., Bhatacharjee, R. C. & Singh, T. I. (1962). Am. J. Physiol.203, 1185–1187. [DOI] [PubMed]
- Bartels, K. S. & Klein, C. (2003). The Automar Manual, v.1.4. Norderstedt, Germany: MAR Research GmbH.
- Bradford, M. M. (1976). Anal. Biochem.72, 248–254. [DOI] [PubMed]
- Collaborative Computational Project, Number 4 (1994). Acta Cryst. D50, 760–763.
- Davis, B. J. (1964). Ann. NY Acad. Sci.121, 404–423.
- Di Prisco, G. & Giardina, B. (2000). Hemoglobin Function in Vertebrates: Molecular Adaptation in Extreme and Temperate Environments, edited by G. Di Prisco, B. Giardina & R. E. Weber, pp. 1–22. Italy: Springer-Verlag.
- Hsia, C. C. W. (1998). N. Engl. J. Med.338, 239–247. [DOI] [PubMed]
- Köhler-Rollefson, I. U. (1991). Mamm. Species, 375, 1–8.
- Matthews, B. W. (1968). J. Mol. Biol.33, 491–497. [DOI] [PubMed]
- Ostojic, H., Monge, C. & Cifuentes, V. (2000). Biol. Res.33, 5–10. [DOI] [PubMed]
- Scott, A. F., Bunn, H. F. & Brush, A. H. (1977). J. Exp. Zool.201, 269–288. [DOI] [PubMed]
- Storz, J. F. (2007). J. Mammal.88, 24–31.


