Abstract
Patients with mutations in the thyroid hormone receptor β (TRβ) gene manifest resistance to thyroid hormone (RTH), resulting in a constellation of variable phenotypic abnormalities. To understand the molecular basis underlying the action of mutant TRβ in vivo, we generated mice with a targeted mutation in the TRβ gene (TRβPV; PV, mutant thyroid hormone receptor kindred PV) by using homologous recombination and the Cre/loxP system. Mice expressing a single PVallele showed the typical abnormalities of thyroid function found in heterozygous humans with RTH. Homozygous PV mice exhibit severe dysfunction of the pituitary–thyroid axis, impaired weight gains, and abnormal bone development. This phenotype is distinct from that seen in mice with a null mutation in the TRβ gene. Importantly, we identified abnormal expression patterns of several genes in tissues of TRβPV mice, demonstrating the interference of the mutant TR with the gene regulatory functions of the wild-type TR in vivo. These results show that the actions of mutant and wild-type TRβ in vivo are distinct. This model allows further study of the molecular action of mutant TR in vivo, which could lead to better treatment for RTH patients.
The thyroid hormone 3,3′,5-triiodo-l-thyronine (T3) regulates growth, development, and differentiation. Its actions are mainly mediated through thyroid hormone receptors (TRs), which are ligand-dependent transcription factors (1, 2). Three ligand-activated TR isoforms have been identified, TRα1, TRβ1, and TRβ2, which are derived from the TRα and TRβ genes, respectively. Each TR isoform has a unique developmental and tissue-specific expression (1, 2). TR binds to specific DNA sequences known as thyroid hormone response elements (TRE) in the promoter regions of T3 target genes. The transcriptional activity of TR depends not only on the types of TRE but also on a host of coregulatory proteins (3).
RTH is a syndrome characterized by reduced sensitivity of tissues to the action of thyroid hormone. This condition is characterized by elevated levels of circulating thyroid hormones associated with normal or high levels of serum thyroid-stimulating hormone (TSH) (4). The most common form of RTH is familial with autosomal dominant inheritance (4). Patients are usually heterozygotes with only one mutant TRβ gene, and the symptoms are mild. Moreover, clinical manifestations are variable among families with RTH and also among affected family members. Some of the clinical features that have been reported include goiter, short stature, decreased weight, tachycardia, hearing loss, attention deficit–hyperactivity disorder, decreased IQ, and dyslexia (4). One single patient homozygous for a mutant TRβ has been reported (5). This patient displayed a complex phenotype of extreme RTH with very high levels of thyroid hormone and TSH. Most TRβ mutants derived from RTH patients have reduced T3-binding affinities and transcriptional capacities. These TRβ mutants exhibit a dominant-negative effect when cotransfected with wild-type TRs (6, 7). TRβ mutants that have defects in the interaction with corepressors and coactivators have also been reported (8, 9).
Several transgenic mouse models expressing TRβ1 mutants have been developed, with the aim of understanding the mechanisms of action of TRβ1 mutants in vivo (10–14). However, these mouse models were generated by using heterologous promoters resulting in mild phenotypes (10, 11, 14) and the expression of the mutants restricted to specific organs (11–14). The restrictive expression prevents comprehensive understanding of the action of TRβ1 mutants in a physiological context. We therefore generated mice with a targeted TRβ mutation (mutant PV) by using homologous recombination and the Cre/loxP system. PV was derived from a patient with severe RTH characterized by elevated thyroid hormone levels accompanied by normal TSH, short stature, goiter, and tachycardia (15). PV has an unusual mutation in exon 10, a C-insertion at codon 448, which produces a frameshift of the carboxyl-terminal 14 amino acids of TRβ1 (15). This naturally occurring mutation was chosen for two reasons. First, in vitro characterization of PV mutant showed completely lost T3-binding and transactivation activities. PV also strongly interferes with the transactivation activity of wild-type TRs in vitro. Therefore, this TRβ mutant is more likely to produce phenotypic changes in the mouse. Second, unlike the missense mutations or single amino acid deletion of TRβ found in other patients, this unique frame-shifted mutated sequence is immunogenic, for which high-affinity specific antibodies have been developed (16). These antibodies should allow us to ask questions such as whether there is a correlation of the severity of RTH with the level of expression of mutant protein in affected tissues.
The present study shows that consistent with the findings in RTH patients, the pituitary–thyroid axis was mildly impaired in heterozygous TRβPV/+ mice and severely affected in homozygous TRβPV/PV mice. TRβPV/PV mice also manifest impaired weight gain and delayed bone development. Several genes in the affected tissues of TRβPV mice were shown to have abnormal expression patterns, demonstrating the in vivo interference of the mutant TRβ with the gene regulatory functions of the wild-type receptors.
Materials and Methods
Preparation of PV Mutant Mice.
A TRβ mouse genomic clone was isolated from an ES-129 P1 Library (Genome Systems, St. Louis) by using primers specific for the TRβ gene. After mapping the genomic sequences in the regions of exons 8, 9, 10 and the down-stream sequences of exon 10, a 17.5-kb targeting vector was constructed (see Fig. 1A). A PV mutation site was generated in exon 10 with a C insertion at the coding nucleotide position 1642. In addition, a BamHI site was introduced at the coding nucleotides 1668–1673 without changing the amino acid sequence of the PV mutant. The neomycin resistance gene (NeoR), flanked by two LoxP sequences, was placed 1 kb downstream of the polyA site. The thymidine kinase gene (TK) was placed at the 3′ terminus of the targeting vector. The lengths of the 5′ and 3′ arms were 5.4 kb and 5.6 kb, respectively.
Figure 1.
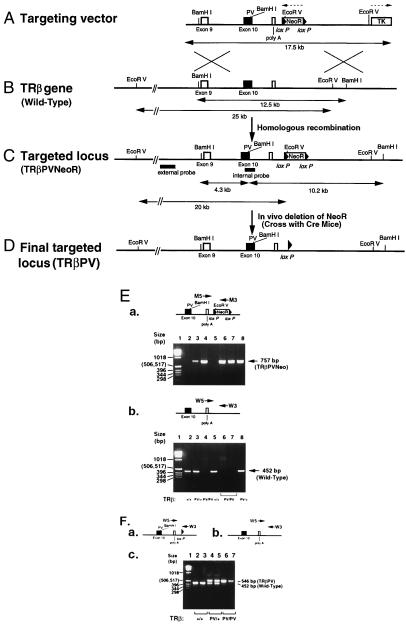
Targeting of the PV mutation onto the TRβ gene locus by homologous recombination. (A) Schematic representation of the PV targeting vector. The 17.5-kb targeting vector contains the PV mutation in exon 10. The locations of the NeoR (flanked by two LoxP sequences) and the HSV-TK genes are as indicated. The directions of transcription of NeoR and HSV-TK are indicated by dotted arrows. (B) Restriction map of the wild-type TRβ gene locus. The expected size of the fragments digested by BamHI and EcoR V, which were detected by internal and external probes (C), respectively, are indicated. (C) Targeting the PV mutation into the TRβ gene locus via homologous recombination (TRβPVNeoR). The expected sizes of the fragments of the targeted locus digested by BamHI and EcoRV, which were detected by the internal and external probes, are indicated. (D) The final targeted locus (TRβPV). The NeoR gene was deleted in vivo by crossing the TRβPV/PVNeoR mice with Ella-Cre mice (19). (E) Genotyping of TRβPVNeoR mice. (a) Diagram: Primers used in the PCR analysis of TRβPVNeoR mice. Panel: PCR analysis of TRβPVNeoR mice. The 757-bp fragment from the TRβPVNeoR mice was detected when the pair of primers M5 and M3 was used in PCR. (b) In a separate PCR by using the genomic DNA from the same mice, the wild-type mice yielded a 452-bp fragment (panel) when the pair of primers W5 and W3 was used (diagram). From the two separate runs of PCR, the genotypes of TRβPVNeoR mice were determined. Lanes 2 and 5: wild-type mice; lanes 3 and 8: TRβPV/+NeoR mice; lanes 4, 6 and 7: TRβPV/PVNeoR mice. (F) Genotype analysis of TRβPV mice. Fragments (452 and 546 bp) obtained by PCR from (a) TRβPV and (b) wild-type mice. (c) The actual genotype analysis.
The targeting vector was linearized by XbaI digestion and transfected (25 μg) into the TC-1 embryonic stem cells (17). Recombinant clones were treated with 400 μg/ml G418 for positive selection and 2 μM gancyclovir for negative selection. Seven recombinant clones were identified by Southern blotting analysis. The clones were microinjected into C57BL/6J blastocysts to produce chimeras, which were crossed with NIH Black Swiss mice to establish germ-line transmission (18). Mice harboring the targeted PV mutation and the NeoR gene are designated as TRβPVNeoR mice (Fig. 1C).
TRβPVNeoR mice were genotyped by Southern blotting analyses and/or PCR by using two sets of primers. For the identification of the wild-type allele, the sequence of the 5′-primer (W5) is: 5′-TCCCCAAGCCAGCATCCCGACC, and the 3′-primer (W3) is: 5′-CGGGCAAATCCTTACCTGG. For the identification of the mutant allele, the 5′-mutant primer (M5) is: 5′-TGCAGTGGCGATGGCATC, and the 3′-primer (M3) is: 5′-CTGACCGCTTCCTCGTGCTTTACG. PCR reactions were carried out for 35 cycles (94°C, 30 sec; 59°C, 30 sec; 74°C; 30 sec for the determination of the wild-type allele) (94°C, 30 sec; 63°C, 30 sec; 74°C; 30 sec for the mutant allele) in a buffer containing MgCl2 by using TaKaRa EX-Taq polymerase (Intergen, Purchase, NY).
To delete the NeoR gene from the targeted locus in vivo, TRβPVNeoR mice (Fig. 1C) were crossed with homozygous Ella-Cre transgenic mice (19). The resulting offspring were genotyped by Southern blot and PCR analyses by using primers W5 and W3. Mice harboring the targeted PV mutation, but without the NeoR gene, are designated as TRβPV/PV and TRβPV/+ for the homozygous and heterozygous mutant mice, respectively.
Determination of the Expression of PV Mutant RNA in Tissues by Reverse Transcription–PCR (RT-PCR).
Total RNA was prepared by using Trizol Reagent (Life Technologies, Rockville, MD). RT-PCR was carried out by using poly(dT) as a primer for cDNA synthesis by using SuperScript II reverse transcriptase (Life Technologies). Fragments (688 bp) from the wild-type TR or (689 bp) from the mutant PV were amplified in the presence of 5′-primer (primer N): 5′ ATGGGGAAATGGCAGTGACACGAG and 3′-primer (primer C): 5′-TGGGAGCTGGTGATGACTTCGTGC by using Taq DNA polymerase (Perkin–Elmer). The mutant PV sequence contained a BamHI site that was not present in the mouse endogenous TRβ gene. PCR products were digested with BamHI to yield two 380- and 309-bp fragments for mutant PV, as analyzed by gel electrophoresis.
Northern Blot Analyses.
Total RNA (5–10 μg) was used for Northern blot analysis. After electrophoresis, RNA was transferred onto membranes (Hybond-N+, Amersham Pharmacia), which were hybridized with appropriate probes. cDNA clones for TSHα, TSHβ, growth hormone (GH), malic enzyme (ME), spot 14, and 5′-deiodinase I (5′-DI-I) were labeled with [α-32P]dCTP by using a random primer hexamer protocol. For quantification, the intensities of the mRNA bands were normalized against the intensities of GAPDH mRNA (n = 3). The blots were stripped and rehybridized with a 32P-labeled GAPDH cDNA. Quantification was performed by using the Molecular Dynamics Phosphor-Imager (Molecular Dynamics).
Hormone Assays and Determination of Serum Cholesterol.
Serum levels [total l-thyroxine (T4) and T3] were determined by using Gamma Coat T4 or T3 assay RIA kit (DiaSolin, Stillwater, MN) according to the manufacturer's instructions. TSH levels in serum were measured as described (20).
Histology and Immunohistochemistry.
Thyroid glands were fixed in 10% neutral buffered formalin and subsequently embedded in paraffin. Five-micrometer-thick sections were prepared and stained with hematoxylin and eosin for microscopic examination.
Pituitaries from TRβPV/PV mice and wild-type littermates were fixed in 10% formalin in PBS for 2 h at 23°C, dehydrated, and embedded in paraffin. Five-micrometer-thick sections were deparaffinized in xylene, washed in ethanol, then treated with antigen unmasking solution (Vector Laboratories) and heated in a microwave oven for 5 min. The sections were then blocked in 1% BSA in PBS for 30 min at 23°C, followed by sequential incubations in rabbit anti-mouse TSH antiserum [1:1,000 dilution in BSA–PBS; Biogenesis (Bournemouth, U.K., catalogue no. 8922-6009)] for 30 min at 23°C, washed with PBS, then incubated with affinity-purified goat anti-rabbit IgG conjugated to horseradish peroxidase (Jackson ImmunoResearch). After washing in PBS, the sections were incubated in diaminobenzidine substrate solution (10 min, 23°C) followed by dehydration and mounting under cover slips without counterstains. Unstained sections were then examined by using bright-field as well as phase-contrast microscopy, and digital images were captured from these sections by using a ×20 objective and a Dage 300 CCD camera with a Zeiss Axioplan 2 microscope. These images were then printed, and nuclei of all cells in the field were counted by using the phase contrast image. The cells showing TSH labeling were then counted in the parallel bright-field image of the same field. The total numbers of cells counted for the pituitaries from the TRβPV/PV and wild-type mice were 866 and 655, respectively.
Data Analysis.
All data are expressed as mean ± SE. Statistical analyses used the student's t test, and P < 0.05 was considered significant.
Results
Generation of Mice with Targeted TRβ Mutant PV.
The targeting vector is shown in Fig. 1A. Positive embryonic stem (ES) clones were identified by using both internal and external probes (Fig. 1 B and C). BamHI digests of the genomic DNA from two positive clones revealed 12.5-, 10.2-, and 4.3-kb fragments when hybridized with the internal probe encompassing the PV mutation site in exon 10 (data not shown), whereas the control showed the expected 12.5-kb band (data not shown). When the EcoRV digests of the same positive ES clones were hybridized with the external probe, an additional 20-kb fragment was detected together with the 25-kb fragment derived from the wild-type allele (data not shown). These results indicate that the PV mutation was correctly targeted onto the TRβ gene locus.
Mice carrying the TRβPVNeoR gene (Fig. 1C) were identified by PCR by using DNA extracted from tails. By using primers for detection of mutant genes (M5 and M3; Fig. 1E-a Upper) or wild-type (W5 and W3; Fig. 1E-b Upper), typical results are shown in Fig. 1E-a and b Lower, respectively. The size of PCR products was 757 bp (lanes 3, 4, 6- 8 from different mice; Fig. 1E-a Lower) and 452 bp (lanes 2, 3, 5, and 8; Fig. 1E-b Lower) from the mutant and wild-type genes, respectively.
Northern blot analyses of PV gene expression in TRβPV/+NeoR heterozygous and TRβPV/PVNeoR homozygous mice (Fig. 1C) indicate that the expression of the PV mutant allele was repressed as compared with the wild-type TRβ allele (data not shown). Because the NeoR gene was flanked by two loxP sequences in the targeted locus (Fig. 1 A and C), it was possible to delete the NeoR gene in vivo by crossing the TRβPV/PVNeoR homozygous mice with an Ella-Cre mice (19). PCR analysis by using primers W5 and W3 (Fig. 1F) yielded a 546-bp fragment indicative of the removal of the NeoR gene (see Fig. 1 B–D). Mice with the final targeted locus [without NeoR gene (Fig. 1D)] were designated as TRβPV/+ for the heterozygous mice and TRβPV/PV for the homozygous PV mutant mice.
The PV Gene Is Expressed in All Expected Target Tissues Examined.
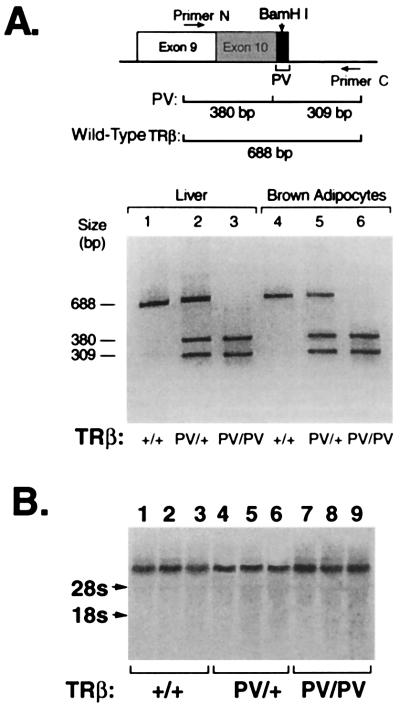
RT-PCR was used to assess the expression of the PV mutant allele at the RNA level. Primers flanking the mutated exon 10 were used, and the resultant cDNA was digested with BamHI (Fig. 2A Upper). The cDNA derived from the mutant allele yielded two fragments with sizes 380 and 309 bp, whereas a 688-bp fragment was obtained from the wild-type mRNA. Fig. 2A Lower shows the representative mRNA expression patterns in the liver and brown adipocytes of TRβPV/+ mice (lanes 2 and 5) and TRβPV/PV mice (lanes 3 and 6), respectively. This analysis shows that PV allele was expressed in the cerebrum, cerebellum, pituitary, heart, muscle, white adipocytes, lung, spleen, and kidney (data not shown), indicating that the PV mutant allele was detected in expected T3 target tissues.
Figure 2.
Expression of PV mRNA in the liver and brown adipocytes. RT-PCR: Total RNA was isolated from liver (lanes 1–3) and brown adipocytes (lanes 4–6). RT-PCR was carried out by using the primers N and C as described in Materials and Methods. (A) Diagram: A 689- or 688-bp cDNA fragment was obtained from the mutant RNA and wild-type RNA, respectively. However, only the cDNA from the mutant RNA could be restricted with BamHI to yield two 380- and 309-bp fragments. (B) Northern blot analysis. The probe was the mouse TRβ1 cDNA. Results were from three mice of each genotype, as marked.
The expression of the PV allele in the liver was further confirmed by Northern blot analysis by using a cDNA probe specific to the TRβ gene (Fig. 2B). Lanes 7–9 (from three mice) indicate that the level of the transcription of TRβPV gene in the TRβPV/PV mice was not significantly different from those in the TRβPV/+ (lanes 4–6 for three mice) and in the wild-type TRβ+/+ littermates (lanes 1–3 for three mice). Similarly, expression of the PV and wild-type TRβ allele were similar in the heart and brain (data not shown). These findings indicate that the expression of the TRβPV gene was not affected by the presence of the PV mutation.
Resistance to Thyroid Hormone Action on the Pituitary–Thyroid Axis.
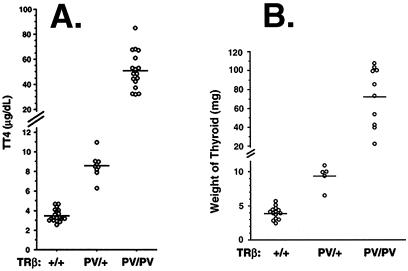
Consistent with findings in heterozygous patients with the common form of RTH, the mean total T4 (TT4) concentration in TRβPV/+ mice was 8.6 ± 0.4 μg/dl (n = 9), which is 2.5-fold higher than that in the wild-type mice (3.5 ± 0.1 μg/dl; n = 22) (Fig. 3A). The 15-fold increase in the circulating TT4 (51 ± 3.6 μg/dl; n = 17) observed in the TRβPV/PV mice was similar to that observed in the single patient homozygous for a mutant TRβ gene (5).
Figure 3.
Elevated levels of total T4 and enlarged thyroid glands in TRβPV mice. (A) Serum levels of total T4 in adult mice. (B) The corresponding sizes of thyroid glands. Each point represents a value for a single mouse and horizontal bars represent the mean values.
The serum total T3 (TT3) concentration was also increased in TRβPV mice. The mean TT3 values for TRβPV/+ and TRβPV/PV mice were 2.8 ± 0.17 ng/ml (n = 23) and 12.6 ± 1.3 ng/ml (n = 16), respectively. Compared with the TT3 of the wild-type mice (1.5 ± 0.1 ng/ml; n = 18), these T3 concentrations represent a 2- and 9-fold increase for the TRβPV/+ and TRβPV/PV, respectively.
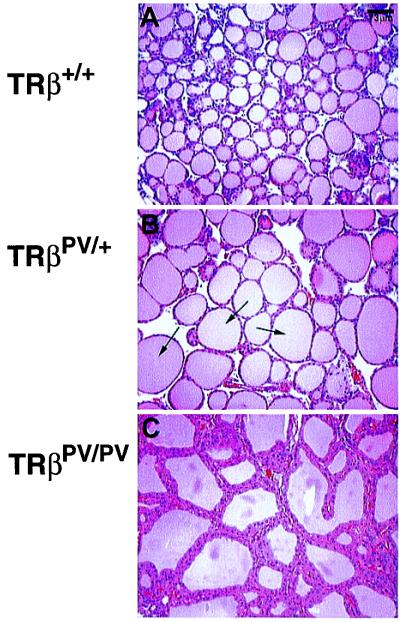
The degree of thyroid gland enlargement was proportional to the magnitude of thyroid hormone elevation in serum of TRβPV/+ and TRβPV/PV mice. As shown in Fig. 3B, the mean size of the thyroid gland (73 ± 9.8 mg; n = 10) from TRβPV/PV mice was ≈18-fold larger than that of the wild-type mice (4 ± 0.2 mg; n = 14). The mean size of the thyroid gland in TRβPV/+(9.4 ± 0.8 mg; n = 5) was 2.4-fold larger than that in the wild-type mice. Histological evaluation indicates a dramatic increase in the size of individual follicles in TRβPV/+ (Fig. 4B) vs. wild-type mice (Fig. 4A) and extensive hyperplasia of the epithelium in TRβPV/PV mice (Fig. 4C).
Figure 4.
Histology of thyroid glands of TRβPV mice. Extensive hyperplasia of the thyroid gland dissected from an 11-week-old female TRβPV/PV mouse (C) and a significant increase in follicle size in a TRβPV/+ mouse (arrows, B), as compared with the histology of TRβ+/+ seen in A (×137).
Stimulation of TSH secretion also reflected the severity of RTH (Fig. 5A). In TRβPV/+ mice, TSH was 2.1-fold higher (121.9 ± 24.8 microunits/ml; n = 29) as compared with the wild-type mice (58 ± 8.9 microunits/ml; n = 21). These results indicate that the pituitary is resistant to the action of thyroid hormone because TRβPV/+ mice had 2.5-fold higher TT4 and 2-fold elevated TT3. A remarkable resistance was observed in the TRβPV/PV mice, showing a 412-fold higher serum TSH level (23,887 ± 4,408 microunits/ml; n = 7) in the presence of 15- and 9-fold increase in serum TT4 and TT3 levels, respectively. Again, similarly extraordinary increase (≈400-fold the normal) in the level of serum TSH was noted in the patient homozygous for a mutated TRβ gene (5).
Figure 5.
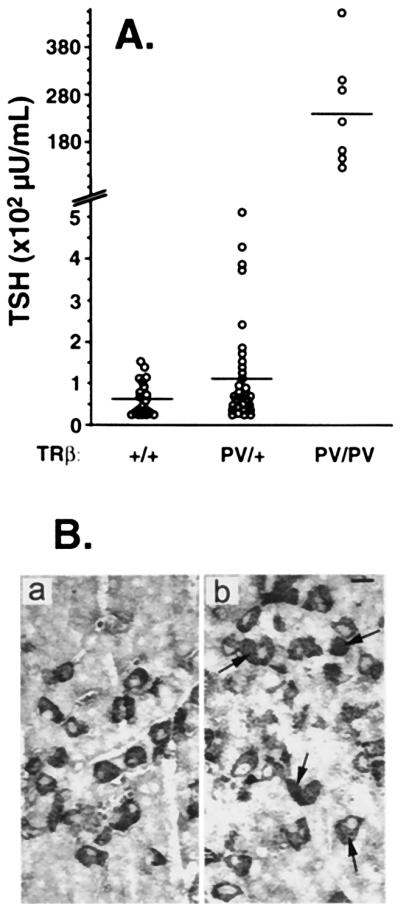
Elevated serum TSH levels in TRβPV mice (A) and increases in the number of thyrotrophs (B). (A) Mean TSH levels in TRβPV/+ and TRβPV/PV mice were 2.1- and 411-fold elevated in 3- to 4-month-old mice, respectively. The horizontal bars represent mean values. (B) TSH-secreting cells were increased in the pituitary of TRβPV/PV mice. TSH-positive cells, indicated by arrows, were counted. The number of cells counted in the pituitary of the wild-type TRβ+/+ (a) and TRβPV/PV mice (b) were 866 and 655, respectively.
We also examined whether the distribution of TSH secreting cells in the pituitary was affected by the expression of the PV mutant (Fig. 5B). By using an anti-TSH antibody, we found that the percentages of positively staining cells were 11.29 ± 0.76 (n = 866), 10.7 ± 2.0 (n = 751), and 19.31 ± 3.63 (n = 655) for the wild-type, TRβPV/+, and TRβPV/PV mice, respectively. Even though the percentage of TSH positive cells was higher in the TRβPV/PV mice, the histologic pattern of distribution of thyrotrophs was not significantly different from normal with no localized foci of selective hyperplasia. The similar percentage of thyrotrophs in the pituitaries of TRβPV/+ and TRβ+/+ mice indicates resistant response to the elevated of thyroid hormones in TRβPV/+ mice. The ≈2-fold increase in the number of thyrotrophs likely accounts for up-regulation in the synthesis of TSH because of the action of mutant PV in the pituitary. Taken together, it is clear that the PV mutant interfered with the normal regulatory functions of wild-type TR in the pituitary.
Retarded Growth in TRβPV Mice.
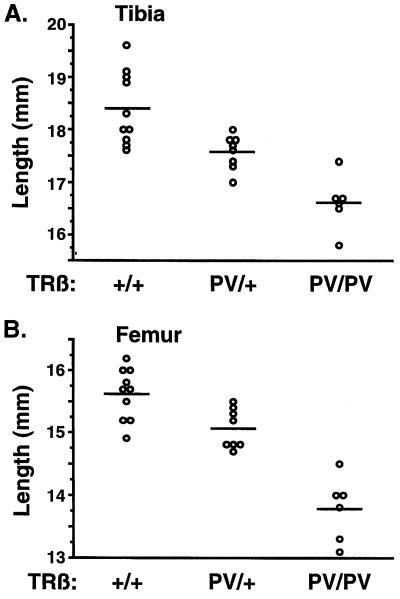
Growth retardation in TRβPV mice was manifested as delayed bone development and impaired weight gain. As shown in Fig. 6A, the mean lengths of tibias were 18.4 ± 0.2 mm (n = 10), 17.6 ± 0.1 mm (n = 8), and 16.6 ± 0.2 mm (n = 6) for TRβ+/+, TRβPV/+, and TRβPV/PV mice, respectively. Compared with the wild-type mice, these were significant reductions of 10% and 5% in the lengths of tibias of TRβPV/PV and TRβPV/+ mice, respectively. Similarly, the mean lengths of femurs were 15.6 ± 0.1 mm (n = 10), 15.1 ± 0.1 mm (n = 8), and 13.8 ± 0.2 mm (n = 6) for TRβ+/+, TRβPV/+, and TRβPV/PV mice, respectively (Fig. 6B). These values represent significant reductions of 12% and 4% in the lengths of femurs for TRβPV/PV and TRβPV/+ mice, respectively. The abnormalities in bone development seen in TRβPV mice were not detected in TRβ−/− mice (21).
Figure 6.
Delayed bone development in TRβPV mice. (A) Lengths of tibias and (B) femurs show significant delayed bone development in TRβPV/+ and TRβPV/PV mice.
Impaired weight gain was detected in both male and female TRβPV/PV mice. TRβPV/PV mice were smaller (17–23%) than wild-type TRβ+/+ littermates at all ages examined. TRβPV/PV mice also exhibited a reduced growth spurt by 25–40% during the age 3–7 weeks (data not shown). However, no significant differences in pup weights and growth rates were detected between TRβPV/+ and TRβ+/+ mice (data not shown).
Alteration in the Expression Patterns of T3-Target Genes in Tissues of TRβPV Mice.
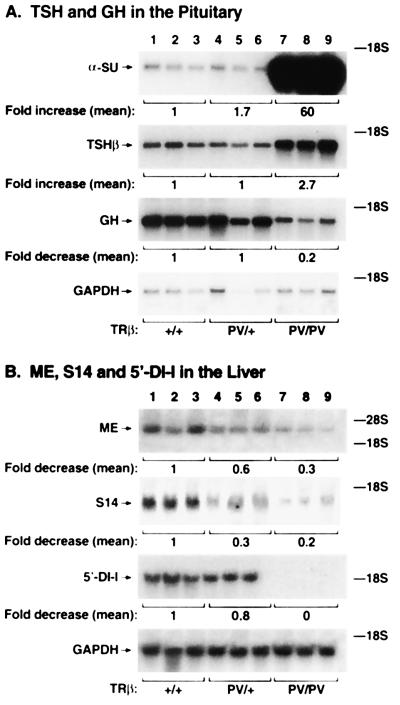
As a first step to understand the molecular action of PV in vivo, we evaluated the expression of T3 target genes in the tissues of TRβPV mice. Fig. 7A shows the expression of TSH and GH mRNA in the pituitary gland. TSH consists of two polypeptides, the TSH-specific β subunit and the common α-glycoprotein subunit (α-SU; also a subunit for gonadotropins), whose expression is suppressed by T3. However, despite the high circulating thyroid hormone levels, Northern blot analysis indicates that α-SU mRNA levels in the pituitaries of TRβPV/PV and TRβPV/+ mice were 60- and 1.7-fold higher than that of the wild-type mice (Fig. 7A). A lesser but significant effect of the PV mutant on the expression of the TSHβ gene was also observed (Fig. 7A). The TSHβ mRNA level in the pituitaries of TRβPV/PV mice was 2.7-fold higher than that in the wild-type mice. The TSHβ mRNA level in the TRβPV/+ mice was not repressed as it should be by the elevated thyroid hormone levels, suggesting a reduced hormone-mediated repression of TSHβ mRNA in the presence of PV. The latter results clearly indicate the interference of PV mutant with the gene regulatory function of the wild-type receptors on the expression of these α-SU and TSHβ genes, albeit more pronounced for α-SU gene.
Figure 7.
The expression of T3-target genes in TRβPV mice was altered. Total RNA was isolated from the pituitaries and liver of mice (three for each group of 8-week-old male mice). The intensities of the bands were quantified by using a Molecular Dynamics PhosphorImager. The levels of expression of both genes were normalized by using GAPDH mRNA. The mean values of three experiments are shown and expressed as the fraction (fold) change from the value in the TRβ+/+ mice.
We further carried out Northern blot analyses of the positively T3-regulated genes in the pituitary. As shown in Fig. 7A, instead of being activated by the presence of the high circulating thyroid hormone levels, the expression of GH in the pituitaries of TRβPV/PV mice was repressed to 20% of that seen in the wild-type mice. The GH mRNA level in the TRβPV/+ mice was not increased compared with the wild-type mice, showing a reduced GH mRNA response to the elevated thyroid hormone levels resultant from the presence of one single PV allele. Taken together, these results indicate that the response to thyroid hormone of both positively and negatively T3-regulated genes is attenuated in the pituitary of TRβPV mice.
The positively T3-regulated genes in the liver of TRβPV mice also show reduced expression. As shown in Fig. 7B, the expression of ME, S14, and 5′-DI-I genes was reduced to 0.2, 0.3, and 0.8 in TRβPV/+ mice, respectively, compared with wild-type mice. The expression of ME and S14 mRNA was further reduced in the TRβPV/PV mice (decreased to 0.3 and 0.2, respectively). No 5′-DI-I mRNA was detected in TRβPV/PV mice (Fig. 7B). These results indicate that the expression of PV gene dampened the magnitude of the T3-mediated responses of target genes in different tissues. These findings are in contrast to that found in mice lacking TRβ (TRβ−/−), in which no changes in the expression of ME genes were detected (22).
Discussion
Consistent with the findings in heterozygous patients with RTH, TRβPV/+mice exhibited mild impairment in the pituitary–thyroid axis. TRβPV/+ mice had a 2.1-fold elevated TSH despite 2- to 3-fold higher thyroid hormone levels as compared with TRβ+/+ mice. Corresponding increases in serum TSH, T4 and T3 in humans with RTH are on the average of 1.7-, 2.3-, and 2.5-fold, respectively (4). The thyroid glands showed enlarged follicles, and the development of bones was delayed. In TRβPV/PV mice, more extensive and pronounced abnormalities were observed. A severe resistance to the action of thyroid hormone in the pituitary was revealed by an extraordinarily high TSH level (412-fold increase) despite 9- to 15-fold increases in circulating T3 and T4 concentrations, respectively. The increases are also compatible with those reported in the single patient homozygous for a mutant TRβ (5). The thyroid gland exhibited extensive hyperplasia and an 18-fold increase in size. The growth in TRβPV/PV mice was severely impaired, with a ≈17–23% reduction in weight gain and a ≈10% decrease in the lengths of long bones. These abnormalities are reminiscent of the findings in the patient with homozygous mutated TRβ alleles (5). These results indicate that the mouse with a targeted PV mutation described in the present study is an accurate model for the study of RTH. In contrast to the previously reported transgenic mice (10–14), the present mouse model provides an opportunity for future in-depth analysis of the molecular basis of RTH, which has not been possible in humans.
Although the mild impairment in the thyroid–pituitary axis of TRβPV/+ mice is similar to that exhibited by the mice lacking TRβ, there are clear differences in the phenotypes between TRβPV/PV and TRβ−/− mice (21). The latter have neither severe dysfunction of the pituitary–thyroid axis nor impairment in weight gain and bone development. This study demonstrates that in mouse as in human, the effects of absence of TRβ are distinct from those of the presence of a mutant TRβ. The present study shows that PV interferes with gene regulatory functions of the wild-type receptors in vivo (Fig. 7 A and B). Despite higher levels of thyroid hormone in TRβPV/PV mice, the responses of T3-regulated genes are attenuated. Thus, PV attenuated the expression of genes positively regulated by thyroid hormone including the GH gene in the pituitary and the ME, S14, and 5′-DI-I in the liver. The expression of TSH mRNAs was activated, instead of being repressed by high T3 and T4, as demonstrated in hypothyroid mice treated with thyroid hormones (23). However, in contrast to that observed in hypothyroid mice (23, 24), the up-regulation of α-SU mRNA was more pronounced than TSHβ mRNA in TRβPV mice. At present, it is not clear whether this was because of T3-independent functions and/or the gene-specific actions of PV.
Several mechanisms, however, have been proposed to explain the interference of the mutant TRβ with the gene regulatory functions of the wild-type receptors: (i) competition for binding to TRE; (ii) exhaustion of limited transcription factors; or (iii) formation of inactive wild-type/mutant heterodimers on TRE. On the basis of the available in vitro biochemical evidence, the mechanism of competition of the wild-type TRs with mutants for binding to TRE is currently favored (mechanism i) (7, 25). However, the present in vivo data suggest that the possibility of formation of inactive wild-type/mutant heterodimers on TRE is also a viable mechanism (mechanism iii). In TRβPV/+ mice, with the presence of one copy of TRβ (from the remaining one wild-type allele) and TRα1 (from two TRα alleles), the expressed PV receptor probably preferentially forms inactive TRβ/PV heterodimers on the TREs of T3 target genes. Detailed biochemical analyses have shown that mutant PV forms inactive heterodimers with wild-type TRβ or TRα1 and that the former is preferred because of a higher affinity in the dimer formation (26). The mild phenotype exhibited in the pituitary–thyroid axis of the TRβPV/+ mice as a result of the antagonism of the TRβ-mediated functions by the preferential formation of inactive TRβ/PV heterodimers is reminiscent of the phenotype seen in the mice lacking TRβ (21). The severe phenotype observed for the TRβPV/PV mice most likely represents a combination of the loss of both TRβ- and TRα1-mediated functions. The former is because of the loss of the two wild-type TRβ alleles, and the latter is because of the interference of PV mutant on the functions of TRα1, presumably via the formation of inactive TRα1/mutant heterodimers in the absence of TRβ1 proteins. This hypothesis is supported by a similar degree of severe impairment in the pituitary–thyroid axis seen in mice deficient in both TRα and β (TRα−/−TRβ−/−; refs. 27, 28).
It is important, however, to point out that the mechanisms underscoring the similar hyperactivity of the pituitary–thyroid axis and growth impairment seen in the TRα−/−TRβ−/− mice (27, 28) and TRβPV/PV mice are totally different. The former is because of the lack of receptor alleles (27, 28), and the latter is because of the interference of the mutant receptor with the functions of wild-type receptors. Before all of the affected thyroid hormone target organs are evaluated and compared, it is premature to conclude that all other phenotypes exhibited by these two mouse models will be similar. It is entirely possible that the effects of mutant receptor in vivo could also manifest as “gain of function,” which could contribute to the phenotype seen in the TRβPV mice. Therefore, future analyses and comparison of the phenotypes of these two mouse models should shed light on the mechanisms of actions of the wild-type and mutant receptors.
Acknowledgments
We are grateful for the expert technical assistance provided by W. Vieira. We thank D. Gong for assistance in obtaining the mouse genomic P1 clone of the TRβ gene from Genome Systems, D. Forrest for providing the unpublished partial genomic restriction maps 12 kb down-stream of exon 10 of the TRβ gene, and E. Chester Ridgway and W. Wood for the mouse TR genomic plasmids (pWD5 and pWD67) and the expression plasmids of mouse TRα1 and TRβ1. We thank H. Westphal for providing the Ella-Cre mice (Laboratory of Mammalian Genes and Development, National Institute of Child Health and Human Development, National Institutes of Health), P. McPhie for the analysis of growth rate of TRβPV mice, and J. Robbins for critical reading of the manuscript. M.K. is supported in part by the Japan Society for the Promotion of Science Research Fellowship for Japanese Biomedical and Behavioral Researchers at the National Institutes of Health. S.R. is supported in part by grant DK15070 from the National Institutes of Health.
Abbreviation
- T3
3,3′,5-triiodo-l-thyronine
- T4
l-thyroxine
- TR
thyroid hormone receptor
- TRE
thyroid hormone response element
- TRβ1
TR subtype β1
- RTH
resistance to thyroid hormone
- PV
mutant thyroid hormone receptor kindred PV
- TSH
thyroid-stimulating hormone
- 5′-DI-I
5′-deiodinase-I
- RT
reverse transcription
- GH
growth hormone
- ME
malic enzyme
- α-SU
α-glycoprotein subunit
Footnotes
This paper was submitted directly (Track II) to the PNAS office.
Article published online before print: Proc. Natl. Acad. Sci. USA, 10.1073/pnas.230285997.
Article and publication date are at www.pnas.org/cgi/doi/10.1073/pnas.230285997
References
- 1.Oppenheimer J H, Schwartz H L, Strait K A. Eur J Endocrinol. 1994;130:15–24. doi: 10.1530/eje.0.1300015. [DOI] [PubMed] [Google Scholar]
- 2.Cheng S Y. J Biomed Sci. 1995;2:77–89. doi: 10.1007/BF02253060. [DOI] [PubMed] [Google Scholar]
- 3.Shibata H, Spencer T E, Onate S A, Jenster G, Tsai S Y, Tsai M J, O'Malley B W. Recent Prog Horm Res. 1997;52:141–164. [PubMed] [Google Scholar]
- 4.Refetoff S, Weiss R E, Usala S J. Endocr Rev. 1993;14:348–399. doi: 10.1210/edrv-14-3-348. [DOI] [PubMed] [Google Scholar]
- 5.Ono S, Schwartz I D, Mueller O T, Root A W, Usala S J, Bercu B B. Clin Endocrinol Metab. 1991;73:990–994. doi: 10.1210/jcem-73-5-990. [DOI] [PubMed] [Google Scholar]
- 6.Sakura A, Miyamoto T, Refetoff S, DeGroot L J. Mol Endocrinol. 1990;4:1988–1994. doi: 10.1210/mend-4-12-1988. [DOI] [PubMed] [Google Scholar]
- 7.Yen P M, Chin W W. Mol Endocrinol. 1994;8:1450–1454. doi: 10.1210/mend.8.11.7877614. [DOI] [PubMed] [Google Scholar]
- 8.Tagami T, Gu W X, Peairs P T, West B L, Jameson J L. Mol Endocrinol. 1998;12:1888–1902. doi: 10.1210/mend.12.12.0201. [DOI] [PubMed] [Google Scholar]
- 9.Collingwood T N, Wagner R, Matthews C H, Clifton-Bligh R J, Gurnell M, Rajanayagam O, Agostini M, Fletterick R J, Beck-Peccoz P, Reinhardt W, et al. EMBO J. 1998;17:4760–4770. doi: 10.1093/emboj/17.16.4760. [DOI] [PMC free article] [PubMed] [Google Scholar]
- 10.Wong R, Vasilyev V V, Ting Y T, Kutler D I, Willingham M C, Weintraub B D, Cheng S. Mol Med. 1997;3:303–314. [PMC free article] [PubMed] [Google Scholar]
- 11.Hayashi Y, Xie J, Weiss R E, Pohlenz J, Refetoff S. Biochem Biophys Res Commun. 1998;245:204–210. doi: 10.1006/bbrc.1998.8396. [DOI] [PubMed] [Google Scholar]
- 12.Abel E D, Kaulbach H C, Campos-Barros A, Ahima R S, Boers M E, Hashimoto K, Forrest D, Wondisford F E. J Clin Invest. 1999;103:271–279. doi: 10.1172/JCI5205. [DOI] [PMC free article] [PubMed] [Google Scholar]
- 13.Gloss B, Sayen M R, Trost S U, Bluhm W F, Meyer M, Swanson E A, Usala S J, Dillmann W H. Endocrinology. 1999;140:897–902. doi: 10.1210/endo.140.2.6527. [DOI] [PubMed] [Google Scholar]
- 14.Zhu X G, Kaneshige M, Parlow A F, Chen E, Hunziker R D, McDonald M P, Cheng S Y. Thyroid. 1999;9:1137–1145. doi: 10.1089/thy.1999.9.1137. [DOI] [PubMed] [Google Scholar]
- 15.Parrilla R A, Mixson A J, McPherson J A, McClaskey J H, Weintraub B D. J Clin Invest. 1991;88:2123–2130. doi: 10.1172/JCI115542. [DOI] [PMC free article] [PubMed] [Google Scholar]
- 16.Bhat M K, McPhie P, Ting Y T, Zhu X-G, Cheng S-y. Biochemistry. 1995;34:10591–10599. doi: 10.1021/bi00033a034. [DOI] [PubMed] [Google Scholar]
- 17.Barlow C, Hirotsune S, Paylor R, Liyanage M, Eckhaus M, Collins F, Shiloh Y, Crawley J N, Ried T, Tagle D, Wynshaw-Boris A. Cell. 1996;86:159–171. doi: 10.1016/s0092-8674(00)80086-0. [DOI] [PubMed] [Google Scholar]
- 18.Deng C X, Wynshaw-Boris A, Shen M M, Daugherty C, Ornitz D M, Leder P. Genes Dev. 1994;8:3045–3057. doi: 10.1101/gad.8.24.3045. [DOI] [PubMed] [Google Scholar]
- 19.Lakso M, Pichel J G, Gorman J R, Sauer B, Okamoto Y, Lee E, Alt F W, Westphal H. Proc Natl Acad Sci USA. 1996;93:5860–5865. doi: 10.1073/pnas.93.12.5860. [DOI] [PMC free article] [PubMed] [Google Scholar]
- 20.Pohlenz J, Weiss R E, Cua K, Van Sande J, Refetoff S. Thyroid. 1999;9:1265–1271. doi: 10.1089/thy.1999.9.1265. [DOI] [PubMed] [Google Scholar]
- 21.Forrest D, Hanebuth E, Smeyne R J, Everds N, Stewart C L, Wehner J M, Curran T. EMBO J. 1996;15:3006–3015. [PMC free article] [PubMed] [Google Scholar]
- 22.Weiss R E, Murata Y, Cua K, Hayashi Y, Seo H, Refetoff S. Endocrinology. 1998;139:4945–4952. doi: 10.1210/endo.139.12.6412. [DOI] [PubMed] [Google Scholar]
- 23.Chin W W, Shupnik M A, Ross D S, Habener J F, Ridgway E C. Endocrinology. 1985;116:873–878. doi: 10.1210/endo-116-3-873. [DOI] [PubMed] [Google Scholar]
- 24.Shibusawa N, Yamada M, Hirato J, Monden T, Satoh T, Mori S. Mol Endocrinol. 2000;14:137–146. doi: 10.1210/mend.14.1.0404. [DOI] [PubMed] [Google Scholar]
- 25.Meier C A, Dickstein B M, Ashizawa K, McClaskey J H, Muchmore P, Ransom S C, Menke J B, Hao E H, Usala S J, Bercu B B, et al. Mol Endocrinol. 1992;6:248–258. doi: 10.1210/mend.6.2.1569968. [DOI] [PubMed] [Google Scholar]
- 26.Zhu X G, McPhie P, Cheng S Y. Endocrinology. 1997;137:712–721. doi: 10.1210/endo.137.2.8593822. [DOI] [PubMed] [Google Scholar]
- 27.Gothe S, Wang Z, Ng L, Kindblom J M, Barros A C, Ohlsson C, Vennstrom B, Forrest D. Genes Dev. 1999;13:1329–1341. doi: 10.1101/gad.13.10.1329. [DOI] [PMC free article] [PubMed] [Google Scholar]
- 28.Gauthier K, Chassande O, Plateroti M, Roux J P, Legrand C, Pain B, Rousset B, Weiss R, Trouillas J, Samarut J. EMBO J. 1999;18:623–631. doi: 10.1093/emboj/18.3.623. [DOI] [PMC free article] [PubMed] [Google Scholar]


