Abstract
Malignant neoplasms exhibit an elevated rate of glycolysis over normal cells. This characteristic can be exploited for optical imaging of tumors in mice. A near infrared fluorophore, IRDye® 800CW, emission maximum 794 nm, was conjugated to 2-deoxyglucose (2-DG). An immunofluorescent cell-based assay was used to evaluate specificity and sensitivity of the conjugate in cultured cell monolayers. Dose dependent uptake was established with increasing concentrations of IRDye 800CW 2-DG for epithelial and prostate carcinomas. IRDye 800CW 2-DG was specifically blocked by an antibody against GLUT1 glucose transporter, and by excess unlabeled 2-DG or D-glucose. Signal was increased by a phorbol ester activator of glucose transport. Fluorescence microscopy data confirmed localization of the conjugate in the cytoplasm. Subsequent in vivo studies optimized dose, clearance, and timing for signal capture in nude mouse xenografts. In all cases, tumors were clearly imaged with good signal to noise characteristics. These data indicate that IRDye 800CW 2-DG is a broadly applicable optical imaging agent for in vivo imaging of neoplasms in mice.
Keywords: IRDye 800CW, 2-deoxyglucose, near infrared, molecular imaging, immunofluorescent assay, fluorescence microscopy, whole animal imaging
INTRODUCTION
Cancer cells characteristically exhibit an elevated rate of glycolysis, even under aerobic conditions. [1–3]. The increased demand for glucose to fuel energy production in tumors translates to elevated expression and activity of cell surface glucose transport proteins, which can be exploited for noninvasive imaging using glucose analogues. Early studies using [14C]deoxyglucose demonstrated cellular uptake by glucose transporters (GLUTs) and phosphorylation for glycolytic processing [4,5]. Because its structure precluded isomerization by the next enzyme in the pathway, subsequent metabolism was not possible, causing the partially processed, labeled analogue to accumulate in the cell. These findings have been applied extensively in clinical imaging by positron emission tomography (PET) in which 18FDG (2-fluoro-2-deoxyglucose) uptake is used to visualize tumor activity and location. The method is sensitive and quantitative [4,5]. For many high throughput preclinical studies, however, 18FDG is impractical due to the specialized instrumentation required and short half-life of the isotope. Therefore, alternatives to radionuclide labeled 2-deoxyglucose (2-DG) would be valuable.
Fluorescent optical imaging is a rapidly expanding methodology for non-invasive evaluation of disease and tumor progression, with application for drug and biomarker development [6–11]. Targeted near infrared (NIR) fluorophores have shown excellent signal to noise ratios in whole animals and images can be collected over longer periods than radioactively labeled probes. NIR fluorophores emit between 650–900 nm, a range in which absorption coefficients of tissues are relatively low, and non-specific fluorescence is minimized. By effectively reducing background, sensitivity and depth of penetration are increased which is directly reflected in improved image quality [8,12,13].
Several groups have reported the use of fluorescent analogues for imaging 2-DG uptake in mice [14–17]. O’Neil et al. [16] and Lloyd et al.[15] demonstrated 2-[N-(7-nitrobenz-2-oxa-1,3-diaxol-4-yl)amino]-2-deoxyglucose (2-NBDG) could be taken up in cultured tumor cells via the glucose transporters (GLUTs). Accumulation of 2-NBDG in human breast cancer cells (MCF-7) and pig vascular smooth muscle cells was effectively blocked by the addition of D-glucose. Using fluorescence microscopy, a Cy5.5-D-glucosamine conjugate was shown to accumulate in a number of cell lines, but uptake could not be blocked by glucose implying that the uptake mechanism was not dependent on specific glucose transporters. Furthermore, when used to image tumor xenografts, the tumor-to-background ratio of Cy5.5-D-glucosamine was not significantly different from Cy5.5 alone [14]. Pyropheophorbide 2-deoxyglucosamide (excitation/emission of 667nm/679) a potential agent for photodynamic therapy of human tumors, was implicated in GLUT targeting by D-glucose competition, and in this case, confocal microscopy was used to confirm internalization of the fluorophore [17].
In the current report, our goal was to develop an alternative fluorescent analogue of 2-DG and test its tumor detection efficacy in mice. We describe here the synthesis and performance of 2-DG labeled with the NIR dye, IRDye® 800CW. This dye has been shown to yield high signal-to-background ratios in prior animal imaging experiments [12] and has been successfully used in a number of in vivo tumor targeting studies [6,18–20]. We tested binding and uptake of the IRDye 800CW 2-DG targeting agent in vitro and in mice using several diverse solid tumor cell types. The mechanism of uptake was investigated by dose response, competition assays, and pharmacological activation of glucose transport. Specific accumulation of IRDye 800CW 2-DG observed in this broad group of cell lines both microscopically and in tumor-bearing intact mice underscores its utility for preclinical cancer research and provides insight into its efficacy.
MATERIALS AND METHODS
Cell Culture, Reagents, and Instrumentation
22Rv1 human prostate adenocarcinoma, A431 human epidermoid carcinoma, and SW620 colorectal carcinoma cells were purchased from American Type Culture Collection (ATCC; Manassas, VA) and maintained in RPMI-1640 containing 10% fetal bovine serum (FBS; Hyclone, Logan, UT), DMEM containing 10% FBS, or Leibovitz’s L-15 containing 10% FBS, respectively. PC3M-LN4 human prostate adenocarcinoma cells derived from PC3 were kindly provided by Dr. Isaiah J. Fidler (MD Anderson Cancer Center, Houston, TX) and maintained in minimal essential medium containing 10% FBS, sodium pyruvate, and nonessential amino acids. Human breast cancer cell lines, MDA-MB-231 and SKBr3, and human glioblastoma cell line, U87MG, were purchased from ATCC (Manassas, VA). Human melanoma cell line, M21-L, was kindly provided by Dr. David A. Cheresh (Moores Cancer Center, University of California, San Diego). The cells were cultured in DMEM supplemented with high glucose and F12 nutrient (DMEM/F12, Invitrogen, Carlsbad, CA) with 10% FBS. 3T3-L1 fibroblasts were purchased from ATCC (Manassas, VA) and differentiated to adipocytes as previously published using dexamethasone, isobutyl-methylxanthine, and insulin [21].
PMA (phorbol-12-myristate-13-acetate) and 2-amino-2-deoxy-D-glucose hydrochloride were purchased from Sigma-Aldrich (St Louis, MO). GLUT1 monoclonal antibody was purchased from Abcam (Cambridge, MA). TO-PRO® -3 was obtained from Molecular Probes, Inc. (Eugene, OR). CellTracker™ CM-Dil and Sytox® Green were purchased from Invitrogen (Carlsbad, CA). The Odyssey® Infrared Imaging System, Aerius® Automated Infrared Imaging System, and Pearl™ Imager were provided by LI-COR Biosciences (Lincoln, NE).
Synthesis of IRDye 800CW 2-DG
IRDye 800CW NHS ester (reactive dye; LI-COR Biosciences, Lincoln, NE) and 2-amino-2-deoxy-D-glucose hydrochloride (2-DG) were solubilized and reacted for 2 h at ambient temperature in 1M potassium phosphate buffer at pH 8.5. The dye conjugate was purified by HPLC, monitored at 260 and 780nm, using 10 × 250-mm Inertsil® (Varian, Walnut Creek, CA) semi-prep column, 5 micron, ODS-3. This column was equilibrated and eluted at 2.7 mL/min (108 bar pressure) using a gradient with 20% acetonitrile:80% 50mM triethylammonium acetate (pH 5.6) to 30% acetonitrile:70% triethylammonium acetate in 40 minutes. The two resolved anomers of IRDye 800CW 2-DG were pooled. Samples were protected from light, dried overnight under vacuum, reconstituted in water and applied to a cation exchange column (Amberlite™-IR120 Na+ Form, Sigma-Aldrich) equilibrated with water. The IRDye 800CW 2-DG was eluted from the column with water and the concentration measured by spectroscopy. The eluted material was sterilized by passage through a 0.2-mm syringe filter into a sterile container. The IRDye 800CW 2-DG was aliquoted, lyophilized, and the purity verified by NMR.
Cell-based assays
Binding and specificity of IRDye 800CW 2-DG were evaluated by immunofluorescent assay. Cells were grown to approximately 90% confluency in a 96-well microtiter plate and starved for 2 hours in serum-free low-glucose DMEM. Starvation media were replaced with media containing increasing concentrations of the IRDye 800CW 2-DG (0–50 µM), increasing concentrations of unlabeled 2-DG (0.8–375 mM) plus 5 µM IRDye 800CW 2-DG, or with increasing concentrations of GLUT1 monoclonal antibody (0.4–100 µg/mL) plus IRDye 800CW 2-DG (5µM) and incubated at 37°C for an additional hour. The assay was stopped by fixation with 4% formaldehyde solution for 20 min followed by four washes in 1x PBS+0.02% Triton X-100 to remove unbound dye and permeabilize the cells. The plates were blocked in Odyssey Blocking Buffer (LI-COR Biosciences, Lincoln, NE) for 1.5 hours and incubated for an additional hour with TO-PRO-3 DNA stain (ex/em: 642/669 nm) diluted 1:5000 for normalization of cell number. Washing steps were repeated with Odyssey Buffer + 0.02% Tween-20 and the plate was scanned with an Aerius Automated Infrared Imaging System. Quantification was normalized by ratiometric analysis of the fluorescent intensities obtained from the 700 nm and 800 nm channels.
PMA induction of glucose uptake was performed by a modification of the procedure described by Bosch et al. [22]. Briefly, 96-well overnight cultures of fully differentiated 3T3-L1 adipocytes, were incubated for 4 h at 37°C with DMEM containing increasing concentrations of PMA (0–5 µM). IRDye 800CW 2-DG was added to a final concentration of 5 µM per well and incubation was continued for 15 min at 37°C after which the reaction was terminated. Cells were fixed, permeabilized, blocked, stained with TO-PRO-3, and analyzed as described above.
Determination of 2-DG Uptake by Fluorescence Microscopy
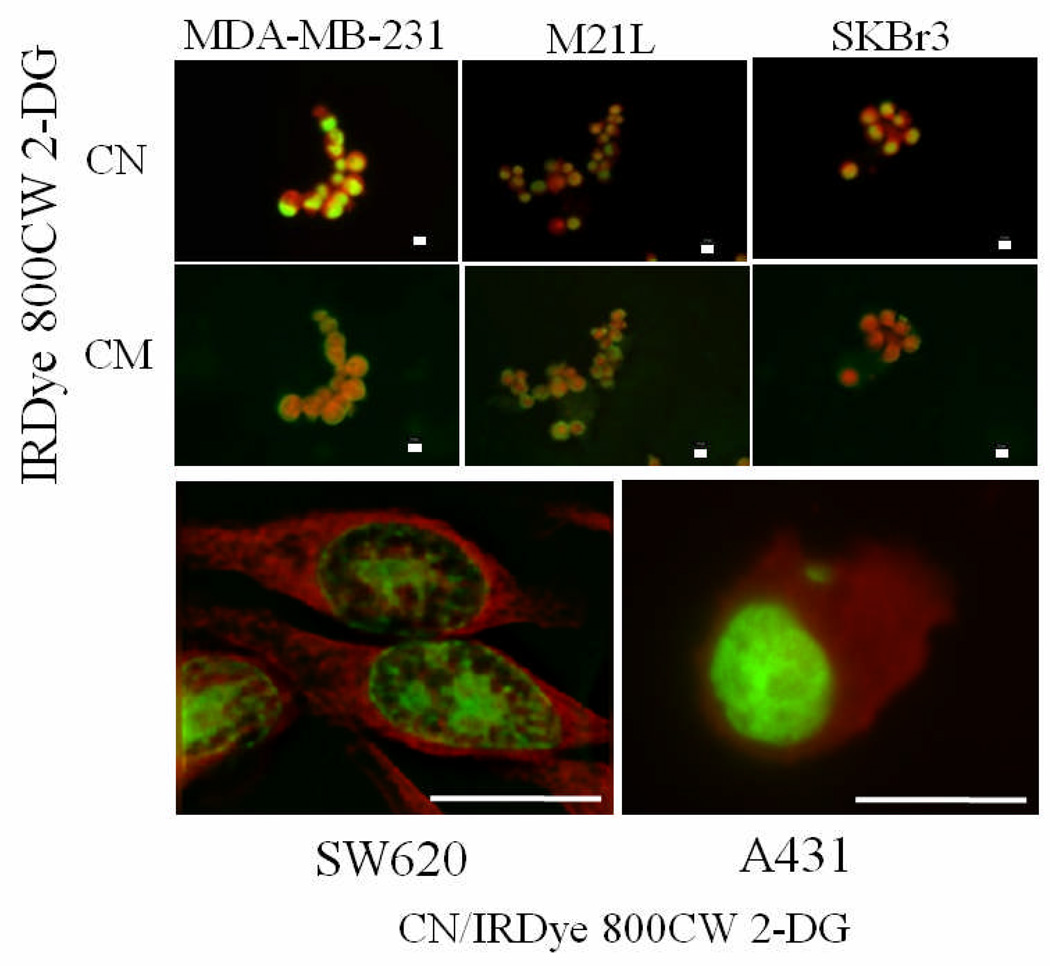
Serum starved cultures of U87MG (not shown), SKBr3, MDA-MB-231, M21-L, SW620, and A431 tumor cell lines were incubated at 37°C for 2 h with 50µM IRDye 800CW 2-DG. Cells were washed twice with PBS and pelleted by centrifugation. Cell membranes were specifically stained with 2 ng of CellTracker CM-Dil according to the manufacturer’s instructions. Cell nuclei were stained with 1µM Sytox Green in 95% ethanol.
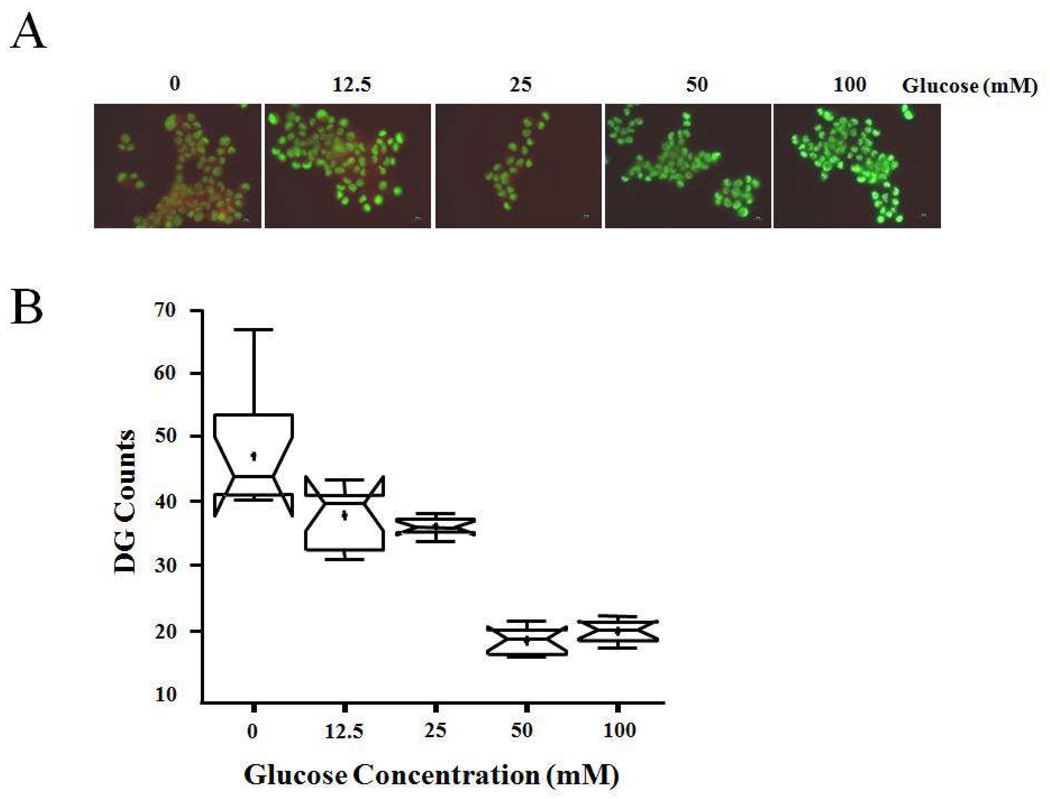
To determine the competitive effect of glucose, MDA-MB-231 cells were incubated at 37°C with DMEM plus 0, 12.5, 25, 50 and 100 mM D-glucose for 3.5 h. IRDye 800CW 2-DG was added to a final concentration of 50 µM and cells were incubated at 37 °C for another 30 min. Cell membrane and nuclei were stained as described above. Ten MDA-MB-231 cells incubated at each glucose concentration were randomly chosen for analysis. Cells were imaged by fluorescence microscopy using either a Leica DM6000b Bio/Med microscope (Leica Microsystems Inc., Bannockburn, IL) or a Zeiss Axio Observer (Carl Zeiss MicroImaging Inc., Thornwood, NY) equipped with a Xenon lamp and NIR filters (ex/HQ760/40, em/HQ830/50; Chroma Technology Corp., Rockingham, VT). Signals imaged separately for IRDye 800CW 2-DG (ex/em 785/810 nm), cell membrane (ex/em 553/570 nm), and cell nuclei (ex/em 488/510 nm) were merged as presented in Figure 2 and Figure 3.
Figure 2.
Microscopic analysis of intracellular fluorophore accumulation. Fluorescent images were collected on tumor cell lines (MDA-MB-231, M21L, SKBr3, SW620, and A431 as indicated) following incubation with IRDye 800CW 2-DG (50 µM) in conjunction with a stain specific for cell nuclei (CN) or cell membrane (CM). Scale bar = 10 µm. IRDye 800CW 2-DG is presented in red with CN and CM colored in green.
Figure 3.
Competitive binding captured with fluorescent microscopy. A) Fluorescent images of MDA-MB-231 following incubation with increasing concentrations of D-glucose (0–100 mM) and IRDye 800CW 2-DG (50 µM). Scale bar = 10 µm for the fluorescent images. B) Fluorescence intensity at each wavelength was quantified for ten randomly selected individual cells at each D-glucose concentration indicated, and IRDye 800CW 2-DG signal was normalized to the nuclear signal for each one. The notched box-and-whisker plot was used to illustrate the distributions and the statistical differences of the data. The plot provides the minimum, 25th percentile, median (central line), mean (+), 75th percentile, and maximum.
A notched box-and-whisker plot [23,24] was used to analyze the distribution and statistical differences of the microscopy data. The plot provides the minimum, 25th percentile, median (central line), mean (+), 75th percentile and maximum. The medians (central lines) of two box-and whisker plots are significantly different at the 0.05 confidence level if the corresponding notches do not overlap. Statistical analysis was performed using SAS software version 9.1 (SAS® Institute Inc., Cary, NC) for Microsoft Windows.
In vivo Animal Imaging and Analysis
All animals used in the imaging experiments were cared for and maintained under the supervision and guidelines of the University of Nebraska-Lincoln Institutional Animal Care and Use Committee. Mice were maintained on a purified maintenance diet (AIN-93M) obtained from Harlan Teklad (Madison, WI). All mice were anesthetized with 2% isoflurane throughout all procedures. Male athymic nude (nu/nu) mice, obtained from Charles River Laboratories, Inc. (Cambridge, MA) at 4 wks of age, were subcutaneously injected with a suspension of 106 cells in 100 µL serum free medium specific to the cell type under analysis. For all imaging experiments, the fluorescent contrast agent was injected intravenously through the tail vein. At the experimental endpoints, mice were sacrificed and images of the excised organs were obtained.
Images analyzed in a longitudinal series for each particular mouse were normalized using a look-up-table (LUT) with common minimum and maximum values. Signal-to-noise ratio (SNR) was calculated using the following formula: SNR = ((Mean tumor intensity)-(Mean background intensity))/Standard deviation of mean background [25]. Regions of interest (ROI) for both tumor and background were derived from equivalent sized areas containing the same number of pixels. ROIs were quantified for total pixel and mean pixel values.
Organ and Tissue Analyses
After final imaging, animals were sacrificed and organs suspected of targeting agent accumulation (i.e.; kidney, liver, stomach, etc) were removed for imaging to confirm signal content. Organs were snap frozen in OCT compound for cryosectioning. Sections (8 µm thickness) were scanned in both the 700 nm channel for tissue autofluorescence, and the 800 nm channel for the targeted IRDye 800CW 2-DG fluorescence signal using the Odyssey Imaging System. The area-weighted fluorescence signal from the 800 nm channel was used to compare targeting agent specificity.
RESULTS
Characterization of IRDye 800CW 2-DG in Cell Binding Assays
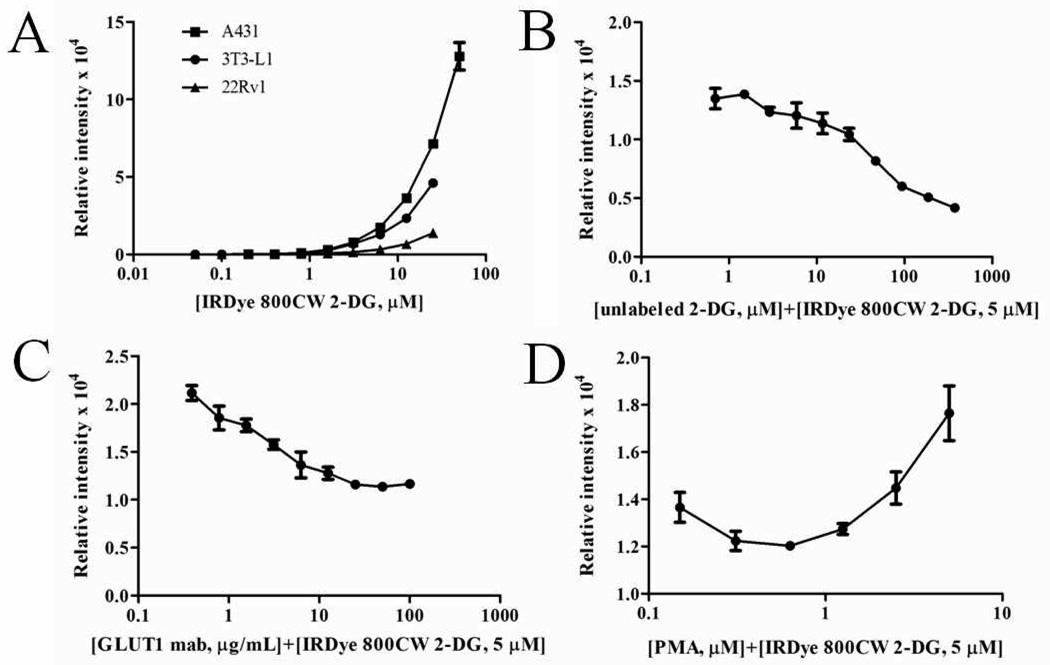
Binding specificity of IRDye 800CW 2-DG was evaluated on cultured A431, mouse 3T3-L1, and 22Rv1 cells in a microplate assay. A431 and 22Rv1 are human tumor cell lines with high and relatively lower metabolic rates, respectively. Differentiated 3T3-L1 adipocytes were also evaluated, since they express basal levels of glucose transport proteins that can be chemically increased. Confluent cell monolayers were incubated with increasing concentrations of the dye conjugate and relative NIR fluorescence intensities were plotted. A dose-dependent increase in fluorescence occurred for each of the three tumor cell types screened (Figure 1A). In a similar assay, serial dilutions (0–3 µM) of the unconjugated IRDye 800CW dye showed little or no increase in signal (data not shown). To examine specificity of 2-DG targeting, A431 cells were preincubated with increasing concentrations of unlabeled 2-DG (Figure 1B) or D-glucose (data not shown) prior to treatment with IRDye 800CW 2-DG. The inhibition curves showed exposure of the cells to ~40X excess unlabeled 2-DG prior to treatment with IRDye 800CW 2-DG almost completely eliminated fluorescence. Dependence of dye uptake on GLUT family transporters was tested by addition of the indicated quantities of anti-GLUT1 monoclonal antibody prior to incubation with IRDye 800CW 2-DG (Figure 1C). Over 50% of fluorescence was blocked by ~25 µg/mL of the GLUT1 antibody. Finally, cellular recognition of 2-DG by GLUT family glucose transporters can be pharmacologically increased by addition of the phorbol ester PMA to induce surface translocation from intracellular vesicles [22]. Differentiated 3T3-L1 adipocytes were stimulated with increasing concentrations of PMA (0.08–5 µM) for 4 h prior to the addition of IRDye 800CW 2-DG. NIR fluorescence was increased by 50% with increasing PMA concentration (Figure 1D). Collectively, these results support specific recognition of IRDye 800CW 2-DG by tumor cells and adipocytes.
Figure 1.
In-Cell western analysis demonstrate binding and competition on tumor cells in vitro. Following a brief starvation period, A431, 22Rv1, and 3T3-L1 cells were treated with increasing concentrations of IRDye 800CW 2-DG (0.1–50 µM) (A); unlabeled 2-DG (0.8–375 mM) plus IRDye 800CW 2-DG (5µM) (B); or GLUT1 monoclonal antibody (0.4–100 µg/mL) plus IRDye 800CW 2-DG (5µM) (C). Differentiated 3T3-L1 adipocytes were treated with increasing concentrations of PMA (0.08–5 µM) for approximately 4 h. Following incubation, 5 µM IRDye 800CW 2-DG was added with an additional 15 min incubation at room temperature (D).
In vitro Microscopic Analysis
Microscopic examination of several additional tumor cell lines was undertaken to more precisely identify the cellular location of IRDye 800CW 2-DG. Cells were allowed to incubate first with the 2-DG conjugate, followed by nuclear and cell membrane staining. Representative images are shown for a melanoma (M21L) and two breast carcinoma cell lines (SkBr3 and MDA-MB-231). Fluorescence microscopy revealed significant IRDye 800CW 2-DG signal in all tumor cell lines evaluated (Figure 2). Similar results were obtained for prostate tumor lines used in this study and for U87 glioma cells (data not shown). Inspection of merged images at low magnification illustrated homogeneous cytoplasmic location of IRDye 800CW 2-DG with no nuclear or cell surface colocalization (Figure 2, top two rows). Deconvolved epifluorescent images obtained at a higher magnification stained similarly showed no colocalization of the cytosolic 2-DG labeled fluorophore with the nuclear signal and confirmed the intracellular location of the dye (Figure 2, bottom panels). To establish the specificity of IRDye 800CW 2-DG uptake, we performed competitions by incubating MDA-MB-231 cells with increasing concentrations of D-glucose prior to addition of the dye and collection of microscopic images (Figure 3A). Normalized fluorescence intensity of individual randomly selected cells was then quantified by confocal microscopy for each glucose concentration. Statistical analysis of these signals using the notched box-and-whisker plot [23,24] showed a significant decrease in IRDye 800CW 2-DG uptake occurred between 25 and 50 mM D-glucose addition (P <0.05; Figure 3B).
In vivo Characterization of IRDye 800CW 2-DG
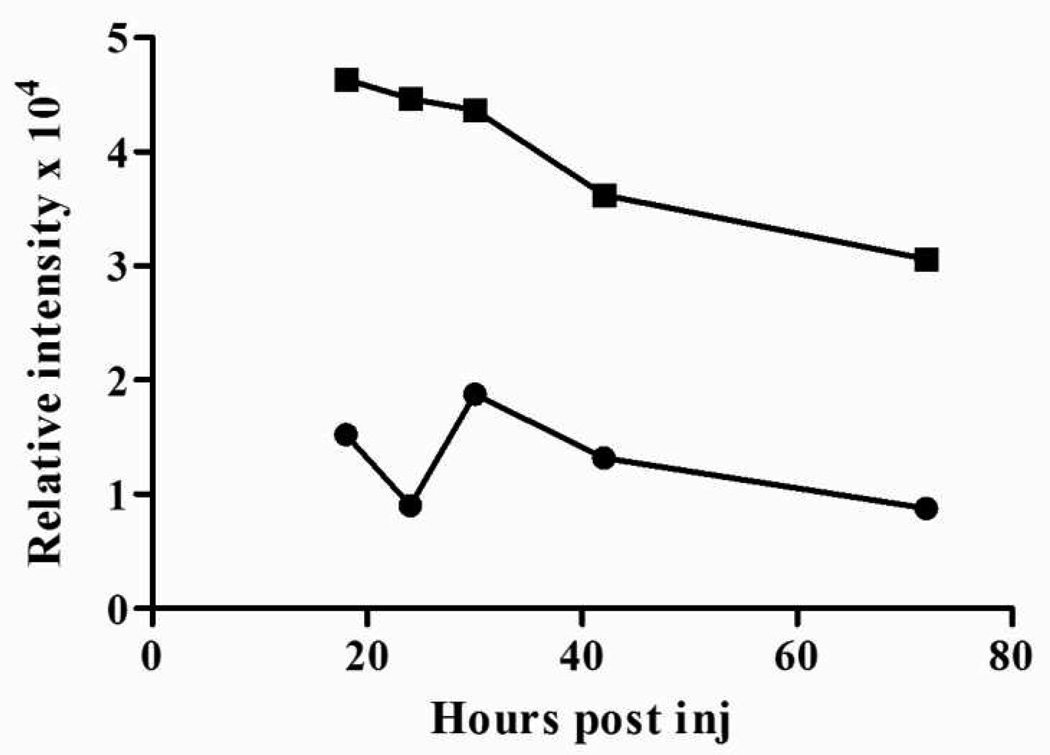
Since many tissues have relatively high densities of glucose transporters, it was important to test the specificity of IRDye 800CW 2-DG in mice by comparing its clearance profile to that of IRDye 800CW carboxylate (non-reactive form). Mice bearing subcutaneous 22Rv1 xenografts were given an intravenous injection of 20 nmol IRDye 800CW 2-DG or IRDye 800CW carboxylate. Images were collected with the Pearl Imager at intervals between 18–72 h post injection. Signal intensities corrected for background revealed ~4-fold increase in tumor retention of IRDye 800CW 2-DG compared to the carboxylate (Figure 4). Serial images analyzed over the total 5 day period of the study showed signal intensities peaked at ~24 h. This time point was selected for all subsequent animal imaging studies.
Figure 4.
Pharmacokinetics of IRDye 800CW 2-DG clearance in mice. Male athymic nude mice bearing ~0.5cm subcutaneous 22Rv1 tumors were injected via the tail vein with IRDye 800CW 2-DG (20 nmol; ■) or IRDye 800CW carboxylate (20 nmol; ●). Animals were imaged at 18, 24, 30, 42, and 72 hours post agent injection. Signal intensity per mm2 is the total signal intensity per area (mm2) of those pixels scored at greater than 3 standard deviations over background.
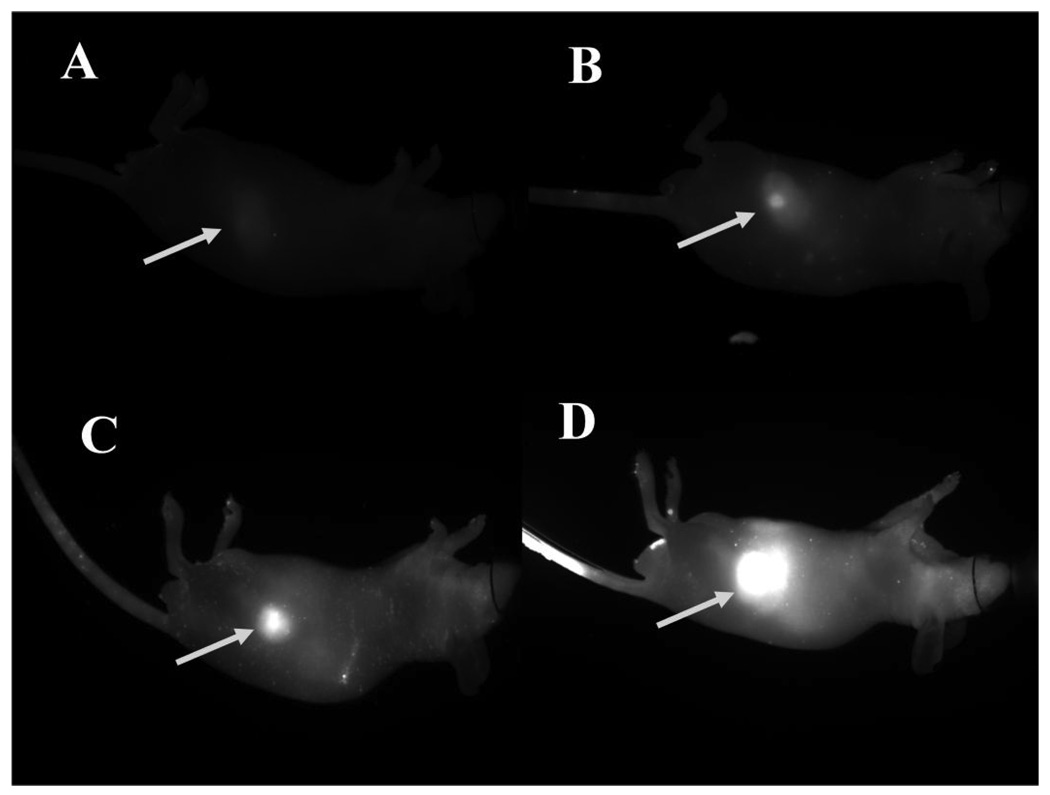
Next, we optimized the concentration of IRDye 800CW 2-DG for imaging subcutaneous 22Rv1 tumors. Tumor-bearing mice were injected intravenously with increasing concentrations of IRDye 800CW 2-DG and imaged 24 h post injection (Figure 5). Tumor SNR increased with increasing concentration of the labeled agent. Although tumors were visible regardless of dose, a range of 10–20 nmol was identified as the effective working dose for sensitive detection.
Figure 5.
Determination of optimal fluorophore dose for noninvasive tumor imaging. Prostate tumor xenografts (22Rv1) were implanted in four athymic nude mice. Each animal received one of the following doses intravenously via the tail vein: A) 2.5 nmol, B) 5.0 nmol, C) 10 nmol, or D) 20 nmol. Images were taken 24 h post injection and normalized to the same LUT (0–10000).
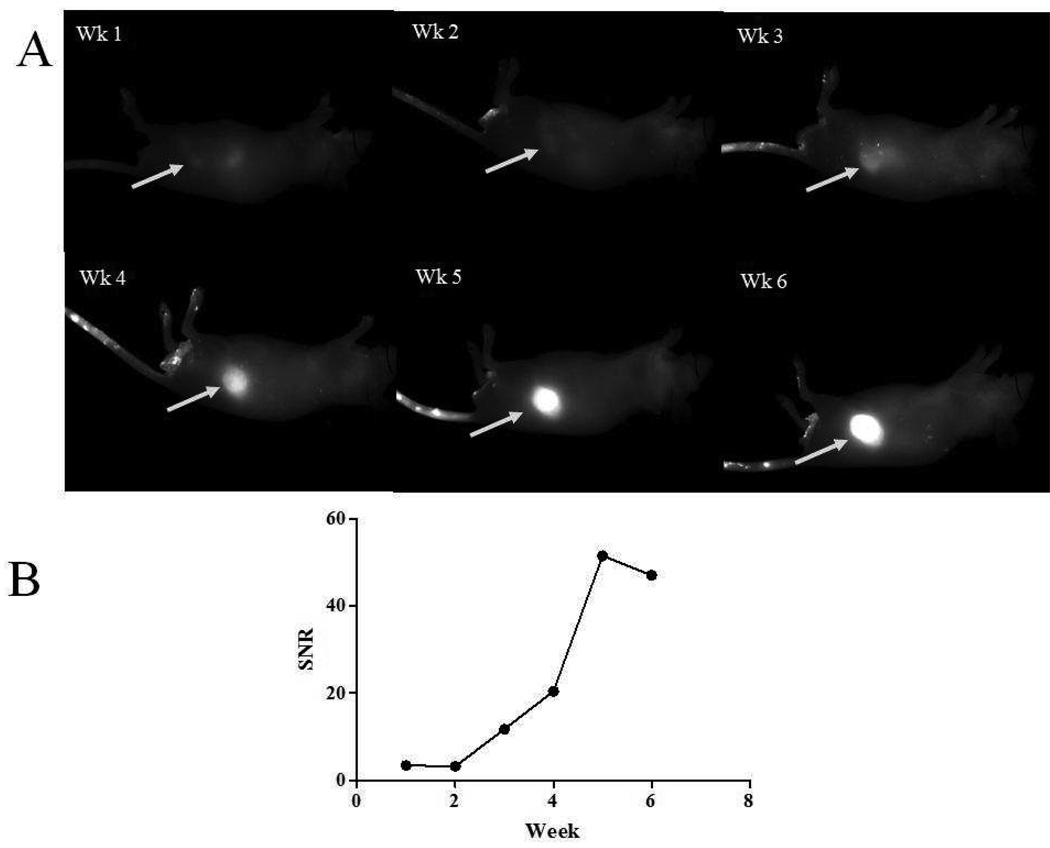
Early tumor detection was examined by a longitudinal analysis of mice bearing PC3M-LN4 prostate xenografts. Images were collected weekly, 24 h after intravenous injection of IRDye 800CW 2-DG (Figure 6A). SNR was again used as a parameter to evaluate time-dependent changes in tumor size (Figure 6B). A SNR of 3, the limit at which we were able to identify tumors with 95% accuracy, was achieved by week 1. This value increased to 11.7 by week 3 and was saturated by week 5. This is consistent with our previous findings for orthotopic prostate tumors [25], in which the SNR reached a plateau, but the relative area covered by signal intensities of this magnitude was still increasing with tumor size.
Figure 6.
Longitudinal imaging of tumor growth with IRDye 800CW 2-DG. Male athymic nude mice injected subcutaneously with PC3M-LN4 cells were given weekly tail vein injections of IRDye 800CW 2-DG (15 nmol) and monitored by imaging weekly 24 h after delivery of the optical agent (A). SNR were calculated for the weekly images normalized to the same LUT (B).
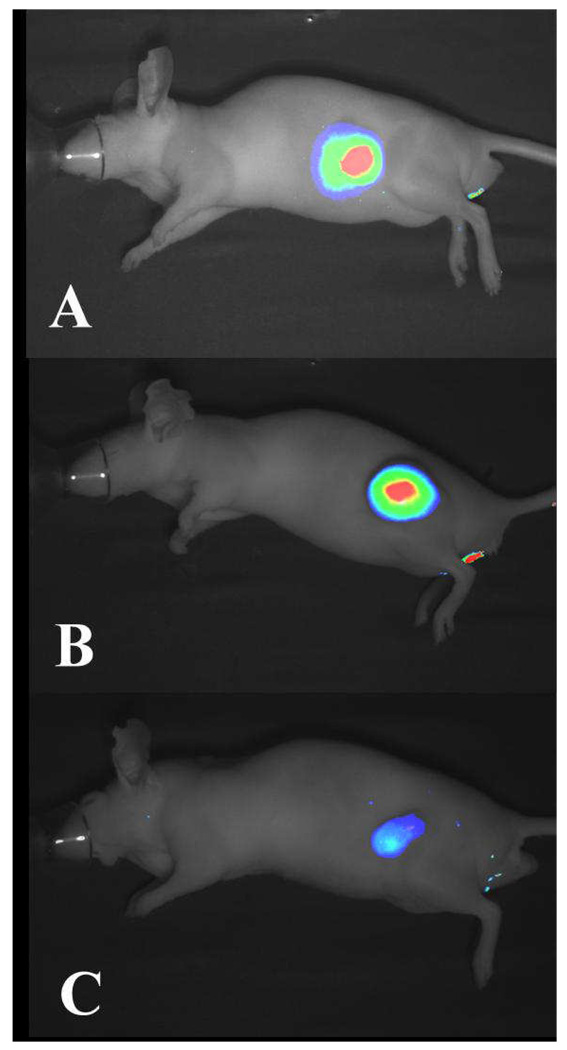
Finally, multiple tumor models were challenged using the optimized probe conditions discussed above. Mice bearing ~0.5 cm subcutaneous tumors arising from 22Rv1, A431, and SW620 cells (Figure 7 A–C, respectively) were injected intravenously with 15 nmol IRDye 800CW 2-DG. Images were collected 24 h post injection and analyzed for fluorescence. The intensity of the fluorescence, which presumably reflects uptake of the agent by the tumors, varied depending on cellular origin.
Figure 7.
Detection of multiple diverse tumor types by non-invasive imaging of IRDye 800CW 2-DG. Athymic nude mice bearing A) subcutaneous prostate (22Rv1), B) epidermoid (A431), and C) colorectal (SW620) carcinomas received 15 nmol IRDye 800CW 2-DG intravenously via the tail vein. Images were acquired 24 h post injection. Fluorescent 800 nm signals were presented in pseudo color and overlaid on the white light image for each animal model. High signal intensities register as red while low signal is illustrated as blue.
Evaluation of Fluorescence Signal in Organs, Tissues, and Tumors
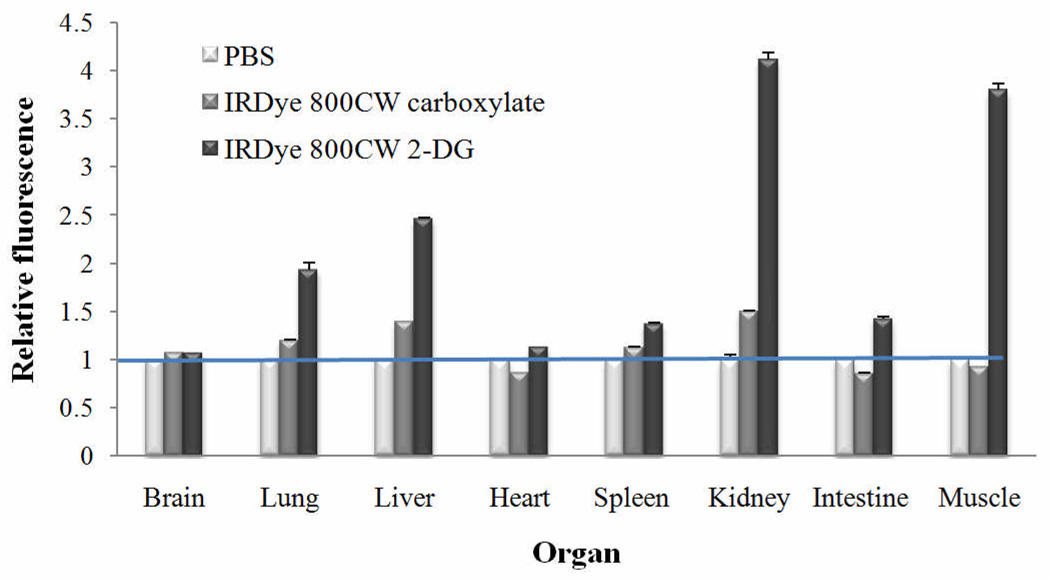
Organ and tissue sections from animals receiving PBS, IRDye 800CW carboxylate, or IRDye 800CW 2-DG were screened for residual signal. All specimens were cryopreserved, sectioned, and scanned in two channels on the Odyssey Imaging System for specific area-weighted fluorescence to autofluorescence. Specific signals for each organ or tissue were normalized to the PBS signal of that tissue, arbitrarily set to 1. Low levels of NIR signal were detected in all organs evaluated for PBS and IRDye 800CW carboxylate treatments (Figure 8). However, IRDye 800CW 2-DG showed significant retention in the kidney, muscle, and liver giving rise to signal intensities ~3–4-fold higher than the carboxylate. Retention of either IRDye 800CW carboxylate or IRDye 800CW 2-DG was minimal for brain, heart, lung, intestine, and spleen/pancreas. Importantly, if specimens were harvested after 3 days, rather than 24 h, from animals receiving IRDye 800CW 2-DG or IRDye 800CW carboxylate, all organs were minimally fluorescent, while tumors exhibited ~83% signal increase for the 2-DG coupled dye over IRDye 800CW carboxylate (data not shown).
Figure 8.
Tissue section analyses. Tumor bearing athymic nude mice were injected with PBS, IRDye 800CW carboxylate, or IRDye 800CW 2-DG as indicated. Animals were sacrificed after imaging and tissues and organs were cryopreserved in OCT compound. Three to four frozen 8-µm sections per organ were scanned on the Odyssey Imaging System and signals were averaged. Relative fluorescence was determined by normalizing respective tissues to PBS.
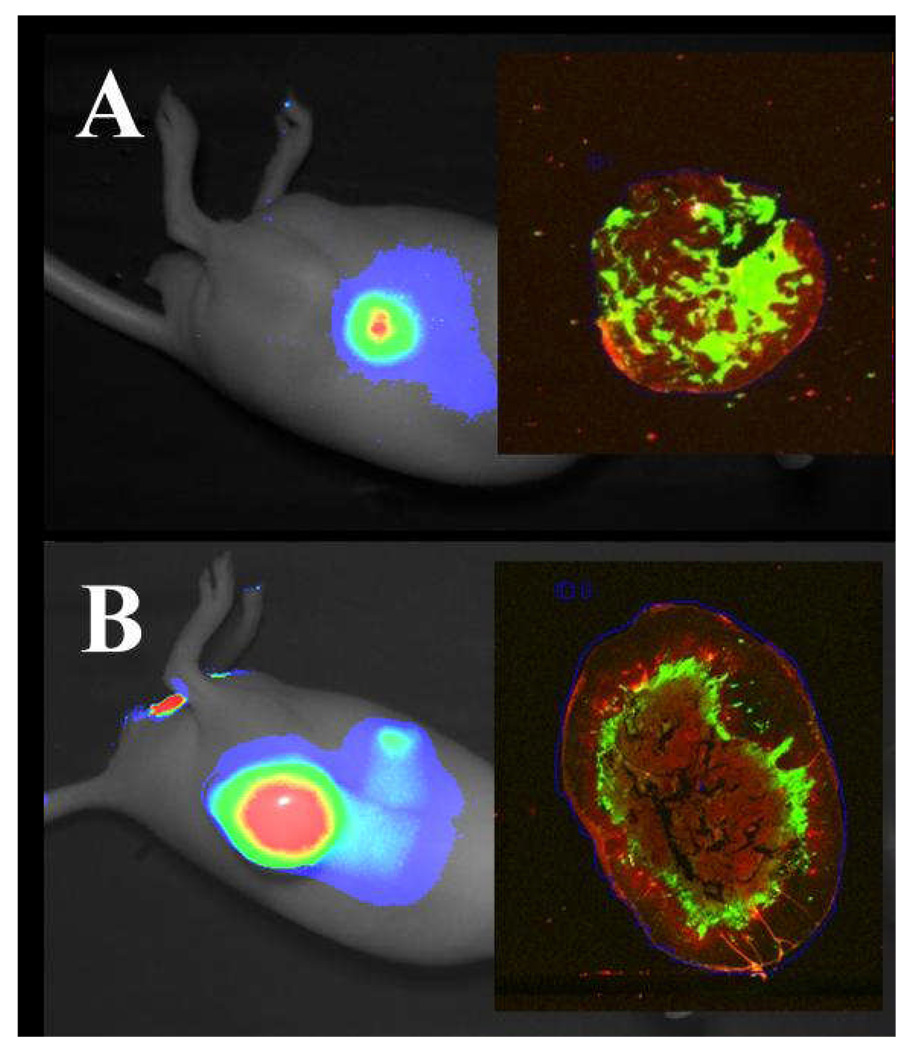
Inspection of the scanned tumor sections revealed heterogeneity in the localization of dye within both 22Rv1 and A431 tumors (Figure 9A and 9B, inset panels, respectively). Areas of intense fluorescence corresponded to histologically viable regions of the tumor, and were notably absent from the periphery. Thus, the most significant sources of non-specific fluorescence correspond predictably to tissues that exhibit relatively high glucose uptake rates, which is consistent with the expected targeting pattern of 2-DG, and significant specific tumor fluorescence is associated with living tissue that is relatively remote from the well-vascularized tumor surface. Collectively, these data support the use of IRDye 800CW 2-DG to probe metabolic glucose uptake potential of tumors in mice.
Figure 9.
Distribution of IRDye 800CW 2-DG within tumor sections. Athymic nude mice bearing 22Rv1 (A) or A431 (B) tumors were injected via the tail vein with 10 nmol or 14 nmol of IRDye 800CW 2-DG, respectively, and imaged 24 h post-injection. Excised tumors were fixed, paraffin-embedded, sectioned and scanned on the Odyssey Imaging System. Specific fluorescence in the 800 nm channel is in green and autofluorescence in the 700 nm channel is in red (inset panels).
DISCUSSION
Cancer cells are known to exhibit enhanced glucose utilization to sustain their increased energy demands in oxygen-deficient growth conditions. We exploited the increased glucose metabolism in tumor cells for noninvasive imaging in intact mice by developing the NIR fluorescent glucose analogue, IRDye 800CW 2-DG. Multiple tumor cell lines were examined in vitro and in vivo for accumulation of IRDye 800CW 2-DG. Tumor cells and 3T3-L1 adipocytes bound the probe effectively in vitro in a dose dependent fashion. In addition, fluorescence microscopy confirmed that IRDye 800CW 2-DG was present in the cytoplasm of all tumor cell lines examined. Binding could be blocked by unlabeled 2-DG and stimulated by the phorbol ester, PMA; IRDye 800CW 2-DG uptake was also effectively blocked by excess D-glucose or antibodies against the glucose transport protein GLUT1. In vivo, the IRDye 800CW 2-DG probe was >4-fold more effective in detection and monitoring multiple tumor types than the unlabeled fluorophore, and was found to localize in viable but relatively poorly vascularized regions of the tumors. Collectively, these results demonstrate specificity of IRDye 800CW 2-DG and suggest involvement of the GLUT family of transporters in its uptake.
It has been shown that specific GLUT family proteins are involved in accelerated glucose uptake in tumors. GLUT1, in particular, has been shown to be an important player in several stages of cancer progression (reviewed in [27–30]). Evidence for its specific involvement in accumulation of FDG has been provided by PET imaging in animal models of prostate and mammary carcinoma, in which the rate of uptake was directly correlated to levels of GLUT1 protein expression in the tumors [28,29]. Previous reports have also examined total expression or cell surface presentation of GLUT1 in human tumor cell lines. In one study, GLUT1 mRNA levels were found to be higher in A431 tumor cells than in other cells lines tested [31]. GLUT1 transporters have also been found to decrease cell surface expression by as much as 75% when 3T3-L1 fibroblasts were differentiated [32] relative to undifferentiated cells. Our in vitro results are consistent with these studies since A431 cells exhibited higher binding to IRDye 800CW 2-DG compared to unstimulated 3T3-L1 adipocytes, suggesting GLUT1 mediates binding of the optical agent. This was further supported by successful use of PMA, a potent activator of the PKC (protein kinase C) family known to increase the rate of glucose uptake [22,33,34] primarily by increasing GLUT1 at the plasma membrane [22], to stimulate uptake of IRDye 800CW 2-DG. It should be noted that GLUT4 (insulin-sensitive isoform) has also been reported to increase upon PMA stimulation [32,35,36], so it is possible that both are involved in the uptake of IRDye 800CW 2-DG.
Previous studies using fluorophore-labeled 2-DG as a targeting agent for noninvasive optical tumor imaging in mice have reported various outcomes in vivo following positive binding assays in vitro. For example, tumor and normal tissue uptake between Cy5.5-2DG and Cy5.5-NHS in mice was not significantly different [14]. In contrast, we observed the tumor-to-background ratio of IRDye 800CW 2-DG was four-fold greater than that of IRDye 800CW carboxylate, indicating the tumor signal was primarily the result of specific cellular uptake of the agent.
Although Cy5.5 has been used successfully in animal imaging studies, inherent characteristics of this dye, such as non-specific binding by the dye and autofluorescence at the emission wavelength, have been shown to decrease signal to background, compromising the results [13,37]. This was demonstrated by a side-by-side comparison between Cy5.5 EGF and IRDye 800CW EGF in which the latter targeting agent yielded a significantly higher tumor-to-background ratio [37]. This result was attributed to a combination of Cy5.5 non-specific dye binding and autofluorescence at the emission wavelength.
Analysis of organ sections showed an increased retention of IRDye 800CW 2-DG over IRDye 800CW carboxylate in the kidney, muscle, and liver. The kidney signal is indicative of probe clearance, while muscle and liver would be expected to show increased signal levels compared to lung, spleen, and heart due to an increased density of GLUT receptors in these tissues. Intestine, though a site of extensive glucose absorption, utilizes a secondary active transport mechanism for glucose uptake that is dependent on a GLUT isoform not as readily recycled between the cell surface and intracellular compartments as GLUT1 and GLUT4. This observation supports a mechanism for fluorophore uptake, as discussed below, that does not involve conventional transport. It is reasonable for the tumors to exhibit further increases in signal in vivo, since hypoxia has been shown to elevate GLUT1 expression in human tumor tissue sections and in human tumor cell lines cultured in low oxygen conditions [33]. In particular, studies have shown GLUT1 expression correlated with viable but extremely hypoxic tissue surrounding necrotic regions in tumors, and PET imaging of these regions confirmed that both hypoxia and GLUT1 expression correlated with increased FDG uptake. This is consistent with our analysis of tumor sections in which areas of high signal intensity surround the necrotic center and occur only beneath the vascular, presumably better oxygenated, tumor surface. Thus, analysis of IRDye 800CW 2-DG fluorescence has the potential to predict GLUT expression and hypoxia within tissue.
The molecular mechanism by which IRDye 800CW 2-DG enters the cell via the GLUT transporters is unknown. Fluorophore-labeled 2-DG has a molecular mass of ≈ 1330 Da and is estimated to occupy a dimension of 18–23 Å, whereas 2-DG (MW = 164 Da) has a reported diameter of ~5.8Å. Salas-Burgos et al. [38] predicted a three-dimensional model for GLUT1 with a 15 Å × 8 Å channel connecting the extracellular and intracellular binding domains. The GLUT transporters are highly homologous to lactose permeases, which have been shown to move monosaccharide sugars across membranes as a result of conformational changes initiated by the specific binding energies [39]. The transporter samples two alternative states in response to sugar binding, with the substrate docking site either facing intracellularly or extracellularly [38,40]. Since the size of IRDye 800CW 2-DG is about three times larger than the endogenous ligand, it is unlikely that GLUT1 passes the fluorophore tagged 2-DG through its intramembrane channel, despite considerable predicted flexibility within the binding and transport domain. The conjugated ring system that gives rise to the fluorescence properties of the dye is not entirely dissimilar to the structures of GLUT inhibitors such as phloretin, which bind at the glucose binding site but are not able to be transported through the channel. Nonetheless, the data implicate GLUT proteins in the movement of IRDye 800CW 2-DG into the cell. We suggest this is probably due to endocytosis of the GLUT1/IRDye 800CW 2-DG complexes.
In summary, we have characterized a general tumor targeting agent for noninvasive NIR optical imaging in mice. Because IRDye 800CW 2-DG uptake is mediated by GLUT family proteins, this compound can be considered a metabolic optical agent with broad applicability in preclinical testing for drug development, and in evaluation of mouse cancer models. This is the first report to integrate data that not only demonstrate binding and uptake specificity of a highly sensitive NIR fluorescent glucose analogue in vitro, but also implicate the glucose transporter GLUT1 in the mechanisms of enhanced detection in vitro and in vivo.
REFERENCES
- 1.Rajendran JG, Mankoff DA, O'Sullivan F, Peterson LM, Schwartz DL, Conrad EU, Spence AM, Muzi M, Farwell DG, Krohn KA. Hypoxia and glucose metabolism in malignant tumors: evaluation by [18F]fluoromisonidazole and [18F]fluorodeoxyglucose positron emission tomography imaging. Clin Cancer Res. 2004;10:2245–2252. doi: 10.1158/1078-0432.ccr-0688-3. [DOI] [PubMed] [Google Scholar]
- 2.Warburg O. On the origin of cancer cells. Science. 1956;123:309–314. doi: 10.1126/science.123.3191.309. [DOI] [PubMed] [Google Scholar]
- 3.Gambhir SS, Czernin J, Schwimmer J, Silverman DH, Coleman RE, Phelps ME. A tabulated summary of the FDG PET literature. J Nucl Med. 2001;42:1S–93S. [PubMed] [Google Scholar]
- 4.Schmidt KC, Lucignani G, Sokoloff L. Fluorine-18-fluorodeoxyglucose PET to determine regional cerebral glucose utilization: a re-examination. J Nucl Med. 1996;37:394–399. [PubMed] [Google Scholar]
- 5.Sokoloff L, Reivich M, Kennedy C, Des Rosiers MH, Patlak CS, Pettigrew KD, Sakurada O, Shinohara M. The [14C]deoxyglucose method for the measurement of local cerebral glucose utilization: theory, procedure, and normal values in the conscious and anesthetized albino rat. J Neurochem. 1977;28:897–916. doi: 10.1111/j.1471-4159.1977.tb10649.x. [DOI] [PubMed] [Google Scholar]
- 6.Kovar JL, Simpson MA, Schutz-Geschwender A, Olive DM. A systematic approach to the development of fluorescent contrast agents for optical imaging of mouse cancer models. Anal Biochem. 2007;367:1–12. doi: 10.1016/j.ab.2007.04.011. [DOI] [PubMed] [Google Scholar]
- 7.Frangioni JV. In vivo near-infrared fluorescence imaging. Curr Opin Chem Biol. 2003;7:626–634. doi: 10.1016/j.cbpa.2003.08.007. [DOI] [PubMed] [Google Scholar]
- 8.Gurfinkel M, Ke S, Wen X, Li C, Sevick-Muraca EM. Near-infrared fluorescence optical imaging and tomography. Dis Markers. 2003;19:107–121. doi: 10.1155/2004/474818. [DOI] [PMC free article] [PubMed] [Google Scholar]
- 9.Li H, Chen J, Zhang M, Zhang Z, Benaron D, Chance B, Glickson JD, Zheng G. NIR Optical Probes Targeting Glucose Transporters. In: Savitsky AP, editor. Proceedings of SPIE. Bellingham, WA: SPIE; 2004. pp. 254–261. [Google Scholar]
- 10.Licha K, Riefke B, Ebert B, Grotzinger C. Cyanine dyes as contrast agents in biomedical optical imaging. Acad Radiol. 2002;9 Suppl 2:S320–S322. doi: 10.1016/s1076-6332(03)80216-7. [DOI] [PubMed] [Google Scholar]
- 11.Tromberg BJ, Shah N, Lanning R, Cerussi A, Espinoza J, Pham T, Svaasand L, Butler J. Non-invasive in vivo characterization of breast tumors using photon migration spectroscopy. Neoplasia. 2000;2:26–40. doi: 10.1038/sj.neo.7900082. [DOI] [PMC free article] [PubMed] [Google Scholar]
- 12.Chance B. Optical method. Annu Rev Biophys Biophys Chem. 1991;20:1–28. doi: 10.1146/annurev.bb.20.060191.000245. [DOI] [PubMed] [Google Scholar]
- 13.Jobsis FF. Noninvasive, infrared monitoring of cerebral and myocardial oxygen sufficiency and circulatory parameters. Science. 1977;198:1264–1267. doi: 10.1126/science.929199. [DOI] [PubMed] [Google Scholar]
- 14.Cheng Z, Levi J, Xiong Z, Gheysens O, Keren S, Chen X, Gambhir SS. Near-infrared fluorescent deoxyglucose analogue for tumor optical imaging in cell culture and living mice. Bioconjug Chem. 2006;17:662–669. doi: 10.1021/bc050345c. [DOI] [PMC free article] [PubMed] [Google Scholar]
- 15.Lloyd PG, Hardin CD, Sturek M. Examining glucose transport in single vascular smooth muscle cells with a fluorescent glucose analog. Physiol Res. 1999;48:401–410. [PubMed] [Google Scholar]
- 16.O'Neil RG, Wu L, Mullani N. Uptake of a fluorescent deoxyglucose analog (2-NBDG) in tumor cells. Mol Imaging Biol. 2005;7:388–392. doi: 10.1007/s11307-005-0011-6. [DOI] [PubMed] [Google Scholar]
- 17.Zhang M, Zhang Z, Blessington D, Li H, Busch TM, Madrak V, Miles J, Chance B, Glickson JD, Zheng G. Pyropheophorbide 2-deoxyglucosamide: a new photosensitizer targeting glucose transporters. Bioconjug Chem. 2003;14:709–714. doi: 10.1021/bc034038n. [DOI] [PubMed] [Google Scholar]
- 18.Hawrysz DJ, Sevick-Muraca EM. Developments toward diagnostic breast cancer imaging using near-infrared optical measurements and fluorescent contrast agents. Neoplasia. 2000;2:388–417. doi: 10.1038/sj.neo.7900118. [DOI] [PMC free article] [PubMed] [Google Scholar]
- 19.Knapp D, Adams L, DeGrand A, Niles J, Ramos-Vara J, Weil A, O'Donnell M, Lucroy M, Frangioni J. Sentinel lymph node mapping of invasive urinary bladder cancer in animal models using invisible light. European Urology. 2007;178:2197–2202. doi: 10.1016/j.eururo.2007.07.007. [DOI] [PMC free article] [PubMed] [Google Scholar]
- 20.Sampath L, Kwon S, Ke S, Wang W, Schiff R, Mawad ME, Sevick-Muraca EM. Dual-labeled trastuzumab-based imaging agent for the detection of human epidermal growth factor receptor 2 overexpression in breast cancer. J Nucl Med. 2007;48:1501–1510. doi: 10.2967/jnumed.107.042234. [DOI] [PubMed] [Google Scholar]
- 21.Moyers JS, Bilan PJ, Reynet C, Kahn CR. Overexpression of Rad inhibits glucose uptake in cultured muscle and fat cells. J Biol Chem. 1996;271:23111–23116. doi: 10.1074/jbc.271.38.23111. [DOI] [PubMed] [Google Scholar]
- 22.Bosch RR, Bazuine M, Wake MM, Span PN, Olthaar AJ, Schurmann A, Maassen JA, Hermus AR, Willems PH, Sweep CG. Inhibition of protein kinase CbetaII increases glucose uptake in 3T3-L1 adipocytes through elevated expression of glucose transporter 1 at the plasma membrane. Mol Endocrinol. 2003;17:1230–1239. doi: 10.1210/me.2003-0057. [DOI] [PubMed] [Google Scholar]
- 23.McGill R, Tukey JW, Larsen WA. Variations of Box Plots. The American Statistician. 1978;32:12–16. [Google Scholar]
- 24.Salmond S. Taking the mystery out of research: Box and whisker plots: Displaying mean, interquartile range, and range. Orthop Nurs. 2007;26:33. doi: 10.1097/00006416-200701000-00010. [DOI] [PubMed] [Google Scholar]
- 25.Kovar JL, Johnson MA, Volcheck WM, Chen J, Simpson MA. Hyaluronidase expression induces prostate tumor metastasis in an orthotopic mouse model. Am J Pathol. 2006;169:1415–1426. doi: 10.2353/ajpath.2006.060324. [DOI] [PMC free article] [PubMed] [Google Scholar]
- 26.Abouzied MM, Crawford ES, Nabi HA. 18F-FDG imaging: pitfalls and artifacts. J Nucl Med Technol. 2005;33:145–155. quiz 162-3. [PubMed] [Google Scholar]
- 27.Macheda ML, Rogers S, Best JD. Molecular and cellular regulation of glucose transporter (GLUT) proteins in cancer. J Cell Physiol. 2005;202:654–662. doi: 10.1002/jcp.20166. [DOI] [PubMed] [Google Scholar]
- 28.Brown RS, Leung JY, Fisher SJ, Frey KA, Ethier SP, Wahl RL. Intratumoral distribution of tritiated-FDG in breast carcinoma: correlation between Glut-1 expression and FDG uptake. J Nucl Med. 1996;37:1042–1047. [PubMed] [Google Scholar]
- 29.Clavo AC, Brown RS, Wahl RL. Fluorodeoxyglucose uptake in human cancer cell lines is increased by hypoxia. J Nucl Med. 1995;36:1625–1632. [PubMed] [Google Scholar]
- 30.Haberkorn U, Morr I, Oberdorfer F, Bellemann ME, Blatter J, Altmann A, Kahn B, van Kaick G. Fluorodeoxyglucose uptake in vitro: aspects of method and effects of treatment with gemcitabine. J Nucl Med. 1994;35:1842–1850. [PubMed] [Google Scholar]
- 31.Aloj L, Caraco C, Jagoda E, Eckelman WC, Neumann RD. Glut-1 and hexokinase expression: relationship with 2-fluoro-2-deoxy-D-glucose uptake in A431 and T47D cells in culture. Cancer Res. 1999;59:4709–4714. [PubMed] [Google Scholar]
- 32.Yang J, Clark AE, Kozka IJ, Cushman SW, Holman GD. Development of an intracellular pool of glucose transporters in 3T3-L1 cells. J Biol Chem. 1992;267:10393–10399. [PubMed] [Google Scholar]
- 33.Gibbs EM, Calderhead DM, Holman GD, Gould GW. Phorbol ester only partially mimics the effects of insulin on glucose transport and glucose-transporter distribution in 3T3-L1 adipocytes. Biochem J. 1991;275(Pt 1):145–150. doi: 10.1042/bj2750145. [DOI] [PMC free article] [PubMed] [Google Scholar]
- 34.Nave BT, Siddle K, Shepherd PR. Phorbol esters stimulate phosphatidylinositol 3,4,5-trisphosphate production in 3T3-L1 adipocytes: implications for stimulation of glucose transport. Biochem J. 1996;318(Pt 1):203–205. doi: 10.1042/bj3180203. [DOI] [PMC free article] [PubMed] [Google Scholar]
- 35.Holman GD, Kozka IJ, Clark AE, Flower CJ, Saltis J, Habberfield AD, Simpson IA, Cushman SW. Cell surface labeling of glucose transporter isoform GLUT4 by bis-mannose photolabel. Correlation with stimulation of glucose transport in rat adipose cells by insulin and phorbol ester. J Biol Chem. 1990;265:18172–18179. [PubMed] [Google Scholar]
- 36.Yang J, Clark AE, Harrison R, Kozka IJ, Holman GD. Trafficking of glucose transporters in 3T3-L1 cells. Inhibition of trafficking by phenylarsine oxide implicates a slow dissociation of transporters from trafficking proteins. Biochem J. 1992;281(Pt 3):809–817. doi: 10.1042/bj2810809. [DOI] [PMC free article] [PubMed] [Google Scholar]
- 37.Adams KE, Ke S, Kwon S, Liang F, Fan Z, Lu Y, Hirschi K, Mawad ME, Barry MA, Sevick-Muraca EM. Comparison of visible and near-infrared wavelength-excitable fluorescent dyes for molecular imaging of cancer. J Biomed Opt. 2007;12:024017. doi: 10.1117/1.2717137. [DOI] [PubMed] [Google Scholar]
- 38.Salas-Burgos A, Iserovich P, Zuniga F, Vera JC, Fischbarg J. Predicting the three-dimensional structure of the human facilitative glucose transporter glut1 by a novel evolutionary homology strategy: insights on the molecular mechanism of substrate migration, and binding sites for glucose and inhibitory molecules. Biophys J. 2004;87:2990–2999. doi: 10.1529/biophysj.104.047886. [DOI] [PMC free article] [PubMed] [Google Scholar]
- 39.Smirnova I, Kasho V, Choe JY, Altenbach C, Hubbell WL, Kaback HR. Sugar binding induces an outward facing conformation of LacY. Proc Natl Acad Sci U S A. 2007;104:16504–16509. doi: 10.1073/pnas.0708258104. [DOI] [PMC free article] [PubMed] [Google Scholar]


