Abstract
Using differential scanning calorimetry (DSC), X-ray diffraction (XRD) and Fourier transform infrared spectroscopy (FTIR), we determined some thermodynamic and structural parameters for a series of amino acid-linked dialkyl lipids containing a glutamic acid-succinate headgroup and di-alkyl chains: C12, C14, C16 and C18 in CHES buffer, pH 10. Upon heating, DSC shows that the C12, C14 and annealed C16 lipids undergo a single transition which XRD shows is from a lamellar, chain ordered subgel phase to a fluid phase. This single transition splits into two transitions for C18, and FTIR shows that the upper main transition is predominantly the melting of the hydrocarbon chains whereas the lower transition involves changes in the headgroup ordering as well as changes in the lateral packing of the chains. For short incubation times at low temperature, the C16 lipid appears to behave like the C18 lipid, but appropriate annealing at low temperatures indicates that its true equilibrium behavior is like the shorter chain lipids. XRD shows that the C12 lipid readily converts into a highly ordered subgel phase upon cooling and suggests a model with untilted, interdigitated chains and an area of 77.2 Å2/4 chains, with a distorted orthorhombic unit subcell, a = 9.0 Å, b = 4.3 Å and β = 92.7°. As the chain length n increases, subgel formation is slowed, but untilted, interdigitated chains prevail.
Keywords: DSC, XRD, FTIR, Peptidic amphiphiles, Lipid bilayers
1. Introduction
Synthetic amino acid/lipid conjugates (sometimes referred to as peptidic amphiphiles when there are two or more amino acids) of various types have been investigated in recent years to help better understand membrane biophysics (Kunitake, 1992; Ringsdorf et al., 1988), as a platform for biomaterials development (Neumann and Ringsdorf, 1986; Winger et al., 1996; Yu et al., 1996; Dori et al., 2000; Hartgerink et al., 2001), and also as a means to anchor functional units to surfaces for intermolecular force measurements (Israelachvili, 1992; Berndt et al., 1995b; Pincet et al., 1994). An important feature of many of these lipids is the competition between hydrophobic and hydrophilic interactions. Tsonchev et al. (2003) have pointed out that orientation-dependent interactions between headgroups must be considered when predicting the morphology of self-assembled structures of peptidic amphiphiles.
Attractive interactions between peptidic headgroups might be expected to stabilize self-assembled structures. Shimizu and Hato (1993) observed significant increases in the hydrocarbon chain-melting transition temperature (TM) for four-and five-mer peptidic amphiphiles containing glycine as a headgroup compared to other amino acids. They ascribed the stabilizing effect to a lower degree of hydration between the glycine moieties, facilitating inter-glycine hydrogen bonding. Those peptidic amphiphiles that contained glycine exhibited poor dispersability in water, even when sonicated at 70−80 °C for several minutes, further implicating the stabilizing effect of interbilayer hydrogen bonds. Strong headgroup–headgroup interactions with attendant strong adhesion between glycine amphiphiles were manifested in opposed bilayers after contact using the surface-force apparatus (Schneider et al., 2002). This effect was removed at higher pH levels, where the glycine amphiphiles acquired a negative charge, presumably increasing the hydration state and attenuating interbilayer hydrogen bonds. Such pH-induced control of the inter-headgroup interactions may serve as a general mechanism for developing controlled-release liposomes, or other inducible microstructures using peptidic amphiphiles.
In this study we use differential scanning calorimetry (DSC), X-ray diffraction (XRD), and Fourier transform infrared spectroscopy (FTIR) to investigate the physical properties of a series of novel dialkyl amino acid lipids that contain a glutamic acid residue that is a component used in the synthesis. Fig. 1 shows the chemical structure which can be described in two ways. The solid lines divide the molecule into the hydrocarbon chains, and a glutamic acid and a succinate residue. The bold solid line emphasizes the comparison to a more conventional lipid description, with hydrocarbon tails, a bridging or connecting group, and a succinamide headgroup. Following Berndt et al. (1995), these lipids have been named the (Cn)2-Glu-C2-COOH lipids. The molecule shown in Fig. 1 is in the neutral form, which occurs for pH ≤ 4. At pH 7 and higher, the carboxyl group is deprotonated. The series that we study consists of disaturated C12, C14, C16 and C18 hydrocarbon chains. DSC, XRD and FTIR, in contrast to SFA, measure the properties of bulk lipids, which self-assemble to their energy-minimized structure in aqueous solution. The self-aggregated structure of these lipids depends strongly on the hydrophobic force, as well as on the electrostatic, hydration and hydrogen bonding forces due to the headgroup. The structure is also modified by the van der Waals interactions between the hydrocarbon chains, and the relative strength of this interaction increases as the chain length increases.
Fig. 1.
Sketch of the n = 14 member of the (Cn)2-Glu-C2-COOH family.
2. Materials and methods
2.1. Synthesis of di-O-alkyl glutamic acid, N-succinamide ((Cn)2-Glu-C2-COOH)
All reagents and solvents were of at least analytical grade quality and were obtained through Fisher Scientific (Pittsburgh, PA). In the first step, di-O-alkyl glutamic acid p-toluenesulfonate (dialkyl-glu-pTs) was synthesized by the acid-catalyzed Fischer esterification used by Berndt et al. (1995a). Briefly, 7.36 grams of l-glutamic acid, an appropriate long chain alcohol (i.e. dodecanol, tetradecanol, hexadecanol or octadecanol) and p-toluenesulfonic acid monohydrate were dissolved in ∼500 mL of toluene in a molar ratio 1:2:1.5 and heated under reflux until a stoichiometric amount of water was recovered in a Dean–Stark trap (∼6 h). The product was then concentrated by rotary evaporation and recrystallized three times from acetone. The purity and identity of the crystalline material was determined by a combination of NMR, IR, and electrospray mass spectroscopy. In the second step, 7.27 g of dialkyl-glu-pTs and 1.25 equiv. of diisopropylethylamine (DIPEA) were dissolved in 200 mL of THF/chloroform (1:1) and 1.15 equivalents of succinic anhydride were added with stirring. The reaction mixture was stirred for 2 h at 40 °C after which time the reaction was essentially complete. The product was then concentrated by rotary evaporation and recrystallized three times from ethanol. The identity and purity of the recrystallized material were also determined by NMR, IR, and electrospray mass spectroscopy.
2.2. Chemicals
For the preparation of the buffer solution, 250 mM CHES (Fisher Scientific, Pittsburgh, PA) was used. The pH was adjusted to 10.0 using concentrated NaOH. Phosphate buffer was 100 mM sodium phosphate buffer, pH 7.4.
2.3. DSC
High-sensitivity DSC measurements were performed using a Calorimetry Sciences Multi-Cell instrument (Calorimetry Sciences Corporation, American Fork, UT) at UAlberta and a Microcal MC-2 calorimeter (Microcal LLC, Northampton, MA) at CMU. For most of the experiments, 4−6 mg lipid was weighed and 500 μl CHES buffer was added to the hastelloy ampoules of the multi-cell calorimeter. After sealing the ampoule, the lipid was hydrated by heating above the main phase transition temperature (TM) and then cooling to −7 °C, both at a rate of 90 °C/h. For the greater chain length samples, an additional heating scan was performed to just below the phase transition temperature to further anneal the sample before cooling to −7 °C. Heating and cooling thermograms were acquired at a scan rate of ∼10 °C/h. For the MC-2 scans, 4.5 mg was added to 3 ml CHES buffer or water in nalgene vials. These samples were cycled above the TM and then to −20 °C three times with vortexing at each temperature. These samples were stored at 0−5 °C for up to two weeks prior to the scans. 1.20 ml was added to the sample cell of the MC-2 and CHES buffer was placed into the reference cell. The MC-2 was run at ∼60 °C/h.
2.4. X-ray diffraction
2.4.1. Capillary samples
Twenty-five milligrams lipid was added to 125 mg CHES buffer at pH 10 in 100 μl nalgene vials. The samples were heated once or twice briefly to 60 °C, vortexed and cooled to 20 °C. About 10 mg of lipid dispersion was loaded into 1.0 mm glass X-ray capillaries (Charles Supper Co.) as in Tristram-Nagle et al. (1993). Various temperature protocols as described in Section 3 were carried out on individual capillaries in an effort to form highly crystalline, low temperature phases. Samples were studied using a Rigaku RUH3R rotating copper anode X-ray source operated at 6 kW. In order to avoid degrading the sample at one position, capillaries were translated vertically after each 40 min exposure. A graphite monochromator selected Cu Kα radiation (λ = 1.5418 Å). The beam size was 1 mm × 1 mm, collimated using two X–Y slits before the sample. Data were collected in duplicate scans of 20 or 40 min/sample using a Rigaku Mercury CCD (Woodlands, TX) with 1024 × 1024 pixels and a pixel size of 70 μm. The S-distance (sample-to-CCD) for this experiment was 9.34 cm.
2.5. Thin layer chromatography
The lipids were checked for purity and degradation both before and after DSC and X-ray diffraction. Thin layer chromatography (TLC) using chloroform:methanol:7N NH4OH (46:18:3, v/v) on samples before experiments revealed <1% lysolipid when stained with vapor from iodine crystals. Negligible degradation was observed under the gentle conditions of hydration that were used with the multi-cell calorimeter and with preparation of the samples for X-ray diffraction. After X-ray diffraction, the lipids were degraded 5−10%. Care was taken not to heat to 90 °C, since at pH 10 this caused considerable degradation (∼50% loss of the succinic acid headgroup), while DPPC (the control) was only 5% degraded under similar conditions.
2.6. FTIR spectroscopy
Samples were prepared for FTIR spectroscopy by dispersing 1−2 mg of lipid in 75−100 μl of a D2O-based CHES buffer of a composition similar to that used for the DSC studies. The dispersion was vigorously agitated at temperatures ∼5−10 °C above the TM of the lipid and then squeezed between the CaF2 windows of a heatable, demountable liquid cell (NSG Precision Cells, Farmingdale, NY) equipped with a 25 μm Teflon spacer. Once mounted in the sample holder of the spectrometer, the sample was heated and cooled between 0 and 60 °C by an external, computer-controlled water bath. Infrared spectra were acquired as a function of temperature with a Digilab FTS-40 Fourier transform spectrometer (Biorad, Digilab Division, Cambridge, MA) using data acquisition and data processing protocols following Lewis et al. (2001).
3. Results
3.1. Differential scanning calorimetry
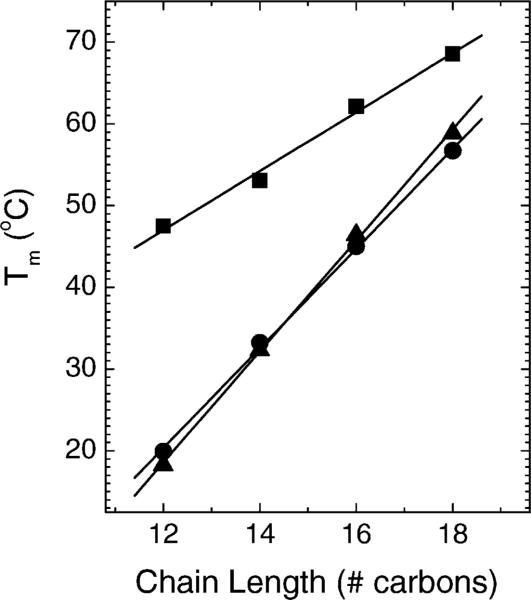
When aqueous dispersions of the (Cn)2-Glu-C2-COOH lipids were prepared as for the MC-2 samples, the pH was measured to be 4, due to dissociation of the proton from the lipid headgroup (see Fig. 1). Preliminary DSC measurements indicated rather high transition temperatures (see Fig. 2) and non-reproducible enthalpies, due to the insolubility and aggregation of the lipids. At pH 7.4 (phosphate buffer) and pH 10 (CHES buffer), the lipids exhibited similar patterns of thermotropic phase behavior, aside from small changes in the transition temperatures (see Fig. 2). However, due to considerable clumping of the lipids at pH <8, most of the DSC, X-ray and FTIR experiments were performed at pH 10 where handling was easier.
Fig. 2.
Calorimetric transition temperature as a function of pH and chain length. Circles are from the data in Fig. 3 at pH 10; triangles from pH 7.4; squares from pH 4.
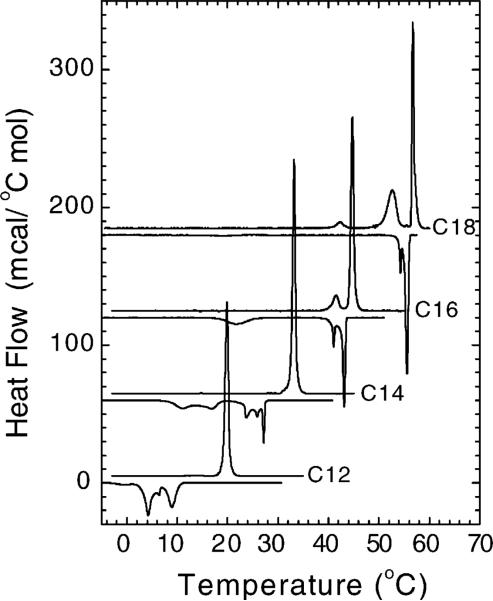
The initial heating and cooling scans are shown in Fig. 3. The initial heating scans in Fig. 3 exhibit the main transition which is identified as the highest transition temperature for each lipid. Only the C16 and C18 chain lengths had an additional lower temperature transition, and the C18 lipid had a second, smaller transition at 42 °C. During cooling, a downward (exothermic), sharp transition was observed only for the higher chain lengths, C16 and C18. In addition to this sharp transition, an additional broader transition at ∼22 °C was also observed for C16. For the lower chain lengths, C12 and C14, multiple smaller and broader transitions were observed. Although the downward exotherms are shifted in temperature only slightly from the main endotherms for C16 and C18, there is a marked hysteresis upon cooling for the lower chain lengths. Fig. 2 shows that the main melting transition temperatures (TM) increase systematically as a function of chain length n for each pH.
Fig. 3.
DSC heating scans (upward peaks) after brief incubation at −7 °C and cooling scans (downward peaks) of (Cn)2-Glu-C2-COOH lipids in CHES buffer at pH 10 as a function of chain length. The data shown were acquired with the Multicell DSC at 9−10 °C/h and are displaced on the ordinate for clarity.
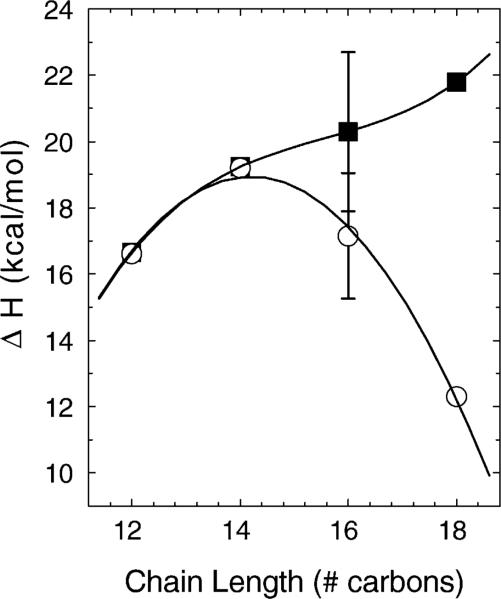
The hydrocarbon chain length dependence of the phase transition enthalpies for these lipids at pH 10 is shown in Fig. 4. Justification for showing the combined enthalpies of the lower and main transitions will be given in the FTIR results section. With careful annealing of C16 at lower temperatures, the lower transition disappears and the main transition increases in enthalpy. The uncertainties for C16 in Fig. 4 indicate that these variations in enthalpy arise from different thermal histories. For C18, there is a larger contribution from the lower transition that did not change significantly with low temperature annealing. A numerical summary of the calorimetry data after annealing is given in Table 1. FWHM stands for full-width at half-maximal height and is the measure of the breadth of the transition.
Fig. 4.
Main transition enthalpies (open circles) and also the sum of the enthalpies of both the lower and main transitions (solid squares) for the pH 10 data of Fig. 3 (initial scans). Lines are to guide the eye.
Table 1.
Summary of calorimetric results for annealed lipids at pH 10
| Lipid | TM (°C) | FWHM (°C) (main) | ΔH (kcal/mol) (main) | ΔH (kcal/mol) (2 lower) |
|---|---|---|---|---|
| (C12)2-Glu-C2-COOH | 19.9 | 0.70 | 16.6 | – |
| (C14)2-Glu-C2-COOH | 33.2 | 0.60 | 19.2 | – |
| (C16)2-Glu-C2-COOH | 44.9 | 0.63 | 19.4 | – |
| (C18)2-Glu-C2-COOH | 56.7 | 0.40 | 12.3 | 10.8 |
3.2. X-ray diffraction
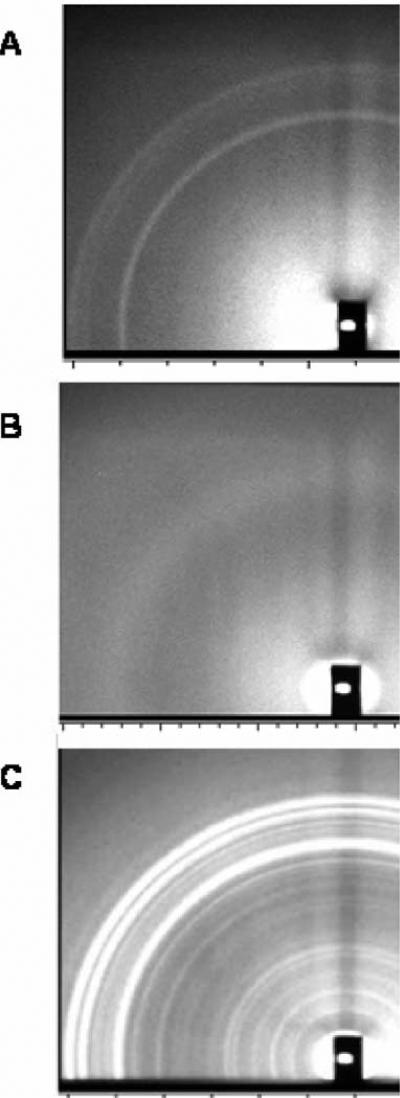
Fig. 5A shows diffraction from (C12)2-Glu-C2-COOH at 10 °C in the wide-angle region. All of the lipids displayed similar wide-angle patterns when first observed at 10 °C. When the C12 lipid was heated to 48 °C, the pattern in Fig. 5B emerged. The wide-angle pattern is much more diffuse than in the gel phase, which is typical of fluid phase lipids. Fig. 5C shows a very ordered pattern that resulted when the C12 chain length was first heated to 48 °C, then cooled to and held at 10 °C for one day. This pattern is typical of a highly ordered subgel phase. However, the identical spacings of the strongest wide-angle reflections due to chain packing in Fig. 5A and C suggest that these samples are in the same phase and that it is only the additional annealing that results in a more perfectly ordered sample that clearly exhibits the reflections better.
Fig. 5.
X-ray diffraction patterns of fully hydrated lipids in pH 10 CHES buffer in capillaries. (A) (C12)2-Glu-C2-COOH at 10 °C. (B) (C12)2-Glu-C2-COOH at 48 °C. (C) (C12)2-Glu-C2-COOH held at 10 °C for one day after heating to 48 °C.
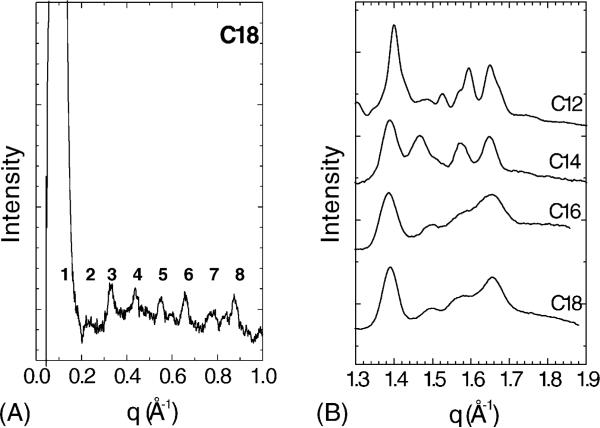
The lamellar nature of the low-angle scattering was especially evident in the C18 sample which displayed eight orders of lamellar diffraction (see Fig. 6A). The other chain lengths displayed a strong first Bragg order, but the higher orders were weaker than those for the C18 lipid (data not shown). Nevertheless, low-angle D-spacings were calculated and are summarized in Table 2. Fig. 6B shows the wide-angle radial average of diffracted intensity data of (Cn)2-Glu-C2-COOH lipids corresponding to the type of data shown in Fig. 5. The averaged intensities shown here are from our most well-ordered samples. We attempted to order each lipid as well as possible by following a T-jump thermal protocol (Tristram-Nagle et al., 1987) that was designed to successfully nucleate and grow the subgel phase of DPPC (Tristram-Nagle et al., 1994). Each sample was first heated to just above its TM, then cooled at 10 °C/h to 1 °C, where it was held for 1−2 h in order to initiate nucleation of some subgel domains. Then the temperature was raised to 10 °C below the TM in the hope that no additional subgel domains would be nucleated. The temperature was held there for one day so that the nucleated domains might grow into a complete subgel phase. After this T-jump protocol, all capillaries were loaded into a cassette and stored at 5 °C for one month prior to X-ray study at 10 °C. This T-jump method was only partially successful for these di-alkyl lipids, and additional growth of the subgel occurred with temperature changes during the X-ray experiment. The C12 sample, with results shown in Fig. 5C, was the best ordered phase. The C14 sample increased its order when the temperature was raised from 10 °C to 25 °C, evidenced by the increasing sharpness of its wide-angle peaks (1.3 < q < 1.8 Å−1). Fig. 6 shows that the wide-angle peaks are sharper for C12 and C14; the broadness of the C16 and C18 peaks suggests that the subgel phase is still not fully formed.
Fig. 6.
Radially averaged X-ray intensities. (A) Low-angle data with eight orders of lamellar diffraction for (C18)2-Glu-C2-COOH lipid at 10 °C obtained from a capillary sample in pH 10 CHES buffer. (B) Wide-angle data collected at 10 °C in pH 10 CHES buffer, except that (C14)2-Glu-C2-COOH data were collected at 25 °C.
Table 2.
Summary of X-ray results for (Cn)2-Glu-C2-COOH lipids in CHES buffer at 10 °C
| Lipid |
D-Spacings (Å) |
||
|---|---|---|---|
| Low-angle | Medium-angle | Wide-angle | |
| (C12)2-Glu-C2-COOH | 44.8 | 13.5, 10.8, 8.9, 8.3, 7.6, 6.1, 5.9, 5.4, 5.1 | 4.49, 4.12, 3.94, 3.81 |
| (C14)2-Glu-C2-COOH | 48.5 | 14.7, 9.0, 6.0, 4.9 | 4.52, 4.28, 4.00, 3.81 |
| (C16)2-Glu-C2-COOH | 52 | 8.4, 7.3 | 4.53, 4.19, 3.98, 3.80 |
| (C18)2-Glu-C2-COOH | 55.7 | 8.4, 7.4 | 4.53, 4.21, 3.98, 3.80 |
3.3. Fourier transform infrared spectroscopy
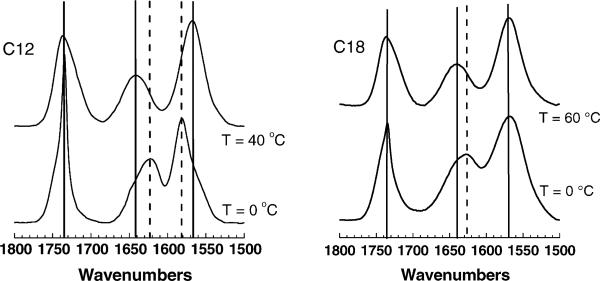
Fig. 7 shows the FTIR spectra obtained in both the subgel phase (0 °C) and in the melted, fluid phase for C12 and C18. The broad absorption band between 1550 and 1600 cm−1 arises from the carboxylate group of the succinic moiety. In the subgel phase of C12 this band occurs near 1580 cm−1 and shifts to near 1567 cm−1 in the fluid phase. This indicates that the interaction of the carboxylate with its counterion, most likely Na+, changes during the phase transition; this could be due to an increase in hydration of the headgroup in the fluid phase. This shift did not occur for C18, suggesting that the headgroup in the subgel phase may be more hydrated in this sample. Fig. 7 also shows a broad absorption band between 1600 and 1650 cm−1 which arises from the amide bond between the succinic and glutamic acid moieties. With both C12 and C18 this amide I band occurs near 1625 cm−1 in the subgel phases and shifts to 1640 cm−1 in the fluid phases. This behavior is consistent with either a decrease in the polarity of the local environment of the amide carbonyl group, or a decrease in the strength of the hydrogen-bonding interactions in the fluid phase, or both. The weakening of the hydrogen-bonding interactions is the more likely reason; this could be caused by increased interlamellar water in the fluid phase. Finally, there is also an absorption band near 1735 cm−1 that arises from the ester carbonyl groups between the glutamic acid and the alcohol moieties. This band is sharp in the low temperature phases of both lipids at 0 °C, suggesting the existence of highly immobilized ester carbonyl groups (Lewis and McElhaney, 2002). The frequency of this band is outside the range that is normally attributed to hydrogen-bonded ester carbonyl groups, suggesting that these groups are in relatively nonpolar environments in the subgel phase and are not involved in hydrogen-bonding interactions with water or other groups in the headgroup region. At the higher temperature in Fig. 7 the sharp band is replaced for both the C12 and C18 lipids by a broader band involving components centered near 1737 cm−1 and 1719 cm−1. The latter component is in a range consistent with hydrated or hydrogen-bonded ester carbonyl groups.
Fig. 7.
FTIR spectra of (C12)2-Glu-C2-COOH and (C18)2-Glu-C2-COOH in the subgel phase (0 °C) and in the fluid phase.
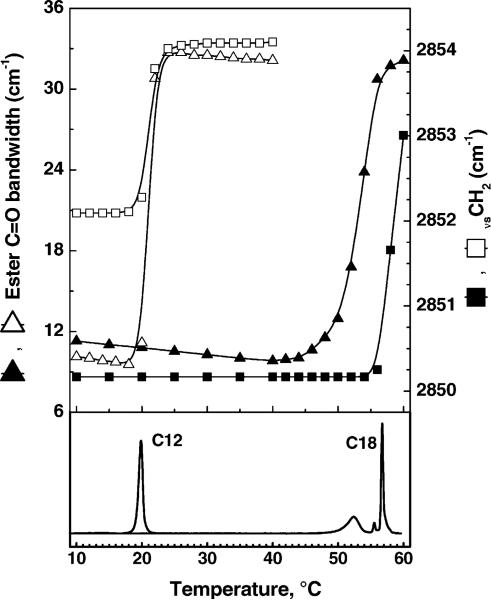
These FTIR data provide valuable information regarding the phase transitions seen by calorimetry in Fig. 3. Fig. 8 shows the temperature dependencies for C12 and C18 of the width Δν of the ester C=O stretching band near 1735 cm−1 and the frequencies of the CH2 symmetric stretching band. Transitions in these two quantities occurred for C12, C14 and C16 at the same temperature as the DSC melting transitions, as shown for C12 in Fig. 8. Also, transitions in the CH2 scissoring frequencies near 1470 cm−1 (data not shown) occurred at these same temperatures. However, for C18 the transitions in the C=O stretching bandwidth and in the CH2 scissoring frequency both occurred at the same temperature as the lower DSC transition near 52 °C, and the transition in the CH2 stretching frequency occurred at the same temperature as the sharp, main melting transition near 57 °C. This indicates that major changes in the lateral packing interactions between hydrocarbon chains and in the hydrogen bonding interactions in the headgroup interfacial region of C18 both coincide with the broad lower temperature transition, whereas changes in hydrocarbon chain conformational order, i.e., hydrocarbon chain melting, occur at the main transition TM. We therefore assign the broad lower temperature transition in C18 to a subgel-to-gel phase transition and the main transition to a gel-to-fluid phase transition. In C12 and C14 all the spectroscopic changes described above coincide with the single calorimetric transition which we assign to a subgel-to-fluid phase transition. The behavior of C16 is more complex. Of the two transitions observed by DSC in Fig. 3, all of the structural changes observed by FTIR occur at the higher melting transition. In addition, the lower transition can be thermally annealed out, suggesting that the lower temperature peak is probably attributable to domain inhomogeneities in the subgel phase formed when initially cooled to low temperatures. Thus, on full equilibration C16 is more similar to C12 and C14 where the phase transition is from an Lc phase to an Lα phase.
Fig. 8.
FTIR data (top) showing ester C=O bandwidth Δν (triangles) and CH2 stretching ν (squares) during=heating of (C12)2-Glu-C2-COOH (open symbols) and (C18)2-Glu-C2-COOH (solid symbols). On the bottom are two heating scans from the DSC data of Fig. 3.
The preceding justifies the way we compared the enthalpies of transition in Fig. 4. In order to compare the energetics of melting all the way from the subgel phase to the fluid phase for all the chain lengths, the lower and main transition enthalpies are combined for C16 and C18. As shown in Fig. 4, there was the expected increase in the combined enthalpies with chain length. Deviations from a smooth increase are most likely associated with incomplete formation of the subgel phase in longer chains due to their slower kinetics of subgel formation.
4. Discussion
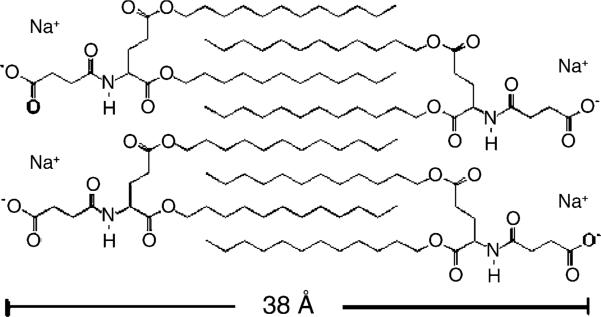
We suggest the structural model for the ordered, lamellar subgel phase of (C12)2-Glu-C2-COOH whose main features are shown in the two-dimensional sketch in Fig. 9. The sharp (resolution limited) reflections seen in Fig. 6B in the wide-angle region of the (C12)2-Glu-C2-COOH subgel phase indicate that the hydrocarbon chains are all-trans and not tilted. The X-ray reflections can be indexed to a distorted orthorhombic subcell with d20 = 4.49 Å, d1−1 = 3.94 Å, and d11 = 3.81 Å. The unit cell parameters for this subcell, a = 9.0 Å, b = 4.30 Å and β = 92.7°, can be used to calculate the area AChain = 19.3 Å2 per hydrocarbon chain. The distorted orthorhombic subcell is similar to that observed in another charged lipid with a small headgroup, DM-TAP (Lewis et al., 2001), with a nearly identical AChain = 19.1 Å2. It is also not much larger than AChain = 19.0 Å2 obtained for DPPC subgel phase (Ruocco and Shipley, 1982).
Fig. 9.
Model of (C12)2-Glu-C2-COOH lipid at 10 °C.
Our model in Fig. 9 emphasizes interdigitation of the hydrocarbon chains. One interesting feature illustrated by the figure is that the two chains on a single lipid molecule are not nearest neighbors, whereas the pair of chains of more conventional lipids that form interdigitated bilayers probably are nearest neighbors. This difference in chain packing in our model in Fig. 9 is possible because the backbone linkage on the COOH lipids is longer than the usual glycerol linkage. However, this kind of detail of the chain packing cannot be determined from our data, any more than it can be for conventional interdigitated phases. Furthermore, it must be emphasized that Fig. 9 is a crude sketch regarding the chain packing.
The main purpose of Fig. 9 is to illustrate the bilayer thickness, which should not depend much upon chain packing, and which is about 38Å in our suggested model. Together with the low-angle D-spacing of 44.8 Å, this indicates a steric water spacing D′W of 7 Å between adjacent bilayers in an MLV. This water spacing is smaller than that of the non-interdigitated subgel phase of DPPC (10.4 Å) (Nagle and Wiener, 1988). It is also slightly smaller than the water spacing (8 Å) of the interdigitated subgel phase of dihexadecylphosphatidylcholine (DHPC) reported by Lohner et al. (1987). In contrast, the cationic lipid DM-TAP had virtually no water between bilayers in its subgel phase (Lewis et al., 2001).
Let us also consider a model in which the chains are not interdigitated. Untilted chains would require a steric bilayer thickness of 55 Å which is larger than the D-spacing. To reduce the bilayer thickness to the measured D-spacing would require tilting the chains by more than 30°. Such a large tilt would broaden the wide-angle peaks of the unoriented MLV samples much more than is shown in Fig. 6b. Furthermore, the increment in D-spacing of 3.7 Å as a function of chain length (see Table 2) is consistent with interdigitated chains for all the chain lengths. A calculated increase of 2 × 1.27 Å = 2.54 Å would result from the increase in two interdigitated carbons/chain, plus an increase in water spacing of 1.2 Å to yield 3.7 Å. If the chains were not interdigitated, either the water spacing would have to decrease by (5.1−3.7) Å upon increasing n by 2, or the tilt angle would have to exceed 43° to accommodate the measured increment 3.7 Å in D-spacing versus chain length. The latter possibility contradicts the wide-angle data and the former possibility appears less likely than our preferred model. Unfortunately, the lack of an electron dense headgroup precludes obtaining electron density profiles that would confirm this conclusion as has been done for the interdigitated gel phase of DPPC in the presence of surface active small molecules (McIntosh et al., 1983).
The (Cn)2-Glu-C2-COOH lipids become more ordered than typical gel phases at low temperature and this suggests that the low temperature phase should be considered to be a subgel phase. This was especially apparent for C12 and C14 in the X-ray data in Fig. 5C and Table 2 that showed several wide-angle and many medium-angle reflections, which are not present in typical gel phases, indicating periodicities associated with well-packed hydrocarbon chains and headgroup ordering (Raghunathan and Katsaras, 1995). In the DSC cooling scans (Fig. 3) the presence of broader transitions at lower temperatures and lack of a strong, sharp transition near TM suggest that the shorter chain lengths do not cool into a gel phase, but rather nucleate and slowly grow directly into a subgel phase. A separate phase that could be a gel phase occurs between the subgel and fluid phases for C18, and transiently for C16. The equilibrium melting behavior of the C12, C14 and C16 lipids is similar to that of other lipids that have thermal transitions directly from the subgel phase to the fluid phase, such as DMPE (Wilkinson and Nagle, 1984; Lewis and McElhaney, 1993) and DM-TAP (Lewis et al., 2001). They also share with MPPC the property of having no gel phase (Serrallach et al., 1984), although MPPC does have a ripple phase, which these lipids do not have. Mini-interdigitation was proposed to be an important factor for MPPC subgel formation (Tristram-Nagle et al., 1999); the chains of the (Cn)2-Glu-C2-COOH lipids appear to be fully interdigitated in the subgel phase so this predisposition is already present. As the chain length increases, the total van der Waals interactions between chains increases. If strong headgroup interactions are also required for subgel formation, then the longer chains could inhibit this formation since their van der Waals interactions are relatively more dominant. The same behavior was observed for the PCs (Lewis et al., 1987).
Further confirmation that the low temperature phase in the (Cn)2-Glu-C2-COOH lipids is a subgel, not a gel phase, is that the combined enthalpies of melting are more than double the main melting transition of the zwitterionic PCs. What is the reason for these larger enthalpies? The reason is probably not due to melting of interdigitated chains alone, since Laggner et al. (1987) showed that interdigitated chains in dihexadecyl PC have nearly the same enthalpies of melting as DPPC. Our explanation for the larger enthalpies is that the sharp transitions that appear in Fig. 3 for the C12 and C14 chain lengths are combined sub- and main transitions. The melting of the subgel phase directly to the liquid crystalline phase also had a high enthalpy of 16.2 kcal/mol in DMPE (Wilkinson and Nagle, 1984; Aoki et al., 2001) and 15.9 kcal/mol in DM-TAP (Lewis et al., 2001).
The proposed phase behavior is supported by the FTIR data in Fig. 8 that reveal that there are two separable events. The first of these is manifested by the changes in the C=O stretching and the CH2 bending regions that are the result of degradation of lateral close contact interactions between the lipid molecules; this is consistent with what occurs in the transition from subgel to gel phases (see Lewis and McElhaney, 1990, 1992). The second event is manifested by the change in the CH2 stretching frequency that reflects the trans-gauche isomerizations during melting of the chains (Lewis and McElhaney, 2002). Both of these events occur simultaneously at the single transition in C12, C14 and (with annealing) C16, but for C18 the first event occurs at a lower temperature than the CH2-stretching transition. This confirms that the lower transition in C18 is a subgel transition and that the upper transition is a chain melting main transition.
To return to an initial goal of this work, to investigate the relative importance of the van der Waals, hydration and electrostatic forces to the structure and phase behavior of these lipids, we discuss the effect of using pH 10 CHES buffer. When CHES buffer is not used, these lipids are quite acidic (pH 4.0) in pure water. This results in higher TM's for all the chain lengths, indicating a more stable low temperature structure at low pH (see Fig. 2). At pH 4.0, the carboxyl group may be partially protonated compared to pH 10 with buffer, thereby reducing electrostatic repulsive interactions, allowing tighter headgroup hydrogen bonding. Similarly, the PEs have higher TM's than the corresponding PCs due to weak and transient hydrogen bonding in the headgroup region (Nagle, 1976; Boggs, 1980). In addition, osmotic pressure measurements have shown that adhesion between adjacent PE bilayers is stronger than between the corresponding PC lipids (McIntosh and Simon, 1996). It is therefore consistent that the COOH lipids tended to clump for lower pH and it was not until pH 10 that these lipids could be hydrated into the usual opaque suspensions that are easier to study by the methods employed in this paper.
Acknowledgments
STN and JFN were supported by US National Institutes of Health grant GM44976-12. RNAHL and RNM were supported by Operating and Major Equipment grants from the Canadian Institutes of Health Research and the Alberta Heritage Foundation for Medical Research. BFM and JWS were supported by the National Science Foundation BES-0093538, the Arnold and Mabel Beckman Foundation, and a joint grant from the Air Force Office of Scientific Research and the DARPA SIMBIOSYS program.
References
- Aoki H, Koto T, Kodama M. Calorimetric investigation of conversion to the most stable subgel phase of phosphatidylethanolamine-water system. J. Thermal Anal. Calorim. 2001;64:299–306. [Google Scholar]
- Berndt P, Fields G, Tirrell M. Synthetic lipidation of peptides and amino acids—monolayer structure and properties. J. Am. Chem. Soc. 1995a;117:9515–9522. [Google Scholar]
- Berndt P, Kurihara K, Kunitake T. Measurement of forces between surfaces composed of two-dimensionally oriented, complementary and noncomplementary nucleobases. Langmuir. 1995b;11:3083–3091. [Google Scholar]
- Boggs JM. Intermolecular hydrogen bonding between lipids: influence on organization and function of lipids in membranes. Can. J. Biochem. 1980;58:755–770. doi: 10.1139/o80-107. [DOI] [PubMed] [Google Scholar]
- Dori Y, Bianco-Peled H, Satija S, Fields GB, McCarthy JB, Tirrell M. Ligand accessibility as a means to control cell response to bioactive bilayer membranes. J. Biomed. Mater. Res. 2000;50:75–81. doi: 10.1002/(sici)1097-4636(200004)50:1<75::aid-jbm11>3.0.co;2-a. [DOI] [PubMed] [Google Scholar]
- Hartgerink JD, Beniash E, Stupp SI. Self-assembly and mineralization of peptide-amphiphile nanofibers. Science. 2001;294:1684–1688. doi: 10.1126/science.1063187. [DOI] [PubMed] [Google Scholar]
- Israelachvili JN. Intermolecular and Surface Forces. Academic Press; NY: 1992. [Google Scholar]
- Kunitake T. Synthetic bilayer membranes: molecular design, self-organization, and application. Angew. Chem. Int. Ed. Engl. 1992;31:709–726. [Google Scholar]
- Laggner P, Lohner K, Degovics G, Muller K, Schuster A. Structure and thermodynamics of the dihexadecylphosphatidylcholine-water system. Chem. Phys. Lipids. 1987;44:31–60. doi: 10.1016/0009-3084(87)90004-1. [DOI] [PubMed] [Google Scholar]
- Lewis RNAH, Mak N, McElhaney RN. A differential scanning calorimetric study of the thermotropic phase behavior of model membranes composed of phosphatidylcholines containing linear saturated fatty acyl chains. Biochemistry. 1987;26:6118–6126. doi: 10.1021/bi00393a026. [DOI] [PubMed] [Google Scholar]
- Lewis RNAH, McElhaney RN. The subgel phases of n-saturated diacyl phosphatidylcholines. A Fourier transform infrared spectroscopic study. Biochemistry. 1990;29:7946–7953. doi: 10.1021/bi00486a024. [DOI] [PubMed] [Google Scholar]
- Lewis RNAH, McElhaney RN. Structures of the subgel phases of n-saturated diacyl phosphatidylcholine bilayers: FTIR spectroscopic studies of 13C=O and 2H labeled lipids. Biophys. J. 1992;61:63–77. doi: 10.1016/S0006-3495(92)81816-7. [DOI] [PMC free article] [PubMed] [Google Scholar]
- Lewis RNAH, McElhaney RN. Calorimetric and spectroscopic studies of the polymorphic phase behavior of a homologous series of n-saturated 1,2-diacyl phosphatidylethanolamines. Biophys. J. 1993;64:1081–1096. doi: 10.1016/S0006-3495(93)81474-7. [DOI] [PMC free article] [PubMed] [Google Scholar]
- Lewis RNAH, Tristram-Nagle S, Nagle JF, McElhaney RN. The thermotropic phase behavior of cationic lipids: calorimetric, infrared spectroscopic and X-ray diffraction studies of lipid bilayer membranes composed of 1,2-di-O-myristoyl-3-N,N,N trimethylaminopropane (DM-TAP). Biochim. Biophys. Acta. 2001;1510:70–82. doi: 10.1016/s0005-2736(00)00336-9. [DOI] [PubMed] [Google Scholar]
- Lewis RNAH, McElhaney RN. Vibrational spectroscopy of lipids. In: Chalmers JM, Griffiths PR, editors. The Handbook of Vibrational Spectroscopy. Vol. 5. John Wiley & Sons Ltd.; 2002. pp. 3447–3464. [Google Scholar]
- Lohner K, Schuster A, Degovics G, Muller K, Laggner P. Thermal phase behaviour and structure of hydrated mixtures between dipalmitoyl- and dihexadecyl-phosphatidylcholine. Chem. Phys. Lipids. 1987;44:61–70. doi: 10.1016/0009-3084(87)90005-3. [DOI] [PubMed] [Google Scholar]
- McIntosh TJ, Simon SA. Adhesion between phosphatidylethanolamine bilayers. Langmuir. 1996;12:1622–1630. [Google Scholar]
- McIntosh TJ, McDaniel RV, Simon SA. Induction of an interdigitated gel phase in fully hydrated phosphatidylcholine bilayers. Biochim. Biophys. Acta. 1983;731:109–114. [Google Scholar]
- Nagle JF. Theory of lipid monolayer and bilayer phase transitions: effect of headgroup interactions. J. Membr. Biol. 1976;27:233–250. doi: 10.1007/BF01869138. [DOI] [PubMed] [Google Scholar]
- Nagle JF, Wiener MC. Structure of fully hydrated bilayer dispersions. Biochim. Biophys. Acta. 1988;942:1–10. doi: 10.1016/0005-2736(88)90268-4. [DOI] [PubMed] [Google Scholar]
- Neumann R, Ringsdorf H. Peptide liposomes from amphiphilic amino acids. J. Am. Chem. Soc. 1986;108:487–490. doi: 10.1021/ja00263a021. [DOI] [PubMed] [Google Scholar]
- Pincet F, Perez E, Bryant G, Lebeau L, Mioskowski C. Long-range attraction between nucleosides with short-range specificity: direct measurements. Phys. Rev. Lett. 1994;73:2780–2783. doi: 10.1103/PhysRevLett.73.2780. [DOI] [PubMed] [Google Scholar]
- Raghunathan VA, Katsaras J. Structure of the LC' phase in a hydrated lipid multilamellar system. Phys. Rev. Lett. 1995;74:4456–4459. doi: 10.1103/PhysRevLett.74.4456. [DOI] [PubMed] [Google Scholar]
- Ringsdorf H, Schlarb B, Venzmer J. Molecular architecture and function of polymeric oriented systems: models for the study of organization, surface recognition, and dynamics of biomembranes. Angew. Chem. Int. Ed. Engl. 1988;27:113–158. [Google Scholar]
- Ruocco MJ, Shipley GG. Characterization of the sub-transition of hydrated dipalmitoylphosphatidylcholine bilayers. Biochim. Biophys. Acta. 1982;684:309–320. [Google Scholar]
- Schneider J, Dori Y, Haverstick K, Tirrell M. Force titration of Langmuir-Blodgett bilayers of glycine amphiphiles: JKR-type measurements using the surface-force apparatus. Langmuir. 2002;18:2702–2709. [Google Scholar]
- Serrallach EN, de Haas GA, Shipley GG. Structure and thermotropic properties of mixed-chain phosphatidylcholine bi-layer membranes. Biochemistry. 1984;23:713–720. [Google Scholar]
- Tristram-Nagle S, Zhang R, Suter RM, Worthington CR, Sun W-J, Nagle J-F. Measurement of chain tilt angle in fully hydrated bilayers of gel phase lecithins. Biophys. J. 1993;64:1097–1109. doi: 10.1016/S0006-3495(93)81475-9. [DOI] [PMC free article] [PubMed] [Google Scholar]
- Tristram-Nagle S, Wiener M, Yang C-P, Nagle JF. Kinetics of the subtransition in dipalmitoylphosphatidylcholine. Biochemistry. 1987;26:4288–4294. doi: 10.1021/bi00388a016. [DOI] [PubMed] [Google Scholar]
- Tristram-Nagle S, Suter RM, Sun W-J, Nagle JF. Kinetics of subgel formation in DPPC: X-ray diffraction study proves nucleation-growth hypothesis. Biophys. Biochim. Acta. 1994;1191:14–20. doi: 10.1016/0005-2736(94)90227-5. [DOI] [PubMed] [Google Scholar]
- Tristram-Nagle S, Isaacson Y, Lyatskaya Y, Liu Y, Brummond K, Katsaras J, Nagle JF. Polymorphism in myristoylpalmitoylphosphatidylcholine. Chem. Phys. Lipids. 1999;100:101–113. doi: 10.1016/s0009-3084(99)00041-9. [DOI] [PubMed] [Google Scholar]
- Tsonchev S, Schatz GC, Ratner MA. Hydrophobically-driven self-assembly: a geometric packing analysis. Nano Lett. 2003:623–626. [Google Scholar]
- Wilkinson DA, Nagle JF. Metastability in the phase behavior of dimyristoylphosphatidylethanolamine bilayers. Biochem. 1984;23:1538–1541. doi: 10.1021/bi00302a030. [DOI] [PubMed] [Google Scholar]
- Winger TM, Ludovice PJ, Chaikof EL. Lipopeptide conjugates: biomolecular building blocks for receptor activating membrane-mimetic structures. Biomaterials. 1996;17:437–441. doi: 10.1016/0142-9612(96)89661-x. [DOI] [PubMed] [Google Scholar]
- Yu Y-C, Berndt P, Tirrell M, Fields GB. Self-assembling amphiphiles for construction of protein molecular architecture. J. Am. Chem. Soc. 1996;118:12515–12520. [Google Scholar]


