

Abstract
Human apurinic/apyrimidinic endonuclease (Ape1) plays an important role by processing the >10,000 highly toxic abasic sites generated in the genome of each cell every day. Ape1 has recently emerged as a target for inhibition as its overexpression in tumors has been linked with poor response to both radiation and chemotherapy and lower overall patient survival. Inhibition of Ape1 using siRNA or the expression of a dominant-negative form of the protein have been shown to sensitize cells to DNA-damaging agents, including various chemotherapeutic agents. However, potent small molecule inhibitors of Ape1 remain to be found. To this end, we screened Ape1 against the NCI Diversity Set of small molecules and discovered aromatic nitroso, carboxylate, sulfonamide and arylstibonic acid compounds with micromolar affinities for the protein. A further screen of a 37-compound arylstibonic acid sublibrary identified ligands with IC50 values in the range 4 to 300 nM. The negatively charged stibonic acids act by a partial-mixed mode, and likely serve as DNA phosphate mimics. These compounds provide a useful scaffold for development of chemotherapeutic agents against Ape1.
Every day, over 10,000 abasic sites are formed in each cell due to the spontaneous depurination of DNA bases (Lindahl and Nyberg, 1972). Without repair, these abasic sites are both mutagenic and cytotoxic (Boiteux and Guillet, 2004). Human apurinic/apyrimidinic endonuclease (Ape1) plays the important role of processing these lesions so that they may be recognized by subsequent enzymes and repaired. Ape1 accounts for more than 95% of the abasic site cleavage activity within the cell (Wilson and Barsky, 2001). This protein cleaves the DNA 5’ to the abasic site, producing a 5’ deoxyribose phosphate (dRP) group and a 3’ hydroxyl. The 5’ dRP is a substrate for DNA polymerase β, which removes this blocking group and adds the correct nucleotide. The remaining nick in the DNA is then closed by DNA ligase, consummating repair of the site (Dianov et al., 2003). Ape1 is also a pivotal component of the base excision repair (BER) pathway, which is responsible for removing aberrant bases from the genome. This pathway is initiated by enzymatic removal of a damaged or incorrect base by a DNA glycosylase, also producing an abasic site. Following cleavage of this abasic site by Ape1, the DNA is repaired through the action of the same enzymes as described above (Dianov et al., 2003). In addition to its role in DNA repair, Ape1 has been shown to be an important facilitator of both redox- dependent and independent DNA-transcription factor binding, giving the protein the alternative name of redox factor-1 (Ref-1). Many of the transcription factors regulated by Ape1, which include Jun, Fos, NF-κB and p53, play a pivotal role in the regulation of cell growth and apoptosis (Jayaraman et al., 1997; Xanthoudakis and Curran, 1992; Xanthoudakis et al., 1992).
Both the DNA cleavage and transcription factor binding activities of Ape1 result in increased resilience of cells to proapototic stimuli such as radiation, oxidative stress, and chemotherapy (Fisher and Kelley, 2007). Not surprisingly, the overexpression of Ape1 has led to resistance to DNA damaging agents in several human tumor cell lines (Silber et al., 2002; Yang S et al, 2005). Conversely, decreasing Ape1 expression using siRNA or a dominant negative form of the protein leads to hypersensitivity to chemically-induced DNA damage in both cell culture and tumor xenograft models (Liu et al., 2003; McNeill and Wilson, 2007; Silber et al., 2002; Walker et al., 1994; Wang et al., 2004). Tumor promotion by Ape1 has not only been shown in the laboratory, but in the clinic as well, where higher levels of Ape1 expression and altered Ape1 localization have been correlated with tumor progression and poor prognosis for patients with various malignancies including osteosarcomas and breast, lung, cervical, prostate, germ cell, ovarian and head-and-neck cancers (Herring et al., 1998; Kelley et al., 2001; Koukourakis et al., 2001; Minisini et al., 2005; Puglisi et al., 2001; Puglisi et al., 2002; Robertson et al., 2001; Tanner et al., 2004; Wang et al., 2004; Xu et al., 1997). Although small molecule inhibitors of the Ape1 endonuclease or redox factor activities have been reported (Madhusan et al, 2005; Yang et al, 2005; Luo and Kelley, 2004), these inhibitors are either fairly weak, nonspecific, or the effects in cell culture have been difficult to reproduce (Fisher and Kelley, 2007). The development of effective small molecule inhibitors of Ape1 would provide useful research tools to explore its role in DNA repair, cancer and redox-coupled transcription.
It is difficult to envision the rational design of small molecule inhibitors of Ape1 using the structural information provided by its complex with an abasic DNA substrate (Mol et al., 2000). These structures reveal an active site composed of a small hydrophobic pocket surrounded by residues that form electrostatic interactions with the DNA phosphates flanking the abasic site. Specific interactions with the abasic sugar are lacking (Mol et al., 2000), and as a result, Ape1 is able to cleave 5’ to any abasic analog that is small, hydrophobic, and unbranched, including a simple ethanediol linkage (Wilson et al., 1995). Although we have previously used substrate-fragment tethering strategies to design small molecule inhibitors of several DNA repair enzymes (Jiang et al, 2005; Jiang et al, 2006; Krosky et al, 2006), this approach requires an initial substrate fragment, which is not obvious in the case of Ape1. Accordingly, we turned to high-throughput screening methods to identify and then characterize potent small molecule inhibitors of Ape1 that specifically bind to the enzyme and inhibit its activity at nanomolar concentrations.
Materials and Methods
Ape1 Purification and DNA substrates
The plasmid HAP1-pET15b was a gift of Dr. J. B. Alexander Ross. Recombinant Ape1 was purified as previously described (Erzberger et. al., 1998). The DNA substrates used in this study were synthesized using conventional solid phase synthesis and reagents supplied by Glen Research. The sequences of the substrate DNA strands are 5’-FAM-GAG AAΦ ATA GTC GCG-3’ and 3’-DABSYL-CTC TTG TAT CAG CGC-5’. Following synthesis, the oligonucleotides were HPLC purified over a Zorbax column (Phenomenex) and desalted using BioRad PD-10 reversed phase columns. The sequence of the oligonucleotides was verified using MALDI mass spectrometry. The kinetic parameters for Ape1 cleavage of the hybridized DNA were determined using a Fluoromax-3 fluorimeter (Jobin Yvon).
High Throughput Screening
To perform the screening assay, 5 µL of each library member in DMSO was first spotted to a well of a black 384-well microtiter plate (Corning Costar 3710). The addition of protein and substrate was then carried out using a Titertek MAP-C2 liquid handling system. First, 40 µL of Ape1 in reaction buffer (50 mM Tris-HCl, pH 7.5, 50 mM NaCl, 10 mM MgCl2, 1 mM EDTA, 0.05% Brij-35) was added to each well and the plate was incubated at room temperature for 20 min. The reaction was then initiated through the addition of 10 µL substrate, and the plate was incubated at room temperature for an additional 60 min. After 60 min, the final fluorescence was measured using a BMG FLUOstar Optima plate reader at excitation and emission wavelengths of 485 nm and 520 nm, respectively. The final concentrations of the reagents used in the assay were 50 mM Tris-HCl, pH 7.5, 50 mM NaCl, 10 mM MgCl2, 1 mM EDTA, 0.05% Brij-35, 20 µM small molecule, 50 nM abasic-containing DNA substrate and 5 pM Ape1. Hits were defined as those compounds able to inhibit Ape1 activity (measured as final fluorescence) by 40% or greater. Compounds that appeared highly colored, contained disulfide bonds or had structures suggestive of DNA intercalation were excluded from further analysis. Hits from the initial screen were analyzed further for inhibitory potency using the fluorescence-based assay and decreasing dilutions of inhibitor. The assay was carried out as before, with the exception that the reactions were initiated by the addition of enzyme rather than substrate, and FAM fluorescence was monitored every 5 min for a total of 30 min in order to acquire initial rate values. The final concentrations of the reagents used in the assay were 50 mM Tris-HCl, pH 7.5, 50 mM NaCl, 10 mM MgCl2, 1 mM EDTA, 0.05% Brij-35, 0.1–10 µM small molecule, 50 nM abasic-containing DNA substrate and 10 pM Ape1. Percent inhibition was determined relative to a DMSO-only control.
DNA oligonucleotides for a secondary radioactivity assay were synthesized as described above with the exclusion of the fluorescent groups. The sequences of the DNA strands are 5’-GGG CGC PΦA GTC GCG-3’, where P is 2-aminopurine, and 3’-CCC GCG TAT CAG CGC-5’. The THF-containing strand was labeled on the 5’ end using α-32P ATP (Amersham) and T4 polynucleotide kinase (New England Biolabs) prior to hybridization. The individual reactions were initiated in the same manner as the fluorescence assay and quenched at 30 or 60 minutes by adding EDTA and heating for 20 min at 70°C. The final concentration of the reagents used in the assay were 50 mM Tris-HCl, pH 7.5, 50 mM NaCl, 10 mM MgCl2, 1 mM EDTA, 0.05% Brij-35, 100 nM inhibitor, 50 nM abasic-containing DNA substrate and 5 pM Ape1. Samples from each quenched reaction were run on a 20% denaturing polyacrylamide gel and the substrate and product bands were quantified using a Fuji BAS 2500 phosphorimaging system.
IC50 Determinations
IC50 analyses were carried out on the best hits by first plating 10-fold dilutions (10 pM-10 µM) of each inhibitor onto black 384-well plates. The reactions were set up in the same manner as the initial screen with the exception that FAM fluorescence was measured every 5 min following reaction initiation for a total of 60 min. Using the initial rate values from the assay, percent activity was calculated for each sample relative to a negative (DMSO only) control. The data were fitted to a sigmoidal dose-response model using Graphpad Prism software and IC50 values were determined using eq 1.
| (1) |
DNA Intercalation Assay
An ethidium bromide-based DNA binding assay was carried out essentially as described (Boger et al., 2001). Briefly, 10-fold dilutions of hit compounds in DMSO were spotted onto a 384-well black microtiter plate in 2.5 µL aliquots. To each well was added 47.5 µL of a mixture of ethidium bromide and DNA substrate in Ape1 reaction buffer. Ethidium bromide fluorescence was monitored at excitation and emission wavelengths of 544 nm and 612 nm, respectively. The final concentrations of the reagents used in the assay were 50 mM Tris-HCl, pH 7.5, 50 mM NaCl, 10 mM MgCl2, 1 mM EDTA, 0.05% Brij-35, 100 pM-100 μM inhibitor, 1 µM ethidium bromide and 133 nM DNA substrate in order to maintain a ratio of 1:2 of ethidium bromide to DNA base pairs. Percent fluorescence was calculated relative to a negative (DMSO only) control.
Mode of Inhibition Analysis
A mode of inhibition analysis was carried out on the best arylstibonate inhibitors by first plating dilutions of each inhibitor onto white non-binding 96-well microtiter plates (Corning 3600). Dilutions of substrate in Ape1 buffer were added to each well, followed by the addition of Ape1 protein to initiate the reactions. FAM fluorescence was then monitored every 5 min for a total of 30 min. The final concentration of the reagents used in the assay were the same as the screening conditions except that the NaCl concentration was increased to 75 mM to increase Km and allow rate measurements at substrate concentrations much less than Km. A range of inhibitor concentrations between 5 nM and 10 µM, and substrate concentrations in the range 62.5 nM and 2 µM were used. The data were analyzed using GraphPad Prism software, and initial rate values were used for global discrimination fitting by the computer simulation program Dynafit v.3.28 (BioKin)(Kuzmic, 1996).
Cell Culture Studies
Modified Eagles Medium (MEM, Mediatech) supplemented with 10% fetal bovine serum (Hyclone) and penicillin/streptomycin (Invitrogen) was used for all tissue culture. Human osteosarcoma (HOS) cells (American Type Culture Collection) were plated onto 96-well tissue culture plates at a density of 3000 cells/well and allowed to adhere overnight. The following day, inhibitor (in media) was added to a concentration of 5 µM and the cells were incubated an additional 24 h. On the third day, the old media was removed and fresh inhibitor and 0, 25 µM, or 50 µM MMS was added to the cells. After 48 h additional incubation, the cells were counted, diluted, and plated in triplicate onto 6-well tissue culture plates. Colonies were allowed to grow for one week prior to being rinsed with PBS−/− and fixed and stained with 6% glutaraldehyde and 0.5% crystal violet for 1.5 h. Stained colonies were counted and clonogenic survival was determined relative to untreated cells.
Results
High-Throughput Screening
A robust molecular beacon assay was used to identify inhibitors of Ape1. Briefly, a double stranded DNA substrate containing a tetrahydrofuran (THF) abasic site mimic was synthesized, purified, and annealed to its complementary strand. The strand containing the THF site was labeled on the 5′ end using fluorescein (FAM), while the 3′ end of the opposite strand was labeled with a dabsyl quench (DAB, Fig. 1A). Upon DNA backbone cleavage by Ape1, a small seven-base oligonucleotide labeled with the FAM group spontaneously dissociates from the remaining DNA (Fig. 1B), causing fluorophore emission to increase by approximately 6-fold under the assay conditions used (Fig. 1C). The kcat and Km of Ape1 for this substrate in a buffer containing 50 mM Tris-HCl, pH 7.5, 50 mM NaCl, 10 mM MgCl2, 1 mM EDTA and 0.05% Brij-35 are 8 ± 1 s−1 and 90 ± 30 nM, respectively (Supplemental Fig. 1). The turnover number kcat was not significantly dependent on the NaCl concentration in the range 50 to 150 mM, but Km increased to 570 ± 100 nM at [NaCl] = 100 mM (not shown). Based on these findings, we chose to carry out the screening studies at 50 mM [NaCl] where Km was fairly low (to conserve substrate), and to use a substrate concentration equal to the Km, so that both competitive and uncompetitive inhibitors could be detected.
Fig. 1.

Molecular beacon assay for Ape1. (A) An oligonucleotide containing a tetrahydrofuran (THF) abasic site mimic was used in the Ape1 molecular beacon substrate. The top strand was labeled on the 5’ end with a 6-carboxyfluorescein (FAM) fluorophore, the bottom on the 3’end with a dabsyl (DAB) quench. (B) Upon cleavage by Ape1, the fluorophore dissociates from the dabsyl quench, causing an increase in fluorescence. (C) An approximate 6-fold increase in fluorescence is observed upon DNA cleavage by Ape1.
High-throughput screening for inhibitors of Ape1 was carried out using the 2000 compound Diversity Set obtained from the National Cancer Institute. Initial hits were defined as those compounds that inhibited protein activity by 40% or greater. The initial screen identified approximately 140 molecules as inhibitors of Ape1, giving a hit rate of 7%. All but 15 of these compounds reconfirmed as hits in a secondary fluorescence assay. To cull the remaining 125 confirmed hits, 86 molecules with weak inhibition (<75% inhibition at 20 µM compound) were eliminated. For these 125 compounds, those that contained disulfide bonds or with structures suggestive of DNA intercalation were also not investigated further, as were nine weakly inhibitory and intensely colored dye-like compounds. Ten of the remaining 32 hits were found to inhibit Ape1 activity by ≥50% at concentrations in the range of 0.1 to 10 µM (Table 1). The inhibitory activities of four representative compounds (13778, P7810, 28620 and 15596) were then verified using a radioactive assay (Supplemental Fig. 2).
Table 1.
Inhibitory Activity for Diversity Set Hitsa
| Compound | Chemical Structure | Percent Inhibition | |||
|---|---|---|---|---|---|
| 10 µM | 5 µM | 0.5 µM | 0.1 µM | ||
| 329379 | 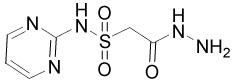 |
69 | 55 | 4 | 0 |
| 133896 | 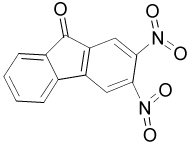 |
50 | 35 | 12 | 15 |
| 13778 | 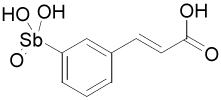 |
100 | 98 | 87 | 61 |
| 10470 | 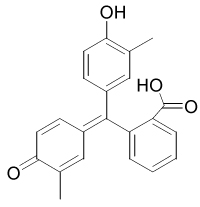 |
91 | 84 | 17 | 10 |
| P7810 | 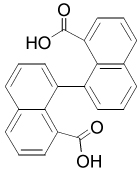 |
83 | 69 | 30 | 10 |
| 25857 | 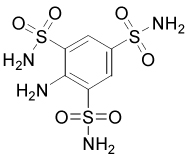 |
100 | 90 | 26 | 8 |
| 28620 | 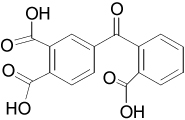 |
74 | 61 | 20 | 14 |
| 15596 |  |
73 | 61 | 19 | 19 |
| 15603 | 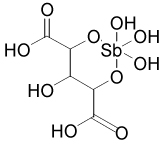 |
71 | 63 | 27 | 7 |
| 16168 | 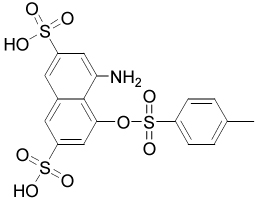 |
63 | 42 | 0 | 0 |
Reactions were carried out in the presence of 50 nM substrate and 10 pM Ape1. Numbers represent averaged duplicate measurements.
From the initial screen, two of the best Ape1 inhibitors, 15596 and 13778, were arylstibonic acids suggesting that such compounds may serve as useful scaffolds for further diversification. Accordingly, we screened an additional 37-member arylstibonic acid library that we obtained from the Developmental Therapeutics Program at the National Cancer Institute. This effort identified two more inhibitors (13755 and 13793) with increased potency over the initially screened compounds (Figure 2). The IC50 values for these arylstibonic acids ranged from 4 nM to 17 nM using the screening buffer that contains 50 mM NaCl (Table 2).
Fig. 2.

IC50 analyses for the most potent aryl-stibonic acid inhibitors. The five best antimony-containing inhibitors have IC50 values in the low to mid nanomolar range (Table 2).
Table 2.
Structures of Stibonic Acid Sublibrary Hits and IC50 Values
| Compound | Chemical Structure | IC50 (nM)a |
|---|---|---|
| 13778 | 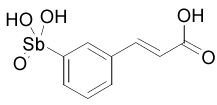 |
200 ± 100 |
| 15596 | 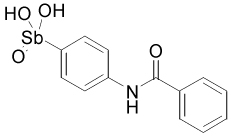 |
300 ± 100 |
| 13755 | 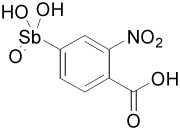 |
4 ± 1 (19 ± 6)b |
| 13793 | 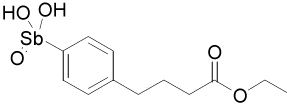 |
17 ± 2 (36 ±10) b |
IC50 determinations were carried out in the presence of 50 nM substrate and 50 mM NaCl.
The values in parentheses are the Ki values corresponding to the partial mixed-type mechanism using 75 mM [NaCl] (see Scheme 1).
Mode of Inhibition
A detailed mode of inhibition analysis was carried out on the two most potent aryl-stibonate inhibitors (13755 and 13793). Initial rates were measured as a function of substrate concentration at fixed amounts of each inhibitor (Fig. 3A). The observed rates at each substrate concentration were plotted against inhibitor concentration and fitted to various inhibition models using the simulation program Dynafit (Kuzmic, 1996)(Fig. 3B). From this analysis a partial mixed-type inhibition mode for each compound was ascertained. Other possible mechanisms (competitive, uncompetitive, noncompetitive, partial-noncompetitive, mixed, double-partial-noncompetitive and double-partial-mixed) were excluded by statistical criteria. Thus these compounds bind to both the free enzyme and the enzyme-substrate complex, with the ESI complex exhibiting a much lower turnover number (Scheme 1). The kinetic parameters determined by computer simulation are given in Table 3.
Fig. 3.

Representative substrate saturation profiles of Ape1 in the presence of increasing concentrations of 13755 and simulations of the inhibition data. (A) Michaelis-Menten curves in the presence of increasing concentrations of 13755. (B) Dynafit simulations for 13755 using a partial mixed-type model for the inhibition.
Scheme 1.

Partial Mixed-Type Inhibition Mechanism for Arylstibonic Acids.
Table 3.
Inhibition Constants for Ape1 Inhibitorsa
| Parameter | 13755 | 13793 |
|---|---|---|
| Ks (µM) | 0.13 ± 0.02 | 0.17 ± 0.02 |
| kcat (s−1) | 7.8 ± 0.3 | 9.6 ± 0.3 |
| Ki (µM) | 0.019 ± 0.007 | 0.04 ± 0.01 |
| Kis (µM) | 0.06 ± 0.01 | 0.10 ± 0.03 |
| Ksi (µM) | 0.37 ± 0.15 | 0.48 ± 0.19 |
| kcat′ (s−1) | 0.9 ± 0.3 | 2.2 ± 0.45 |
| inhibition modeb | PM | PM |
Arylstibonates Show Specificity for Ape1 and Do Not Intercalate DNA
As a test for whether these compounds were general protein poisons, we checked whether 13778 inhibited uracil DNA glycosylase (UNG), the enzyme that acts just before Ape1 in the base excision repair pathway. As compared to Ape1, a 333-fold higher concentration of 13778 was needed to reduce UNG’s activity by 50% (IC50 (UNG) ~ 100 µM, Supplemental Fig. 3). Since 13778 inhibits Ape1 with an IC50 of 300 nM, we conclude that 13778, and its related inhibitors, show considerable specificity for Ape1 and are not general protein poisons. In addition, an ethidium bromide competition assay was used to examine the possibility that these compounds inhibited Ape1 activity by binding to DNA rather than the enzyme. In this assay, ethidium bromide is prebound to the DNA substrate and increasing concentrations of inhibitor are added. If the inhibitor were able to bind DNA by displacing ethidium bromide, a decrease in ethidium bromide (EtBr) fluorescence would be observed (Boger et al., 2001). As shown in Figure 4, the five strongest Ape1 inhibitors did not displace bound EtBr at concentrations up to 100 µM. In contrast, the known intercalator distamycin A produced a 50% decrease in ethidium bromide fluorescence in the same concentration range.
Fig. 4.

Ethidium bromide inhibitor-DNA intercalation assay. An ethidium bromide competition assay was used to evaluate the ability of the arylstibonate Ape1 inhibitors to bind DNA. No decrease in ethidium bromide fluorescence was observed upon inhibitor addition indicating that these compounds do not bind DNA.
Cell Culture Studies
Inhibition of Ape1 in cell culture through the use of small molecules, RNA interference, or the expression of a dominant negative form of the protein has been shown to increase sensitivity of human cells to the DNA alkylating agent methyl methanesulfonate (MMS) (Luo and Kelley, 2004; Madhusudan, et al., 2005; Wang et al., 2004; McNeill and Wilson, 2007; Fishel and Kelley, 2007). In this type of experiment, cells are treated with inhibitor, MMS, or both, and cell survival is determined by counting or clonogenic survival. Using this approach, we examined the activity of the arylstibonate inhibitors in human cell culture. Despite their potent in vitro inhibitory activity, we were unable to detect any decreased survival when cells were treated with 5 µM concentrations of 25857, 10470, 13755, or 13793 in the presence of 0, 25, or 50 µM MMS (Supplemental Fig. 4). As a positive control, siRNA knockdown of Ape1 expression by 80% produced a two-fold decrease in cell survival in the presence of 100 µM MMS (Supplemental Fig. 5). It should be noted that none of the tested compounds displayed any cytotoxicity up to concentrations of 5 μM with the exception of 10470, which was highly toxic as a single agent to HOS, MCF-7 and PC-3 cells at this concentration (Supplemental Fig. 4).
Discussion
Small Molecule Inhibitors of Ape1
Several classes of inhibitors of Ape1 have been previously described. One unusually simple compound used to inhibit AP endonuclease activity is methoxyamine (MX), which attacks the ring-opened form of abasic sites to form an oxime linkage. Thus, rather than targeting the enzyme directly MX blocks Ape1 from accessing the lesion site (Liuzzi and Talpaert-Borlé, 1985). Because of this unusual mechanism, MX is not specific for Ape1 and other off-target effects would be expected (Fishel and Kelley, 2007). A second compound, lucanthone, inhibits Ape1 repair in vitro but is also a very potent topoisomerase II poison which likely accounts for its toxicity with cancer cell lines (Bases and Mendez, 1997; Luo and Kelley, 2004). The small molecule 7-nitroindole-2-carboxylic acid (NCA) has recently been shown to inhibit Ape1 in vitro with an IC50 = 3 µM, and was also reported to sensitize cells to MMS and several other DNA damaging agents (Madhusudan et al., 2005). However, subsequent studies have not been able to reproduce the sensitizing effects of NCA (Fishel and Kelley, 2007). Similar controversy surrounds the natural product resveratrol, which was originally reported to inhibit the redox activity of Ape1 (Yang S et al., 2005), but once again, this effect was not reproducible by another group (Fishel and Kelley, 2007). The present compounds inhibit Ape1 at low nanomolar concentrations in vitro (Table 2), making them the most potent Ape1 inhibitors yet reported and promising candidates for further development.
Despite robust activity in vitro, these compounds were not inhibitory in cell culture as judged by the observation that HOS cells showed no increased sensitivity to the DNA damaging agent MMS in the presence of compound. Little is known about the cell permeability or intracellular localization of aryl-stibonic acids, but they do appear to be stable in culture medium (Yang Q et al., 2005). In contrast, much is known about permeability of the pentavalent antimonial sodium stibogluconate (Pentostam), a first line treatment for Leishmaniasis. Pentostam is actively transported into macrophage cells and then reduced by a parasite-specific thiol-dependent reductase to its active trivalent form upon entering the parasite (Wyllie and Fairlamb, 2006; Mishra et al., 2007). Whether the present compounds require an active entry mechanism is unknown, but reduction to their Sb+3 form is unlikely because human macrophage and monocyte cells are unable to reduce Pentostam, and thus remain resistant to its toxic effects (Wyllie and Fairlamb, 2006). This is fortunate because the reduced forms of the aryl-stibonates are not inhibitory (see below). It is reasonable to expect that rather straight forward modifications of these compounds such as esterification of the carboxylate group might increase permeability if this is indeed an issue affecting activity in cell culture. Such prodrug forms, which should be substrates for cellular esterases or spontaneous ester hydrolysis, offer attractive avenues for further development.
The three most potent aryl-stibonic acid inhibitors of Ape1 share a common partial mixed-type inhibition pattern (Scheme 1). Thus, these negatively charged compounds can bind to both the free enzyme and the ES complex. The dissociations constants of both the substrate and inhibitor EI and ES complex are about 2 to 3-fold greater than their respective constants for binding to the free enzyme indicating energetic crosstalk between the binding sites (Table 3, Scheme 2). The 10 to 20 % residual enzymatic activity in the presence of saturating concentrations of substrate and inhibitor indicates that the ESI complex is in someway perturbed from its optimal state. Plausible physical interpretations for this inhibition pattern are suggested below.
Structure-Activity Relationships for Arylstibonates
The 37-compound arylstibonate library provides some useful structure-activity relationships (Supplemental Table 1). All of the inhibitory compounds have an anionic pentavalent stibonic acid moiety attached to a benzene ring, whereas those containing the reduced (neutral) trivalent antimony show no inhibitory activity. The five most potent inhibitors in Table 2 all have carboxylate or nitro substituents on the benzene ring placed meta or para to the stibonate group, indicating that negatively charged or polar substituents at these positions are important. Furthermore, several molecules in the library are structurally similar to our most potent inhibitor, 13755 (Ki = 19 nM), yet have no inhibitory activity. Compound 13755 is substituted at the para and meta positions with a carboxylate and a nitro group, respectively, but compounds 13744, 13743 and 13760, which possess one but not both of these groups, have no inhibitory activity. Thus, the stibonate, nitro and carboxylate functional groups must all be present and in the appropriate positions for maximal inhibition. In addition, P6966 is structurally similar to 13755, with a second carboxylate substituting for the nitro group, but it is also inactive. The second most potent inhibitor, 13793 (Ki = 36 nM), is distinct from 13755 because of its esterified butanoic acid moiety attached para to the antimony group. The length of this chain appears essential because compounds with shorter carboxylate containing chains attached in the same position are not inhibitory (P6982, P6965 and P6971, Supplemental Table 1). SARs are also apparent for compound 13778, which possesses a key ethylene linker connecting a carboxylate group to the benzene ring. If this ethylene linker is changed to ethyl (P6949), or the length of the linker is reduced by one or two carbon units (P6970, P6953 or 13759), inhibition is completely lost.
Do These Arylstibonate Compounds Mimic the Phosphate Esters in DNA?
Antimony is a group V-A element of the periodic table with properties similar to phosphorus and arsenic. Compared to phosphorus, antimony has a larger ionic radius and lower charge density, which allows Sb(V) to form an octahedrally coordinated stibonic acid species H[Sb(OH)6], which dissociates to the stibonate anion [Sb(OH)6]− in weak acid or neutral aqueous solution (Filellaa et al., 2002). This property is in contrast with P(V), which is tetrahedrally coordinated with oxygen. The aqueous equilibria of these aryl-stibonates are not known, but it is possible that they exist in equilibrium between a tetrahedral form (Table 2), or a pentavalent hydrated form in which four hydroxyl groups and one carbon atom are coordinated to the antimony center. In either case, the lower electronegativity of Sb(V) as compared to P(V) would be expected to increase the Sb-O bond length as compared to P-O, and thus, place a larger negative charge density on the oxygen atoms than the corresponding phosphonate analogue. This expectation is confirmed by the electrostatic potential surfaces shown in Figure 5A which were calculated using semi-empirical (PM3) methods for the model compounds phenyl phosphonic acid and phenyl stibonic acid. Greater charge density on the antimonial oxygens could facilitate stronger coulombic interactions with enzyme groups. Given these properties of arylstibonates, and their similarity with phosphate, we speculate that these anionic molecules may mimic the phosphate backbone groups of DNA. Based on the SARs described above, an important requirement of the observed inhibition may be positioning of essential carboxylate and stibonate groups in anion binding pockets originally intended for adjacent 3′ and 5′ DNA phosphates of a DNA strand. The crystal structure of the Ape1-abasic DNA complex shows several such binding interactions with both DNA strands. To support our proposal we extracted the abasic site from this structure and superimposed the stibonate and carboxylate groups of 13755 onto the phosphates (Figure 5B). The alignment of the antimony and phosphate centers is excellent with deviations of only tenths of an angstrom. A mechanism of inhibition involving binding to adjacent phosphate sites on the enzyme would be consistent with the observed partial mixed-type mechanism, because the DNA could still bind and react even if the inhibitor is blocking one or more phosphate binding sites. Consistent with the proposal that these compounds mimic DNA, 13778 has also been shown to inhibit poxvirus type I topoisomerase but not the closely related human type I topoisomerase (Bond, et al., 2006). Although much remains to be understood about the selectivity of these compounds, it would appear that selectivity for a given target may be provided by the positions of phosphate binding sites on the target and how well the site accommodates the aromatic functional group of the compound. These data indicate that arylstibonates may be especially useful for targeting enzymes that interact with nucleic acids.
Fig. 5.

Structural and electrostatic comparisons of phosphorus and antimony acids. (A) Models of phenylstibonic acid (pink) and phenylphosphonic acid (green) calculated using the PM3 semiempirical method (Spartan ′04, Wavefunction, Inc.). The Sb-O, Sb-C and Sb=O bondlengths are all much longer than the corresponding distances in the phosphorus compound (Sb-O = 1.99 Å, Sb-C = 2.10 Å, Sb=O = 1.95 Å; P-O = 1.69 Å, P-C = 1.77 Å, P=O = 1.46 Å.) The electrostatic potential is plotted on the Van der Waals surface of each compound. (B) Superposition of the antimony and carboxylate atoms of 13755 with the phosphodiester groups of the abasic site extracted from the complex of Ape1 with abasic DNA (pdb code 1DEW).
Supplementary Material
Acknowledgment
We thank the Developmental Therapeutics Program at the National Cancer Institute for the small molecule libraries.
This work was supported by NIH grant GM56834 to J.T.S and in whole or in part with federal funds from the National Cancer Institute, National Institutes of Health, under contract N01-CO-12400. The content of the publication does not necessarily reflect the views or policies of the Department of Health and Human Services, nor does the mention of trade names, commercial products, or organizations imply endorsement by the U.S. Government.
Abbreviations used are
- Ape1
human apurinic/apyrimidinic endonuclease 1
- dRP
deoxyribose phosphate
- BER
base excision repair
- Ref-1
redox factor-1
- FAM
6-carboxyfluorescein
- DAB
dabsyl
- THF
tetrahydrofuran
- MMS
methyl methanesulfonate
- MX
methoxyamine
- NCA
7-nitroindole-2-carboxylic acid
References
- Bases RE, Mendez F. Topoisomerase inhibition by lucanthone, an adjuvant in radiation therapy. Int J Radiation Oncology Biol Phys. 1997;37:1133–1137. doi: 10.1016/s0360-3016(97)00113-2. [DOI] [PubMed] [Google Scholar]
- Boger DL, Fink BE, Brunette SR, Tse WC, Hedrick MP. A simple, high-resolution method for establishing DNA binding affinity and sequence selectivity. J Am Chem Soc. 2001;123:5878–5891. doi: 10.1021/ja010041a. [DOI] [PubMed] [Google Scholar]
- Boiteux S, Guillet M. Abasic sites in DNA: repair and biological consequences in Saccharomyces cerevisiae. DNA Repair (Amst.) 2004;3:1–12. doi: 10.1016/j.dnarep.2003.10.002. [DOI] [PubMed] [Google Scholar]
- Bond A, Reichert Z, Stivers JT. Novel and specific inhibitors of a poxvirus type I topoisomerase. Mol Pharmacol. 2006;69:547–557. doi: 10.1124/mol.105.019067. [DOI] [PubMed] [Google Scholar]
- Dianov GL, Sleeth KM, Dianova, Allinson SL. Repair of abasic sites in DNA. Mutat Res. 2003;531:157–163. doi: 10.1016/j.mrfmmm.2003.09.003. [DOI] [PubMed] [Google Scholar]
- Erzberger JP, Barsky D, Scharer OD, Colvin ME, Wilson DM., III Elements in abasic site recognition by the major human and Escherichia coli apurinic/apyrimidinic endonucleases. Nucleic Acids Res. 1998;26:2771–2778. doi: 10.1093/nar/26.11.2771. [DOI] [PMC free article] [PubMed] [Google Scholar]
- Filellaa M, Belzileb N, Chen Y-W. Antimony in the environment: a review focused on natural waters II. Relevant solution chemistry. Earth-Sci Rev. 2002;59:265–285. [Google Scholar]
- Fishel ML, Kelley MR. The DNA base excision repair protein Ape1/Ref-1 as a therapeutic and chemopreventive target. Mol Aspects Med. 2007;28:375–395. doi: 10.1016/j.mam.2007.04.005. [DOI] [PubMed] [Google Scholar]
- Herring CJ, West CM, Wilks DP, Davidson SE, Hunter RD, Berry P, Forster G, MacKinnon J, Rafferty JA, Elder RH, Hendry JH, Margison GP. Levels of the DNA repair enzyme human apurinic/apyrimidinic endonuclease (APE1, APEX, Ref-1) are associated with the intrinsic radiosensitivity of cervical cancers. Br J Cancer. 1998;78:1128–1133. doi: 10.1038/bjc.1998.641. [DOI] [PMC free article] [PubMed] [Google Scholar]
- Jayaraman L, Murthy KGK, Zhu C, Curran T, Xanthoudakis S, Prives C. Identification of redox/repair protein Ref-1 as a potent activator of p53. Genes Dev. 1997;11:558–570. doi: 10.1101/gad.11.5.558. [DOI] [PubMed] [Google Scholar]
- Jiang YL, Krosky DJ, Seiple L, Stivers JT. Uracil-directed ligand tethering: an efficient strategy for uracil DNA glycosylase (ung) inhibitor development. J. Am. Chem. Soc. 2005;127:17412–17420. doi: 10.1021/ja055846n. [DOI] [PMC free article] [PubMed] [Google Scholar]
- Jiang YL, Chung S, Krosky DJ, Stivers JT. Synthesis and High-throughput Evaluation of Triskelion Uracil Libraries for Inhibition of Human dUTPase and UNG2. Bioorg Med Chem. 2006;14:5666–5672. doi: 10.1016/j.bmc.2006.04.022. [DOI] [PubMed] [Google Scholar]
- Kelley MR, Cheng L, Foster R, Tritt R, Jiang J, Broshears J, Koch M. Elevated and altered expression of the multifunctional DNA base excision repair and redox enzyme Ape1/ref-1 in prostate cancer. Clin Cancer Res. 2001;7:824–830. [PubMed] [Google Scholar]
- Koukourakis MI, Giatromanolaki A, Kakolyris S, Sivridis E, Georgoulias V, Funtzilas G, Hickson ID, Gatter KC, Harris AL. Nuclear expression of human apurinic/apyrimidinic endonuclease (HAP1/REF-1) in head-and-neck cancer is associated with resistance to chemoradiotherapy and poor outcome. Int J Radiat Oncol. 2001;50:27–36. doi: 10.1016/s0360-3016(00)01561-3. [DOI] [PubMed] [Google Scholar]
- Krosky DJ, Bianchet MA, Seiple L, Chung S, Amzel LM, Stivers JT. Mimicking Damaged DNA with a Small Molecule Inhibitor of Human UNG2. Nucleic Acids Res. 2006;30:5872–5879. doi: 10.1093/nar/gkl747. [DOI] [PMC free article] [PubMed] [Google Scholar]
- Kuzmic P. Program DYNAFIT for the analysis of enzyme kinetic data: Application to HIV proteinase. Anal Biochem. 1996;237:260–273. doi: 10.1006/abio.1996.0238. [DOI] [PubMed] [Google Scholar]
- Lindahl T, Nyberg B. Rate of depurination of native deoxyribonucleic acid. Biochemistry. 1972;11:3610–3618. doi: 10.1021/bi00769a018. [DOI] [PubMed] [Google Scholar]
- Liu L, Yan L, Donze JR, Gerson SL. Blockage of abasic site repair enhances antitumor efficacy of 1,3-bis-(2-chloroethyl)-1-nitrosourea in colon cancer tumor xenografts. Mol Cancer Ther. 2003;2:1061–1066. [PubMed] [Google Scholar]
- Liuzzi M, Talpaert-Borlé M. A new approach to the study of the base excision repair pathway using methoxyamine. J Biol Chem. 1985;260:5252–5258. [PubMed] [Google Scholar]
- Luo M, Kelley MR. Inhibition of the human apurinic/apyrimidinic endonuclease (APE1) repair activity and sensitization of breast cancer cells to DNA alkylating agents with lucanthone. Anticancer Res. 2004;24:2127–2134. [PubMed] [Google Scholar]
- Madhusudan S, Smart F, Shrimpton P, Parsons JL, Gardiner L, Houlbrook S, Talbot DC, Hammonds T, Freemont PA, Sternberg MJE, Dianov GL, Hickson ID. Isolation of a small molecule inhibitor of base excision repair. Nucleic Acids Res. 2005;33:4711–4724. doi: 10.1093/nar/gki781. [DOI] [PMC free article] [PubMed] [Google Scholar]
- McNeill DR, Wilson DM., III A dominant-negative form of the major human abasic endonuclease enhances cellular sensitivity to laboratory and clinical DNA-damaging agents. Mol Cancer Res. 2007;5:61–70. doi: 10.1158/1541-7786.MCR-06-0329. [DOI] [PubMed] [Google Scholar]
- Minisini AM, Di Loreto C, Mansutti M, Artico D, Pizzolitto S, Piga A, Puglisi F. Topoisomerase IIα and APE/ref-1 are associated with pathologic response to primary anthracycline-based chemotherapy for breast cancer. Cancer Lett. 2005;224:133–139. doi: 10.1016/j.canlet.2004.11.007. [DOI] [PubMed] [Google Scholar]
- Mishra J, Saxena A, Singh S. Chemotherapy of Leishmaniasis: Past, present and future. Curr Med Chem. 2007;14:1153–1169. doi: 10.2174/092986707780362862. [DOI] [PubMed] [Google Scholar]
- Mol CD, Izumi T, Mitra S, Tainer JA. DNA-bound structures and mutants reveal abasic DNA binding by APE1 DNA repair and coordination. Nature. 2000;403:451–456. doi: 10.1038/35000249. [DOI] [PubMed] [Google Scholar]
- Puglisi F, Aprile G, Minisini AM, Barbone F, Cataldi P, Tell G, Kelley MR, Damante G, Baltrami CA, Di Loreto C. Prognostic significance of Ape1/ref-1 subcellular localization in non-small cell lung carcinomas. Anticancer Res. 2001;21:4041–4049. [PubMed] [Google Scholar]
- Puglisi F, Barbone F, Tell G, Aprile G, Petoldi B, Raiti C, Kelley MR, Damante G, Sobrero A, Beltrami CA, Di Loreto C. Prognostic role of Ape1/Ref-1 subcellular expression in stage I-III breast carcinomas. Oncol Rep. 2002;9:11–17. [PubMed] [Google Scholar]
- Robertson KA, Bullock HA, Xu Y, Tritt R, Zimmerman E, Ulbright TM, Foster RS, Einhorn LH, Kelley MR. Altered expression of Ape1/ref-1 in germ cell tumors and overexpression in NT2 cells confers resistance to bleomycin and radiation. Cancer Res. 2001;61:2220–2225. [PubMed] [Google Scholar]
- Silber JR, Bobola MS, Blank A, Schoeler KD, Haroldson PD, Huynh MB, Kolstoe DD. The apurinic/apyrimidinic endonuclease activity of Ape1/Ref-1 contributes to human glioma cell resistance to alkylating agents and is elevated by oxidative stress. Clin Cancer Res. 2002;8:3008–3018. [PubMed] [Google Scholar]
- Tanner B, Grimme S, Schiffer I, Heimerdinger C, Schmidt M, Dutkowski P, Neubert S, Oesch F, Franzen A, Kolbl H, Fritz G, Kaina B, Hengstler JG. Nuclear expression of apurinic/apyrimidinic endonuclease increases with progression of ovarian carcinomas. Gynecol Oncol. 2004;92:568–577. doi: 10.1016/j.ygyno.2003.10.037. [DOI] [PubMed] [Google Scholar]
- Walker LJ, Craig RB, Harris AL, Hickson ID. A role for the human DNA repair enzyme HAP1 in cellular protection against DNA damaging agents and hypoxic stress. Nucleic Acids Res. 1994;22:4884–4889. doi: 10.1093/nar/22.23.4884. [DOI] [PMC free article] [PubMed] [Google Scholar]
- Wang D, Luo M, Kelley MR. Human apurinic endonuclease 1 (APE1) expression and prognostic significance in osteosarcoma: Enhanced sensitivity of osteosarcoma to DNA damaging agents using silencing RNA Ape1 expression inhibition. Mol Cancer Ther. 2004;3:679–686. [PubMed] [Google Scholar]
- Wilson DM, III, Barsky D. The major human abasic endunuclease: formation, consequences and repair of abasic lesions in DNA. Mutat Res. 2001;485:283–307. doi: 10.1016/s0921-8777(01)00063-5. [DOI] [PubMed] [Google Scholar]
- Wilson DM, III, Takeshita M, Grollman AP, Demple B. Incision activity of human apurinic endonuclease (Ape) at abasic site analogs in DNA. J Biol Chem. 1995;270:16002–16007. doi: 10.1074/jbc.270.27.16002. [DOI] [PubMed] [Google Scholar]
- Wyllie S, Fairlamb AH. Differential toxicity of antimonial compounds and their effects on glutathione homeostasis in a human leukemia monocyte cell line. Biochem Pharm. 2006;71:257–267. doi: 10.1016/j.bcp.2005.10.043. [DOI] [PubMed] [Google Scholar]
- Xanthoudakis S, Curran T. Identification and characterization of Ref-1, a nuclear protein that facilitates AP-1 DNA-binding activity. EMBO J. 1992;11:653–655. doi: 10.1002/j.1460-2075.1992.tb05097.x. [DOI] [PMC free article] [PubMed] [Google Scholar]
- Xanthoudakis S, Miao G, Wang F, Pan YC, Curran T. Redox activation of Fos-Jun DNA binding activity is mediated by a DNA repair enzyme. EMBO J. 1992;11:3323–3335. doi: 10.1002/j.1460-2075.1992.tb05411.x. [DOI] [PMC free article] [PubMed] [Google Scholar]
- Xu Y, Moore DH, Broshears J, Liu L, Wilson TM, Kelley MR. The apurinic/apyrimidinic endonuclease (APE/ref-1) DNA repair enzyme is elevated in premalignant and malignant cervical cancer. Anticancer Res. 1997;17:3713–3719. [PubMed] [Google Scholar]
- Yang Q, Stephen AG, Adelsberger JW, Roberts PE, Zhu W, Currens MJ, Feng Y, Crise BJ, Gorelick RJ, Rein AR, Fisher RJ, Shoemaker RH, Sei S. Discovery of small-molecule human immunodeficiency virus type 1 entry inhibitors that target the gp120-binding domain of CD4. J Virology. 2005;79:6122–6133. doi: 10.1128/JVI.79.10.6122-6133.2005. [DOI] [PMC free article] [PubMed] [Google Scholar]
- Yang S, Irani K, Heffron SE, Jurnak F, Meyskens FL., Jr Alterations in the expression of the apurinic/apyrimidinic endonuclease-1/redox factor-1 (Ape/Ref-1) in human melanoma and identification of the therapeutic potential of resveratrol as an Ape1/Ref-1 inhibitor. Mol Cancer Ther. 2005;4:1923–1935. doi: 10.1158/1535-7163.MCT-05-0229. [DOI] [PubMed] [Google Scholar]
Associated Data
This section collects any data citations, data availability statements, or supplementary materials included in this article.