

Abstract
Brief strong depolarization of cerebellar Purkinje cells produces a slow inward cation current. This current, called depolarization-induced slow current (DISC), is triggered by Ca influx in the Purkinje cell and is attenuated by a blocker of vesicular fusion. Previous work in other brain regions, such as the substantia nigra and ventral tegmental area, has shown that dopamine can be released from dendrites to produce paracrine and autocrine signaling. Here, we test the hypothesis that postsynaptic release of dopamine and autocrine activation of dopamine receptors is involved in DISC. Light immunohistochemistry showed that D3 dopamine receptors, vesicular monoamine transporter type 2 (VMAT2), and dopamine plasma membrane transporters (DATs) were all expressed in cerebellar Purkinje cells. However, their expression was strongest in the gyrus region of cerebellar lobules IX and X. Comparison of DISC across lobules revealed that it was weak in the anterior portions of the cerebellum (lobules II, V, and VI) and strong in lobules IX and X. DISC was blocked by dopamine receptor antagonists (haloperidol, clozapine, eticlopride, and SCH23390). Likewise, DISC was strongly attenuated by inhibitors of VMAT (reserpine and tetrabenazine) and DAT (GBR12909 and rimcazole). These drugs did not produce DISC attenuation through blockade of depolarization-evoked Purkinje cell Ca transients. Purkinje cells in cerebellar slices derived from DAT-null mice expressed DISC, but this DISC ran down at a significantly higher rate than littermate controls. Together, these results suggest that strong Purkinje cell depolarization produces Ca-dependent release of vesicular postsynaptic dopamine that then excites Purkinje cells in an autocrine manner.
Introduction
In recent years it has been appreciated that neurotransmitters and neuromodulators can sometimes travel in a retrograde manner, from postsynaptic to presynaptic neurons. In the cerebellar cortex, Duguid and coworkers have demonstrated that strong depolarization of cerebellar Purkinje cells produces a persistent increase in the frequency of mIPSCs derived from interneuron–Purkinje cell synapses, a phenomenon they have called depolarization-induced potentiation of inhibition (DPI) (Duguid and Smart, 2004; Duguid et al., 2007). DPI was blocked by loading the Purkinje cell with a Ca chelator or blockers of SNARE-dependent vesicular fusion. DPI was also blocked by bath application of an NMDA-receptor antagonist (but not a group II mGluR or a CB1R antagonist). As NMDA receptors are present at high levels on interneuron axons (Glitsch and Marty, 1999; Duguid and Smart, 2004), these authors proposed a model in which strong depolarization of Purkinje cells resulted in fusion of dendritic vesicles containing glutamate and this glutamate then diffused to ligate NMDA receptors on interneuron axon terminals, thereby triggering DPI (Duguid and Smart, 2004).
Strong depolarization of Purkinje cells results in a biphasic inward current: a faster component mediated by a Cl conductance (Llano et al., 1991) and a slower component that peaks in ∼1.5–2.5 s, which we have called depolarization-induced slow current (DISC) (Shin et al., 2008). Like DPI, DISC is blocked by antagonists of voltage-sensitive Ca channels and is attenuated by compounds that interfere with SNARE-mediated vesicle fusion. Both in our hands (Shin et al., 2008), and in those of Duguid et al. (2007), DISC was attenuated by the mGluR1 antagonist CPCCOEt. DISC was not blocked by either the NMDA receptor antagonist CPP or the AMPA/kainate receptor antagonist NBQX (Shin et al., 2008). This led us to suggest that the glutamate released from Purkinje cells by strong depolarization not only could ligate interneuronal NMDA receptors to produce DPI, but could also act in an autocrine manner on mGluR1 to evoke DISC.
However, further work in our group has invalidated this mGluR1 model (Shin et al., 2009). CPCCOEt, but not three other specific mGluR1 antagonists (JNJ16259685, 3-MATIDA, and Bay 36-7620) blocked DISC, even though all four of these drugs produced near-complete blockade of inward currents evoked by application of the mGluR1/5 agonist DHPG. Furthermore, DISC was present in Purkinje cells derived from mGluR1-null mice and mGluR1/mGluR5 double-null mice. Thus, mGluR1 activation is not required for DISC.
It has been known for many years that dopamine can be released from the dendrites of a subset of substantia nigra neurons in an activity-dependent manner. This released dopamine can have autocrine effects, producing inhibition of dopamine-containing neurons (Groves et al., 1975; Falkenburger et al., 2001). Like Purkinje cells, intrastriatal dopamine neurons also release GABA from their axon terminals (Smith and Kieval, 2000; Cossette et al., 2005; Tandé et al., 2006). This has led us to test the hypothesis that postsynaptic release of dopamine and autocrine activation of dopamine receptors is involved in DISC.
Materials and Methods
Slice preparation.
Cerebellar slices were prepared from juvenile (10–19 d old) C57BL/6 mice using standard techniques, in accordance with a protocol approved by the animal care and use committee at Johns Hopkins University. Sagittal slices of the cerebellar vermis (250 μm thick) were cut with a vibrating slicer (Leica VT 1000S) using a sapphire blade in ice-cold N-methyl-d-glucamine (NMDG)-based cutting solution containing the following (in mm): 135 NMDG, 1 KCl, 1.5 MgCl2, 0.5 CaCl2, 1.2 KH2PO4, 24.2 choline bicarbonate, and 13 glucose, bubbled with 95% O2/5% CO2 to yield pH 7.4. Slices were maintained thereafter in artificial CSF (ACSF) containing the following (in mm): 124 NaCl, 2.5 KCl, 2.5 CaCl2, 1.3 MgCl2, 1 NaH2PO4, 26.2 NaHCO3, and 20 glucose at room temperature. They were then placed in a submerged chamber that was perfused at 2 ml/min with ACSF, also at room temperature and bubbled with 95% O2/5% CO2 to yield pH 7.4. GABAzine (5 μm) was added to the recording solution to block GABAA receptors. Slices were visualized on an upright microscope equipped with infrared differential interference contrast (DIC) optics using a 40× water-immersion objective.
Electrophysiology.
Somatic whole-cell recordings were made from Purkinje cells in the cerebellum using conventional techniques. The electrode solution consisted of the following (in mm): 135 Cs-methanesulfonate, 6 CsCl, 2 MgCl2, 0.15 CaCl2, 0.2 EGTA, 10 HEPES, 4 Na2-ATP, and 0.4 Na3-GTP, pH 7.2–7.3, osmolarity 290 mOsm. Pipette resistance varied from 1.5–2 MΩ. Cells were voltage clamped using a Multiclamp 700A amplifier (Molecular Devices). Unless otherwise noted, the command potential was −70 mV. Series resistance was <15 MΩ. Recordings of membrane current were filtered at 1 kHz, digitized at 5 kHz, and collected with pClamp 9 software (Molecular Devices).
DISC was induced by a test stimulus consisting of five 10-ms-long depolarizing command pulses from −70 to 0 mV at 10 Hz. Pilot studies showed that DISC could also be induced by a single 10-ms-long depolarizing step to 0 mV, but in this case the DISC response was smaller and more variable.
The following agents were added to the recording bath or internal solution: SR95531 (GABAzine) was purchased from Ascent Scientific. Haloperidol, clozapine, eticlopride, SCH23390, reserpine, tetrabenazine, GBR12909, and rimcazole were purchased from Tocris. All other chemicals were from Sigma. Dopamine-null mice and wild-type littermates [originally described by Sora et al. (1998)] were used at P18–P23. Mice were genotyped as previously described (Perona et al., 2008).
Analysis.
Patch clamp data were analyzed off-line using Clampfit (Molecular Devices), Origin (OriginLab), and Igor Pro (WaveMetrics) software. Group data were expressed as mean ± SEM and statistical significance was determined using the unpaired Student's t test or single-factor ANOVA throughout this study. The DISC charge transfer was measured from a 1-s-long segment centered at the DISC peak. Off-line digital processing of traces was used to high-pass filter the traces at 10 Hz to extract the noise envelope, which generally tracks DISC amplitude (Shin et al., 2008). The noise SD was calculated from a 1-s-long segment centered at the DISC peak of the digitally high-pass-filtered traces. Δ noise SD was calculated by subtracting the noise SD in a 1-s-long sample before depolarization (baseline noise SD) from that during DISC sampling period and normalized by baseline noise SD.
Immunohistochemistry.
Animals were anesthetized with ketamine (100 mg/kg) and xylazine (10 mg/kg) and perfused intracardially with 4% paraformaldehyde in 0.1 m sodium phosphate buffer. After the perfusion, brains were isolated and maintained in the same paraformaldehyde solution overnight at 4°C, then washed with PBS. The cerebellum was cut into 50 μm slices on a vibrating tissue slicer (Leica VT 1000S). For labeling, free-floating slices were incubated with 5% donkey or goat serum to block nonspecific antibody reaction in 0.2% Triton X-100 PBS. After several rinses with PBS, the slices were incubated overnight with primary antibodies: dopamine receptor 3 (D3R) (Santa Cruz; 1:200), dopamine transporter [laboratory of George Uhl, National Institute of Drug Abuse, National Institutes of Health/Department of Health and Human Services, Baltimore, MD (Freed et al., 1995); 1:200], vesicular monoamine transporter 2 (VMAT2) (Santa Cruz; 1:500), mouse calbindin (Sigma; 1:1000), and guinea pig calbindin (laboratory of Masahiko Watanabe, Hokkaido University School of Medicine, Sapporo, Japan; 1:1000). After several rinses with PBS, the slices were then incubated with the secondary antibodies: Alexa Fluor 488- or 546-conjugated secondary antibodies to rabbit, mouse, goat, or guinea pig (Jackson ImmunoResearch) at a dilution of 1:500. The images were acquired using a LSM Pascal laser-scanning confocal microscope (Zeiss) with a 40× water-immersion objective and a conventional wide-field fluorescence microscope (Nikon) with a 4× objective. Wide-field microscope images were tiled using Photoshop (Adobe Systems) or Powerpoint (Microsoft) to produce a mosaic image showing an entire sagittal cerebellar section. Compartmental analysis of immunofluorescent images (supplemental Fig. 1, available at www.jneurosci.org as supplemental material) was performed using ImageJ software (NIH).
Ca imaging.
For depolarization-evoked Ca transient imaging, 0.3 mm Fluo-5F (Kd = 2.3 μm) was added in the pipette solution to measure Ca transients using green-emitted light, and 0.3 mm Alexa 594 hydrazide, a cytosolic marker, was added to visualize the soma and dendrite using red-emitted light (both dyes from Invitrogen). To allow for dye diffusion, 15 min elapsed between whole-cell access and the beginning of imaging. To minimize phototoxicity, 0.1 mm Trolox-C was added to ACSF and the power and exposure time of laser illumination were maintained as low as possible. Single-photon Ca imaging was performed with a Zeiss Pascal confocal microscope, using the 488 nm line of an argon laser for excitation of Fluo-5F and a 505 nm long-pass filter to detect the emission of green fluorescence. Ca transients were elicited by 10-ms-long depolarizing steps to 0 mV, delivered at 1 min intervals. Alexa 594 hydrazide was excited with the 543 nm line of a He–Ne laser, and the emitted red fluorescence was collected through a 560 nm long-pass filter. Fluo-5F images were recorded in frame-scan mode with a 128 × 33 pixel region of interest at 20 Hz. For analysis, foreground pixels were determined by thresholding the image, and were spatially averaged to calculate ΔF/F0 for each frame. Background correction was performed by subtracting the background fluorescence of a region next to the soma, proximal dendrite, or distal dendrite. Ca signal amplitudes were expressed as (Ft − F0)/F0. The average fluorescence intensity in the baseline period was taken as F0. Image J (NIH) was used to analyze Ca imaging data using a custom macro.
Results
If dendritic release of dopamine and autocrine activation of dopamine receptors occur in cerebellar Purkinje cells, then the molecular machinery to synthesize, package, detect, and reuptake dopamine should be expressed in these cells. Previous immunohistochemical work has shown that the obligate dopamine synthetic enzyme, tyrosine hydroxylase, is expressed in the soma and proximal dendrites of Purkinje cells from adult mouse (Fujii et al., 1994) and rat (Takada et al., 1993). Tyrosine hydroxylase expression has also been found in young adult mouse Purkinje cells at the mRNA level (Lein et al., 2007). However, not all cerebellar lobules showed tyrosine hydroxylase expression in Purkinje cells: it was restricted to the posterior portion of the cerebellum, with intermittent expression in lobules VI and VII and stronger expression in lobules VIII–X.
Immunoreactivity for dopamine D5 receptors was expressed in Purkinje cells dendrites from adult human and rat tissue (Khan et al., 2000), although comparison of anterior and posterior regions of the cerebellum was not performed. In addition, immunoreactivity for D2, D3, and D4 receptors was detected in adult rat Purkinje cell somata (Khan et al., 1998). In this study, D3 receptor immunoreactivity clearly outlined Purkinje cell dendrites while there was little D4 signal and strong but diffuse D2 signal in the cerebellar molecular layer. Other groups have reported D3 receptor immunoreactivity (Barili et al., 2000), mRNA, and binding of the D3-preferring agonist 7-OH-DPAT enriched in Purkinje cells of lobules IX and X (Diaz et al., 1995).
We used floating-section fluorescence immunohistochemistry to detect a number of proteins involved in dopamine signaling. This was done using cerebellar slices that were age matched to those used in subsequent electrophysiological experiments. Immunoreactivity for the D3 type dopamine receptor was detected as somatodendritic punctate staining of Purkinje cells (Fig. 1A,B). While not identical to the distribution of tyrosine hydroxylase, D3 receptors also showed much stronger expression in the posterior cerebellum, particularly in the gyrus region of lobules IX and X. We used striatal tissue as a positive control, and this showed strong D3 receptor immunoreactivity. Sections of cerebellum and striatum that were processed without exposure to the primary antibody showed very low background levels of immunoreactivity (Fig. 1B).
Figure 1.
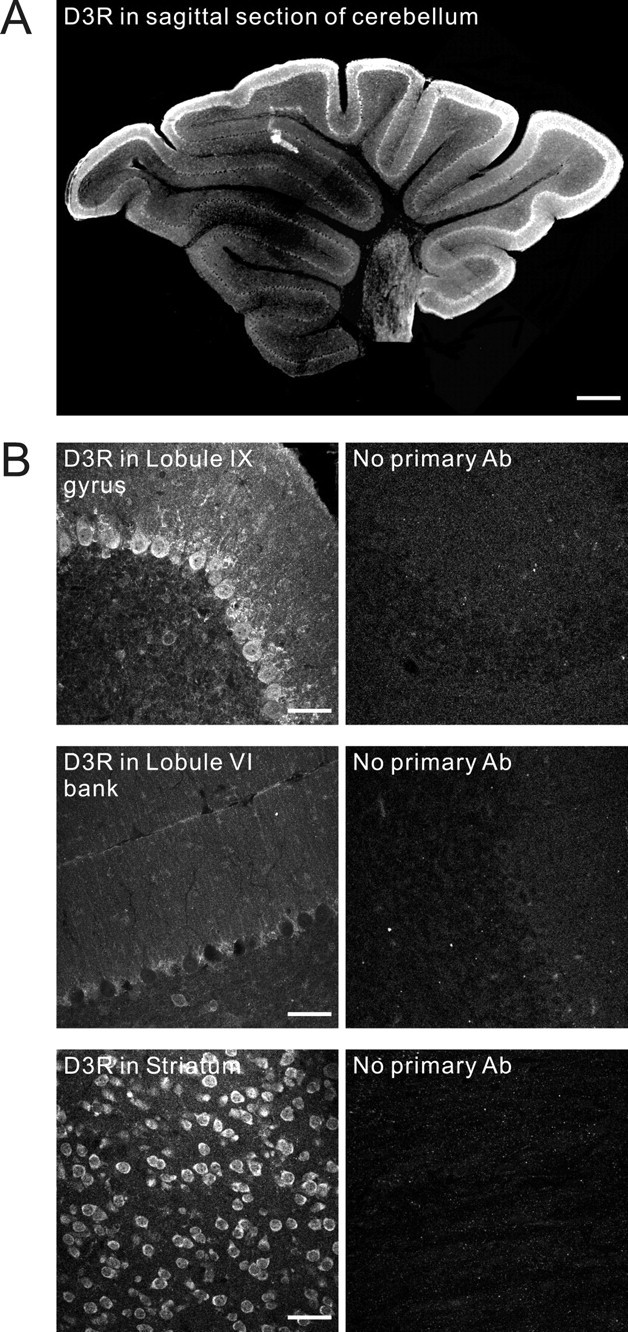
Dopamine D3 receptor expression in sagittal slices of young mouse cerebellum. A, Immunohistochemistry using antibodies directed against the dopamine D3 receptor was performed in sagittal slices of cerebellar vermis. Low-power wide-field fluorescence images (4× objective) were tiled to show the entire cerebellar slice. D3 receptors showed much stronger expression in the posterior cerebellum, particularly in the gyri of lobules IX and X, and weaker expression in anterior lobules, such as lobules V and VI, particularly in the bank and sulcus regions. B, Left panels, Representative confocal images from different subregions are shown. Strong immunoreactivity for D3R was seen in the Purkinje cells located in the gyrus region of lobule IX, and weaker immunoreactivity was seen in these structures in the bank region of the more anterior lobule VI. Striatal tissue, used here as a positive control, showed strong somatic D3 receptor immunoreactivity. Right panels are without incubation of primary antibody (Ab) and showed very low background levels of immunoreactivity. Scale bars: A, 400 μm; B, 50 μm.
This local enrichment of dopamine signaling proteins was also apparent using antibodies directed against the dopamine transporter (DAT) and VMAT2. Figure 2 shows strong immunoreactivity for DAT in the primary and secondary dendrites of Purkinje cells in the gyrus of lobule IX and much weaker immunoreactivity in these structures in the bank and sulcus regions of lobule VI. VMAT2 immunoreactivity was observed as small diffuse puncta in the Purkinje cell layer and throughout the molecular layer where the Purkinje cells dendrites reside. As with the other markers, it was strongly enriched in the lobule IX gyrus compared with the lobule VI bank region. However, it is likely that this molecular layer staining reflects VMAT2 expression that is not restricted to Purkinje cell dendrites. Purkinje cell dendritic outlines could not be clearly discerned by the pattern of these puncta. Double labeling for a Purkinje cell marker (calbindin) and VMAT2 showed some VMAT2 puncta that overlapped Purkinje cell dendrites but others that did not (data not shown). The latter may represent previously described dopaminergic innervation of the cerebellum by cells of the ventral tegmental area (Melchitzky and Lewis, 2000).
Figure 2.
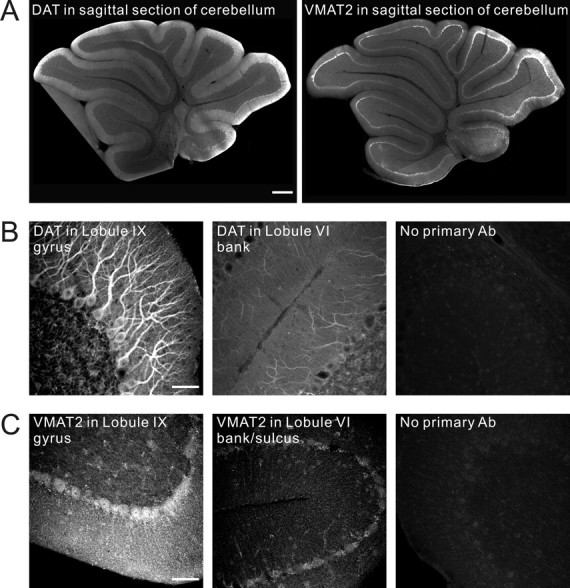
Immunohistochemistry in young mouse cerebellum reveals DAT and VMAT2 staining of Purkinje cells. A, Low-power wide-field fluorescence images (4× objective) were tiled to show the entire cerebellar slice. Posterior zone enrichment of dopamine signaling proteins was apparent using antibodies directed against DAT and VMAT2. DAT and VMAT2 showed stronger expression in the posterior cerebellum, particularly in the gyrus region of lobule IX and weaker expression in the bank and sulcus regions of lobules V and VI. B, Confocal images reveal strong immunoreactivity for DAT in the primary and secondary dendrites of Purkinje cells in the gyrus region of lobule IX and weaker immunoreactivity in these structures in the bank region of lobule VI. C, VMAT2 immunoreactivity was observed as small diffuse puncta in the Purkinje cell layer and throughout the molecular layer where the Purkinje cells dendrites reside. It was strongly enriched in the lobule IX gyrus region compared with the lobule VI bank/sulcus region. Ab, Antibody. Scale bars: A, 400 μm; B, C, 50 μm.
To quantify regional differences in these dopamine signaling molecules, we analyzed wide-field fluorescence images to determine the mean pixel intensity in the lobule V bank region and the lobule IX gyrus region (supplemental Fig. 1, available at www.jneurosci.org as supplemental material). These regions were further subdivided to separately measure the Purkinje cell layer and the molecular layer. This revealed that D3R and DAT immunoreactivity were similar in Purkinje cell and molecular layers and that both of these markers were reduced in lobule V bank compared with lobule IX gyrus of the same cerebellar slice. VMAT2 immunoreactivity was also higher in lobule IX gyrus compared with the lobule V bank, but this difference was most apparent in the Purkinje cell layer rather than the molecular layer.
It appears that several different molecules involved in dopamine signaling are enriched in Purkinje cells of the gyrus region of lobules IX and X. If dopamine signaling is required for the expression of DISC, then perhaps DISC would also be enriched in these areas. To test this idea, recordings were made from Purkinje cells in different cerebellar regions: lobules II and III, lobules V and VI, and lobules IX and X (Fig. 3A,B). Many cells were recorded from the same brain slice and the population of cells in these three different groups was matched for age and mediolateral position within the cerebellar vermis. Analysis of these currents reveals a striking difference: while 94% of the Purkinje cells in lobules IX and X showed substantial DISC (defined as peak current >100 pA), this value was only 11% in lobules V and VI and 22% in lobules II and III. Furthermore, when the current density of DISC was calculated (the mean ± SEM of peak DISC amplitude for those cells with DISC >100 pA), this showed a current density of 13.28 ± 2.93 pA/pF for lobules II and III, 13.60 pA/pF for lobules V and VI, and 54.02 ± 7.78 pA/pF for lobules IX and X (n = 4, n = 2, n = 33, respectively) (Fig. 3C). Thus, DISC is indeed strongly enriched in the posterior cerebellum, where dopamine signaling molecules are most strongly expressed. All subsequent recordings were made from Purkinje cells in cerebellar lobule IX.
Figure 3.

Whole-cell patch-clamp recordings from Purkinje cells in different lobules and subregions reveal local DISC enrichment. A, A diagram of the cerebellar sagittal slice with recording electrodes. Recordings were made from Purkinje cells in different cerebellar regions: lobules II and III (gyrus and bank regions), lobules V and VI (bank regions), and lobules IX and X (gyrus and bank regions). The red shading indicated those areas in which DISC recordings were obtained. B, Representative single-current traces from different lobules are shown, together with high-pass-filtered traces to reveal the noise envelope. The noise envelope allows for the dissociation of DISC from the earlier Cl current. Calibration: 200 pA, 2 s for current traces. A range of −30 to 30 pA was used to depict the high-pass-filtered noise envelope. C, Population analysis of DISC in various lobules. The left panel shows the proportion of cells with DISC >100 pA. The right panel shows the current density of DISC, normalized to cell capacitance and calculated only for those currents >100 pA.
To provide a more direct test of the dopamine hypothesis of DISC, a panel of dopamine receptor antagonists was bath applied (Fig. 4). These included haloperidol (100 μm) and clozapine (100 μm), which are broad-spectrum dopamine receptor antagonists, eticlopride (10 μm), which is D2/D3 receptor preferring, and SCH23390 (10 μm), which is D1/D5 receptor preferring. The ratio of DISC charge transfer at 40 min to that at 20 min after achieving the whole-cell configuration was used as an index of drug action. The broad-spectrum antagonists produced strong blockade of DISC (haloperidol: 0.11 ± 0.03, n = 5, p < 0.001 compared with control; clozapine: 0.18 ± 0.06, n = 5, p < 0.001), while the selective antagonists (Momiyama et al., 1996) produced partial attenuation (eticlopride: 0.56 ± 0.07, n = 5; p < 0.05; SCH23390: 0.81 ± 0.01, n = 5; not significant). At these concentrations, the D2/D3-preferring antagonist eticlopride was more effective. However, when concentrations of these drugs were increased to levels at which they are likely to block additional dopamine receptor subtypes, both produced near-complete blockade of DISC (eticlopride, 50 μm, 0.07 ± 0.01, n = 5, p < 0.001; SCH23390, 50 μm, 0.06 ± 0.01, n = 5, p < 0.001; not shown in the figure). These results imply that dopamine receptor activation is required for DISC. They do not prove that the dopamine receptors involved are expressed on the Purkinje cell, although that is the most parsimonious observation. The pharmacological profile seen here does not allow us to implicate a single subtype of dopamine receptor in DISC (recall that Purkinje cells in lobule IX have been suggested to express D2, D3, D4, and D5 receptors).
Figure 4.
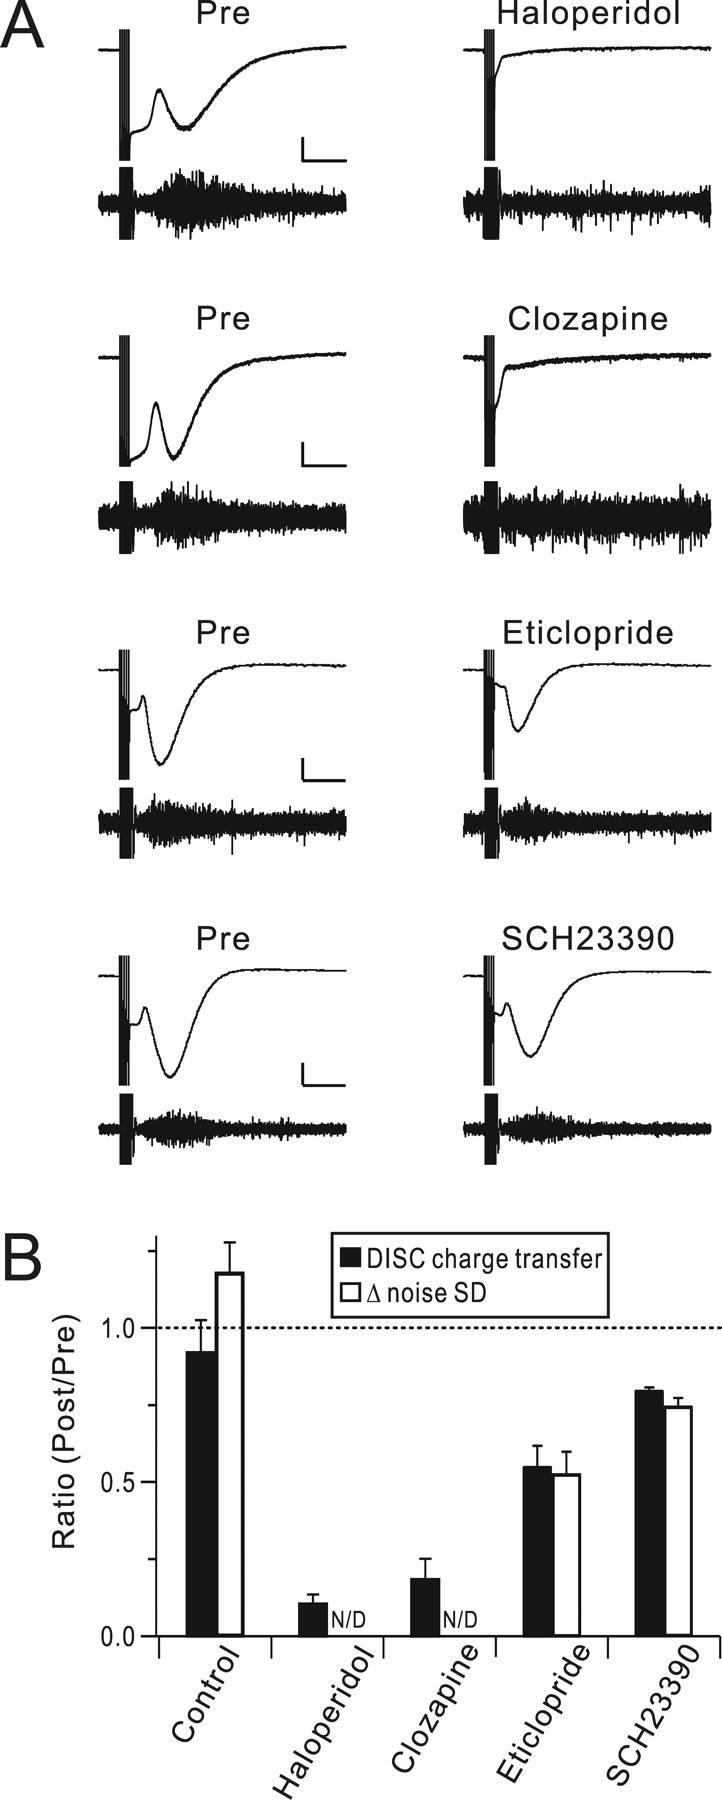
Dopamine receptor activation is required for DISC. A, A set of dopamine receptor antagonists was bath applied and representative DISC traces and Δ noise SD are shown immediately before (Pre) and 20 min after drug application. Haloperidol (100 μm) and clozapine (100 μm) are broad-spectrum inhibitors of dopamine receptors. Eticlopride (10 μm) is a selective inhibitor of D2/D3 receptors and SCH23390 (10 μm) is a selective inhibitor of D1/D5 receptors. Calibration: 200 pA, 2 s. A range of −25 to 25 pA was used for the high-pass-filtered noise envelope. B, Population analysis of dopamine receptor antagonists. The averages of either DISC charge transfer (filled bars) or Δ noise SD (open bars) are plotted as a ratio of measurements immediately before and 20 min after drug application. Clozapine and haloperidol produced baseline changes in noise, which made calculation of the Δ noise SD uninformative.
If DISC requires vesicular dopamine release, then it should be attenuated by inhibitors of VMAT, the transporter responsible for loading cytoplasmic dopamine into vesicles. Indeed, bath application of the VMAT inhibitors reserpine (10 μm) or tetrabenazine (50 μm) produced significant blockade of DISC (0.12 ± 0.04, n = 5, p < 0.001; 0.21 ± 0.06, n = 5, p < 0.001, respectively) (Fig. 5). When reserpine was added to the internal saline at a concentration of 30 μm, DISC showed significant rundown over a 20 min monitoring period (0.11 ± 0.14, n = 5, p < 0.001) suggesting that VMAT within the Purkinje cell is required for DISC. In addition to de novo synthesis, dopamine reuptake is also a source of cytoplasmic dopamine, which can in turn be loaded into vesicles. Two inhibitors of the plasma membrane DAT, which is responsible for this cytoplasmic loading, GBR12909 (20 μm) and rimcazole (50 μm), also strongly attenuated DISC when bath applied (0.07 ± 0.02, n = 5, p < 0.001; 0.13 ± 0.03, n = 5, p < 0.001, respectively).
Figure 5.

Application of VMAT inhibitors and dopamine transporter inhibitors produces strong attenuation of DISC. A, A set of drugs was bath applied, and representative DISC and Δ noise SD traces are shown immediately before (Pre) and 20 min after drug application. Reserpine was also applied in the internal saline (int.), and current rundown over a period of 20 min was measured. Calibration: 200 pA, 2 s for current traces. A range of −25 to 25 pA was used for the high-pass-filtered noise envelope. B, Population analysis of VMAT and dopamine transporter inhibitors effects on DISC. The average ratios of DISC charge transfer (filled) and Δ noise SD (open) are plotted immediately before and 20 min after drug application.
DAT inhibitors could act by reducing the amount of dopamine available for vesicular uptake and subsequent release. Alternatively, prolonged incubation with DAT inhibitors might result in the desensitization of dopamine receptors through an increase in the ambient concentration of dopamine. Interestingly, application of DAT inhibitors produced a small transient increase in baseline current (measured 10 min after application), and this was dissipated or reversed 20 min after continued application (supplemental Fig. 2, available at www.jneurosci.org as supplemental material). This effect at 10 min might represent a period when extracellular dopamine has begun to accumulate, but dopamine receptor desensitization is incomplete.
Previous work has shown that DISC requires a depolarization-evoked Ca transient in the Purkinje cell (Shin et al., 2008). If the dopamine receptor antagonists, VMAT inhibitors or DAT inhibitors used herein had side effects on depolarization-evoked Ca transients, these could potentially underlie their effects on DISC. To address this concern, Purkinje cells were loaded with the Ca indicator Fluo-5F and laser-scanning confocal microscopy was used to measure depolarization-evoked Ca transients in Purkinje cell dendrites. The depolarizing step (−70→0 mV for 10 ms) was the same as the unitary stimulus used for DISC induction, and it produced a robust Ca transient in a region of interest comprised of primary, secondary, and tertiary dendrites and dendritic spines (Fig. 6A,B) similar to that previously reported in rat Purkinje cells (Shin et al., 2008). A representative set of bath-applied drugs was chosen for the screen and was applied for 20 min to mimic their use in DISC experiments. None of these compounds produced significant attenuation of depolarization-evoked Ca transients, arguing against this side effect as an explanation for their strong attenuation of DISC (0.94 ± 0.03, n = 5 for clozapine; 0.93 ± 0.13, n = 5 for eticlopride; 0.94 ± 0.10, n = 5 for SCH23390; 0.97 ± 0.03, n = 5 for reserpine; 0.98 ± 0.03, n = 5 for GBR12909).
Figure 6.
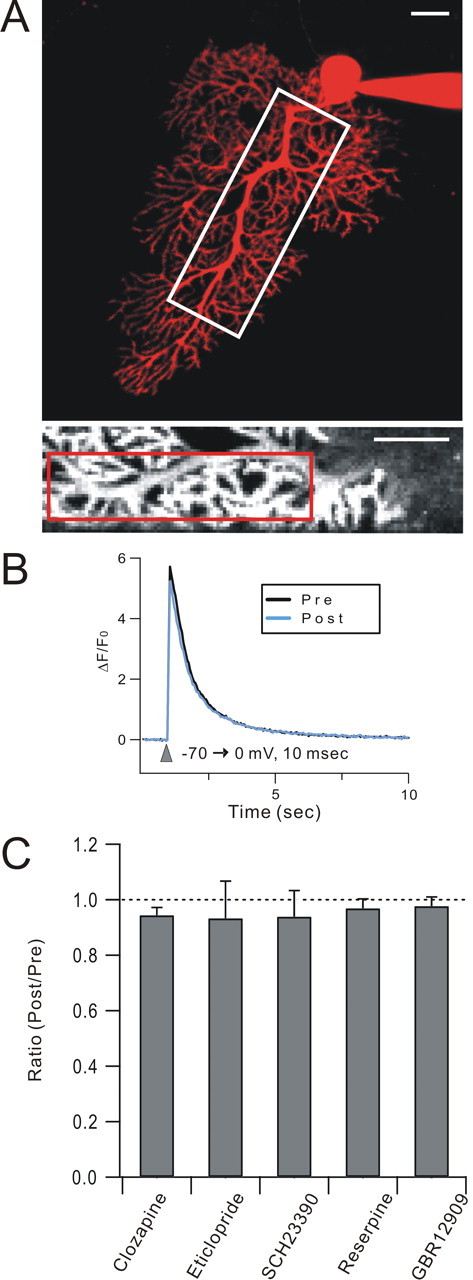
Depolarization-evoked Ca transients are not affected by DISC-attenuating drugs. A, Purkinje cells were loaded with both Fluo-5F, a Ca indicator, and Alexa Fluor 594 hydrazide, a cytosolic marker, and laser-scanning confocal microscopy was used to measure depolarization-evoked Ca transients in Purkinje cell dendrites. The top panel shows a projected z-stack confocal image of a Purkinje cell filled with Alexa Fluor 594. The bottom panel corresponds to the white box in the top panel and shows the Fluo-5F signal (at the Ca transient peak). The red box within the inset shows the region of interest used for Ca transient measurement. Scale bars: 20 μm for both top and bottom panels. B, Exemplar single unaveraged Ca traces. The depolarizing step (−70→0 mV for 10 ms) was the same as that used for DISC induction. Ca transients (measured as ΔF/F0) were plotted before (black; Pre) and after (blue; Post) the application of drugs. C, A representative set of bath-applied drugs was chosen for the screen and was applied for 20 min to mimic their use in DISC experiments. Clozapine (100 μm), eticlopride (50 μm), SCH23390 (50 μm), reserpine (30 μm), and GBR 12909 (20 μm) were used. Note that these are the higher, nonselective doses of eticlopride and SCH23390. N = 5 cells/group.
If dopamine receptor activation were required for DISC, then exogenous dopamine receptor agonist would be expected to produce an inward current that would occlude DISC in Purkinje cells. Bath application of dopamine (400 μm) produced an increase in holding current with the Purkinje cell clamped at a command potential of −70 mV, and this increase reversed upon washout (Fig. 7). This increase by dopamine was 222 ± 46.9 pA (Δ holding current, n = 5, p < 0.005). Dopamine application also attenuated DISC current, and this attenuation showed partial washout (0.29 ± 0.05, n = 5, p < 0.001).
Figure 7.
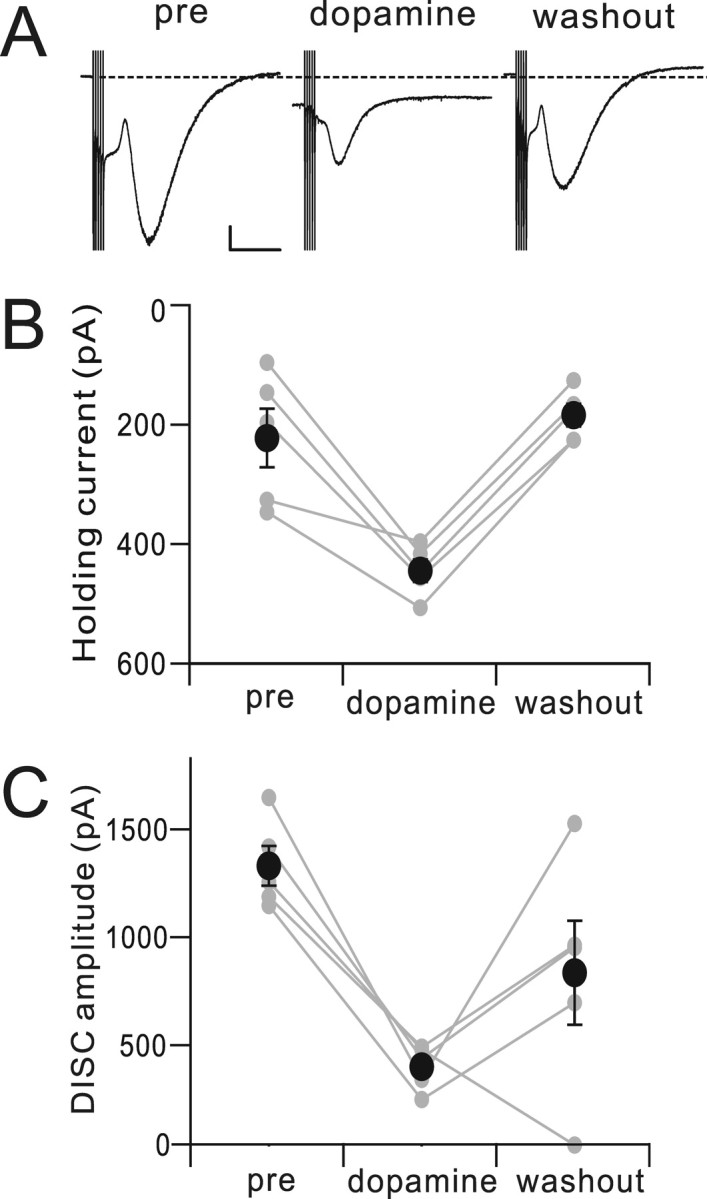
Bath application of dopamine produces a standing inward current that partially occludes DISC. A, Representative DISC current traces, immediately before (pre), 15 min after bath application of dopamine, and 30 min after bath application of dopamine. The dotted line indicates the baseline current level in the predopamine condition. Calibration: 200 pA, 2 s. B, Bath application of dopamine produced an increase in holding current with the Purkinje cell clamped at a command potential of −70 mV, and this increase reversed upon washout. Linked gray dots show five individual cells, and the black dots show the mean ± SEM. C, Dopamine application also attenuated DISC current, and this attenuation showed partial washout.
Chemical inhibitors of DAT strongly attenuated DISC current when bath applied for ∼20 min (Fig. 5), and this attenuation is unlikely to be a side effect of inhibiting depolarization-evoked Ca transients (Fig. 6). As a complementary method of assessing DAT function, we prepared cerebellar slices from DAT-null mice (Fig. 8). DISC was measured soon after achieving a stable whole-cell recording configuration (designated as t = 0 min) and was continued for 25 additional minutes. When DISC amplitude was measured at t = 0 min, no significant differences were seen between DAT−/−, DAT+/+, and DAT+/− Purkinje cells (872.83 ± 52.76 pA; 1041.04 ± 95.30 pA; 1200.52 ± 150.83 pA, ns, respectively). However, when recordings were continued until t = 25 min, DAT−/− Purkinje cells showed a significantly greater degree of DISC rundown (0.43 ± 0.12, n = 15, compared with 0.85 ± 0.07, n = 10 for DAT+/+ cells, p < 0.005). This is consistent with the hypothesis that DAT-mediated dopamine reuptake is required to support continued dopamine release in DISC.
Figure 8.

Dopamine transporter-null Purkinje cells express normal initial DISC, but this DISC runs down quickly. DISC was measured after achieving a stable whole-cell recording configuration (designated at t = 0 min) and was continued for 25 additional min. For each genotype, gray dots show individual cells and the black dots show the mean ± SEM. The left panel expresses DISC as raw amplitude, whereas the right panel shows DISC amplitude at t = 25 min, normalized to that at t = 0 min. NS, Not significant; Norm., normalized.
Discussion
There are several main findings of the present study. First, DISC is strongly enriched in Purkinje cells of the posterior cerebellum, particularly the gyrus region of lobules IX and X (Fig. 3). This spatial pattern correlates with enriched expression in the posterior cerebellum of a group of proteins involved in dopamine signaling including D3 dopamine receptors (Fig. 1), DAT, and VMAT2 (Fig. 2). The present immunocytochemical results are consistent with previous reports of posterior cerebellar enrichment of tyrosine hydroxylase (Lein et al., 2007) and D3 receptors (Diaz et al., 1995; Barili et al., 2000). Second, DISC is strongly attenuated by four different drugs that antagonize dopamine receptors (Fig. 4), two drugs that inhibit VMAT2 and two other drugs that inhibit DAT (Fig. 5). These compounds do not appear to attenuate DISC through a side effect on depolarization-evoked Ca signals (Fig. 6). Third, dopamine mimicked and occluded DISC current (Fig. 7). And, finally, while initial DISC amplitude appeared normal in Purkinje cells derived from DAT−/− mice, DISC rundown with repeated stimulation was significantly larger in DAT−/− than in DAT+/+ or DAT+/− cells.
These results suggest a model in which a strong depolarization of Purkinje cells in the posterior cerebellum triggers somatodendritic fusion of dopamine-containing vesicles. This dopamine then diffuses and acts in autocrine manner to bind Purkinje cell dopamine receptors and gates a cation conductance underlying DISC. Dopamine vesicles are refilled from a cytoplasmic pool that is a mixture of newly synthesized dopamine and dopamine reuptake via forward operation of DAT.
Dopamine receptors are all 7-transmembrane domain G-protein-coupled receptors, but they fall into two classes: D1-like receptors, consisting of D1 and D5, are Gs coupled and are linked to activation of adenylyl cyclase. D2-like receptors, consisting of D2, D3, and D4, are Gi/o coupled and are linked to inhibition of adenylyl cyclase. Both D1-like and D2-like receptors also have biochemical effects that are independent of adenylyl cyclase. As previously mentioned, Purkinje cells have been reported to express a variety of dopamine receptors: D3 and D5 are expressed strongly and label the dendrites, while D2 and D4 are expressed more weakly (Khan et al., 1998, 2000). Neither this distribution pattern nor the pharmacology of the four antagonist drugs used herein allows us to definitively implicate a particular subtype of dopamine receptor in DISC.
Using slices of substantia nigra, Falkenburger et al. (2001) showed that both the extracellular dopamine transient (measured with carbon fiber amperometry) and the consequent autoinhibition of dopamine neurons (measured with patch clamp recording) were blocked by application of DAT inhibitor drugs, including GBR 12909. They suggested that dopamine release from these cells was mediated by reversed operation of DAT, not vesicular fusion. In our experiments, we have shown that DAT inhibitors applied for 20 min attenuate DISC. Might reversed DAT action mediate DISC? We think that this is unlikely for two reasons. First, initial DISC was intact in DAT−/− Purkinje cells (although it ran down more quickly). Second, DISC was strongly attenuated by two different VMAT2 inhibitors, reserpine (applied either internally or externally) and tetrabenazine. Reverse DAT-mediated dopamine release would not be expected to be attenuated by these VMAT inhibitor drugs.
One caveat that should be sounded is that bath application of drugs does not allow us to specify their locus of action. Therefore, it is formally possible that, despite the immunohistochemical evidence showing cerebellar cortex dopamine receptors mostly in Purkinje cells, the relevant dopamine receptors for DISC are located on other cells (Bergmann glia, interneurons, parallel fibers). The observation that the VMAT inhibitor reserpine blocks DISC with internal application argues for the Purkinje cell as a source of dopamine. Another caveat is that while dopamine signaling appears necessary for DISC, it is not entirely clear that it is sufficient. It is possible that dopamine receptors must act in concert with other molecular machinery to evoke DISC.
Neurotransmitters and neuromodulators released from postsynaptic compartments can either act in a retrograde manner, on presynaptic elements, or in an autocrine manner, on postsynaptic targets. In both cases, these signals are typically triggered by postsynaptic Ca transients and can take three general forms. One involves the Ca-triggered synthesis and subsequent immediate diffusion of gases (such as NO and CO) or lipid metabolites (such as endocannabinoids or 20-HETE). In Purkinje cells, strong depolarization results in postsynaptic endocannabinoid release that acts in a retrograde manner to ligate CB1 receptors on the presynaptic terminals of both excitatory, glutamatergic parallel fibers and GABAergic inhibitory molecular layer interneurons. This produces a short-term (1–2 min long) attenuation of neurotransmitter release called depolarization-induced suppression of excitation (DSE) (Kreitzer and Regehr, 2001a; Maejima et al., 2001) and depolarization-induced suppression of inhibition (DSI) (Kreitzer and Regehr, 2001b; Diana et al., 2002), respectively.
Another form involves Ca-triggered vesicular fusion, and a third uses reverse action of plasma membrane transporters. Neurotransmitters shown to be released from somatodendritic compartments in response to postsynaptic activity by Ca-triggered vesicular fusion include dopamine [in the substantia nigra and ventral tegmental area (Smith and Kieval, 2000)], oxytocin and vasopressin [in the hypothalamus (Ludwig and Pittman, 2003)], GABA [in the olfactory bulb (Isaacson, 2001)], and glutamate [in the olfactory bulb (Salin et al., 2001), neocortex (Zilberter, 2000), and cerebellum (Duguid and Smart, 2004; Duguid et al., 2007)]. In cerebellar Purkinje cells, glutamate released from Purkinje cells dendrites has been suggested to ligate both NMDA receptors on interneuron terminals, underlying DPI (Duguid and Smart, 2004; Duguid et al., 2007) and kainate receptors on parallel fiber terminals (Crepel, 2007; Crepel and Daniel, 2007). The relationship between these various retrograde signals in Purkinje cells and DISC remains unclear. It will be interesting to determine whether DSE, DSI, and DPI also show lobule dependence as observed herein.
There are several avenues for future work on DISC. First, it will be important to identify the ion channel or channels underlying the DISC conductance and to determine whether these channels can be gated by dopamine receptor activation. Second, use of Purkinje cell-specific Cre recombinase mouse lines combined with floxed dopamine receptors, VMAT2, and other molecules will allow for a more rigorous test of the hypothesis that these molecules function within the Purkinje cell to underlie DISC. Third, and perhaps most importantly, will be to understand the consequences of the DISC conductance for cerebellar network function and, possibly, plasticity.
Footnotes
This work was supported by National Institutes of Health (NIH) Grants MH51106 and MH084020 and in part by intramural funding from the National Institute on Drug Abuse, NIH/Department of Health and Human Services (F.S.H.). We thank Dr. Masahiko Watanabe for the calbindin antibody. We also thank members of the laboratory of D.J.L. for creative and useful suggestions. Y.S.K. especially thanks Christopher Kim from his heart. DAT-null mice and DAT antibody were a generous gift from Dr. George Uhl.
References
- Barili P, Bronzetti E, Ricci A, Zaccheo D, Amenta F. Microanatomical localization of dopamine receptor protein immunoreactivity in the rat cerebellar cortex. Brain Res. 2000;854:130–138. doi: 10.1016/s0006-8993(99)02306-9. [DOI] [PubMed] [Google Scholar]
- Cossette M, Lévesque D, Parent A. Neurochemical characterization of dopaminergic neurons in human striatum. Parkinsonism Relat Disord. 2005;11:277–286. doi: 10.1016/j.parkreldis.2005.02.008. [DOI] [PubMed] [Google Scholar]
- Crepel F. Developmental changes in retrograde messengers involved in depolarization-induced suppression of excitation at parallel fiber-Purkinje cell synapses in rodents. J Neurophysiol. 2007;97:824–836. doi: 10.1152/jn.00735.2006. [DOI] [PubMed] [Google Scholar]
- Crepel F, Daniel H. Developmental changes in agonist-induced retrograde signaling at parallel fiber-Purkinje cell synapses: role of calcium-induced calcium release. J Neurophysiol. 2007;98:2550–2565. doi: 10.1152/jn.00376.2007. [DOI] [PubMed] [Google Scholar]
- Diana MA, Levenes C, Mackie K, Marty A. Short-term retrograde inhibition of GABAergic synaptic currents in rat Purkinje cells is mediated by endogenous cannabinoids. J Neurosci. 2002;22:200–208. doi: 10.1523/JNEUROSCI.22-01-00200.2002. [DOI] [PMC free article] [PubMed] [Google Scholar]
- Diaz J, Lévesque D, Lammers CH, Griffon N, Martres MP, Schwartz JC, Sokoloff P. Phenotypical characterization of neurons expressing the dopamine D3 receptor in the rat brain. Neuroscience. 1995;65:731–745. doi: 10.1016/0306-4522(94)00527-c. [DOI] [PubMed] [Google Scholar]
- Duguid IC, Smart TG. Retrograde activation of presynaptic NMDA receptors enhances GABA release at cerebellar interneuron-Purkinje cell synapses. Nat Neurosci. 2004;7:525–533. doi: 10.1038/nn1227. [DOI] [PubMed] [Google Scholar]
- Duguid IC, Pankratov Y, Moss GW, Smart TG. Somatodendritic release of glutamate regulates synaptic inhibition in cerebellar Purkinje cells via autocrine mGluR1 activation. J Neurosci. 2007;27:12464–12474. doi: 10.1523/JNEUROSCI.0178-07.2007. [DOI] [PMC free article] [PubMed] [Google Scholar]
- Falkenburger BH, Barstow KL, Mintz IM. Dendrodendritic inhibition through reversal of dopamine transport. Science. 2001;293:2465–2470. doi: 10.1126/science.1060645. [DOI] [PubMed] [Google Scholar]
- Freed C, Revay R, Vaughan RA, Kriek E, Grant S, Uhl GR, Kuhar MJ. Dopamine transporter immunoreactivity in rat brain. J Comp Neurol. 1995;359:340–349. doi: 10.1002/cne.903590211. [DOI] [PubMed] [Google Scholar]
- Fujii T, Sakai M, Nagatsu I. Immunohistochemical demonstration of expression of tyrosine hydroxylase in cerebellar Purkinje cells of the human and mouse. Neurosci Lett. 1994;165:161–163. doi: 10.1016/0304-3940(94)90734-x. [DOI] [PubMed] [Google Scholar]
- Glitsch M, Marty A. Presynaptic effects of NMDA in cerebellar Purkinje cells and interneurons. J Neurosci. 1999;19:511–519. doi: 10.1523/JNEUROSCI.19-02-00511.1999. [DOI] [PMC free article] [PubMed] [Google Scholar]
- Groves PM, Wilson CJ, Young SJ, Rebec GV. Self-inhibition by dopaminergic neurons. Science. 1975;190:522–528. doi: 10.1126/science.242074. [DOI] [PubMed] [Google Scholar]
- Isaacson JS. Mechanisms governing dendritic gamma-aminobutyric acid (GABA) release in the rat olfactory bulb. Proc Natl Acad Sci U S A. 2001;98:337–342. doi: 10.1073/pnas.021445798. [DOI] [PMC free article] [PubMed] [Google Scholar]
- Khan ZU, Gutiérrez A, Martín R, Peñafiel A, Rivera A, De La Calle A. Differential regional and cellular distribution of dopamine D2-like receptors: an immunocytochemical study of subtype-specific antibodies in rat and human brain. J Comp Neurol. 1998;402:353–371. doi: 10.1002/(sici)1096-9861(19981221)402:3<353::aid-cne5>3.0.co;2-4. [DOI] [PubMed] [Google Scholar]
- Khan ZU, Gutiérrez A, Martín R, Peñafiel A, Rivera A, de la Calle A. Dopamine D5 receptors of rat and human brain. Neuroscience. 2000;100:689–699. doi: 10.1016/s0306-4522(00)00274-8. [DOI] [PubMed] [Google Scholar]
- Kreitzer AC, Regehr WG. Retrograde inhibition of presynaptic calcium influx by endogenous cannabinoids at excitatory synapses onto Purkinje cells. Neuron. 2001a;29:717–727. doi: 10.1016/s0896-6273(01)00246-x. [DOI] [PubMed] [Google Scholar]
- Kreitzer AC, Regehr WG. Cerebellar depolarization-induced suppression of inhibition is mediated by endogenous cannabinoids. J Neurosci. 2001b;21:RC174. doi: 10.1523/JNEUROSCI.21-20-j0005.2001. [DOI] [PMC free article] [PubMed] [Google Scholar]
- Lein ES, Hawrylycz MJ, Ao N, Ayres M, Bensinger A, Bernard A, Boe AF, Boguski MS, Brockway KS, Byrnes EJ, Chen L, Chen L, Chen TM, Chin MC, Chong J, Crook BE, Czaplinska A, Dang CN, Datta S, Dee NR, et al. Genome-wide atlas of gene expression in the adult mouse brain. Nature. 2007;445:168–176. doi: 10.1038/nature05453. [DOI] [PubMed] [Google Scholar]
- Llano I, Leresche N, Marty A. Calcium entry increases the sensitivity of cerebellar Purkinje cells to applied GABA and decreases inhibitory synaptic currents. Neuron. 1991;6:565–574. doi: 10.1016/0896-6273(91)90059-9. [DOI] [PubMed] [Google Scholar]
- Ludwig M, Pittman QJ. Talking back: dendritic neurotransmitter release. Trends Neurosci. 2003;26:255–261. doi: 10.1016/S0166-2236(03)00072-9. [DOI] [PubMed] [Google Scholar]
- Maejima T, Hashimoto K, Yoshida T, Aiba A, Kano M. Presynaptic inhibition caused by retrograde signal from metabotropic glutamate to cannabinoid receptors. Neuron. 2001;31:463–475. doi: 10.1016/s0896-6273(01)00375-0. [DOI] [PubMed] [Google Scholar]
- Melchitzky DS, Lewis DA. Tyrosine hydroxylase- and dopamine transporter-immunoreactive axons in the primate cerebellum. Evidence for a lobular- and laminar-specific dopamine innervation. Neuropsychopharmacology. 2000;22:466–472. doi: 10.1016/S0893-133X(99)00139-6. [DOI] [PubMed] [Google Scholar]
- Momiyama T, Sim JA, Brown DA. Dopamine D1-like receptor-mediated presynaptic inhibition of excitatory transmission onto rat magnocellular basal forebrain neurones. J Physiol. 1996;495:97–106. doi: 10.1113/jphysiol.1996.sp021576. [DOI] [PMC free article] [PubMed] [Google Scholar]
- Perona MT, Waters S, Hall FS, Sora I, Lesch KP, Murphy DL, Caron M, Uhl GR. Animal models of depression in dopamine, serotonin, and norepinephrine transporter knockout mice: prominent effects of dopamine transporter deletions. Behav Pharmacol. 2008;19:566–574. doi: 10.1097/FBP.0b013e32830cd80f. [DOI] [PMC free article] [PubMed] [Google Scholar]
- Salin PA, Lledo PM, Vincent JD, Charpak S. Dendritic glutamate autoreceptors modulate signal processing in rat mitral cells. J Neurophysiol. 2001;85:1275–1282. doi: 10.1152/jn.2001.85.3.1275. [DOI] [PubMed] [Google Scholar]
- Shin JH, Kim YS, Linden DJ. Dendritic glutamate release produces autocrine activation of mGluR1 in cerebellar Purkinje cells. Proc Natl Acad Sci U S A. 2008;105:746–750. doi: 10.1073/pnas.0709407105. [DOI] [PMC free article] [PubMed] [Google Scholar]
- Shin JH, Kim YS, Linden DJ. Depolarization-induced slow current in cerebellar Purkinje cells does not require metabotropic glutamate receptor 1. Neuroscience. 2009. [DOI] [PMC free article] [PubMed]
- Smith Y, Kieval JZ. Anatomy of the dopamine system in the basal ganglia. Trends Neurosci. 2000;23:S28–33. doi: 10.1016/s1471-1931(00)00023-9. [DOI] [PubMed] [Google Scholar]
- Sora I, Wichems C, Takahashi N, Li XF, Zeng Z, Revay R, Lesch KP, Murphy DL, Uhl GR. Cocaine reward models: conditioned place preference can be established in dopamine- and in serotonin-transporter knockout mice. Proc Natl Acad Sci U S A. 1998;95:7699–7704. doi: 10.1073/pnas.95.13.7699. [DOI] [PMC free article] [PubMed] [Google Scholar]
- Takada M, Sugimoto T, Hattori T. Tyrosine hydroxylase immunoreactivity in cerebellar Purkinje cells of the rat. Neurosci Lett. 1993;150:61–64. doi: 10.1016/0304-3940(93)90108-w. [DOI] [PubMed] [Google Scholar]
- Tandé D, Höglinger G, Debeir T, Freundlieb N, Hirsch EC, François C. New striatal dopamine neurons in MPTP-treated macaques result from a phenotypic shift and not neurogenesis. Brain. 2006;129:1194–1200. doi: 10.1093/brain/awl041. [DOI] [PubMed] [Google Scholar]
- Zilberter Y. Dendritic release of glutamate suppresses synaptic inhibition of pyramidal neurons in rat neocortex. J Physiol. 2000;528:489–496. doi: 10.1111/j.1469-7793.2000.00489.x. [DOI] [PMC free article] [PubMed] [Google Scholar]