

Abstract
In adults, light to moderate alcohol consumption is associated with lower risks for heart disease, diabetes, and mortality. This study examined whether light to moderate alcohol use is also associated with lower risk of incident physical disability over two 5-year periods in 4,276 noninstitutionalized adults in the United States, aged 50 years or older, by using data from 3 waves of the National Health and Nutrition Examination Survey Epidemiologic Follow-up Study surveys from 1982 to 1992. Light/moderate drinking (<15 drinks per week and <5 per drinking day or 4 per drinking day for women) was associated with reduced risk for incident disability or death over 5 years, compared with abstention (adjusted odds ratio = 0.77; P = 0.008). Among survivors, light/moderate drinking was associated with lower risk for incident disability, compared with abstention (adjusted odds ratio = 0.75; P = 0.009). In stratified analyses, disability risk decreased with light/moderate drinking in a dose-dependent fashion in men and women with good or better self-reported health but not in men or women with fair or worse self-reported health. Alcohol consumption in moderation might reduce the risk of developing physical disability in older adults in good health but not in those in poor health.
Keywords: activities of daily living, alcohol drinking, longitudinal studies
More than 1 in 5 adults, aged 75 years or older, has some degree of physical disability, defined as difficulty carrying out daily activities (1). The link between alcohol consumption by older adults and the risk of becoming disabled is not clear (2), but light to moderate alcohol use by older adults is associated with lower mortality (3, 4), fewer cardiovascular events (5, 6), and less dementia (7) and diabetes (8). Although many studies suggest that, compared with abstinence, light to moderate alcohol use is associated with less (9–16), and heavy drinking with more, disability (9, 17–20), some studies have found no alcohol–disability association (2, 10, 21–23). However, most of these studies have been either cross-sectional or limited to a single follow-up period, and few adequately controlled for poorer outcomes in those who quit drinking because of poor health and for survival bias resulting from mortality associations with alcohol consumption. Many studies were restricted to single demographic groups; thus, some of the inconsistencies between studies may reflect true differences in the alcohol–disability association across demographic and health groups.
To address these gaps in the evidence base, we examined the association between alcohol consumption and the development of disability in a nationally representative, prospective cohort of US adults aged 50 years or older, using data from 3 waves of the National Health and Nutrition Examination Survey Epidemiologic Follow-up Study (NHEFS) surveys (1982–1984, 1987, and 1992).
MATERIALS AND METHODS
The NHEFS surveys were a series of 4 follow-up surveys in 1982–1984, 1986, 1987, and 1992 (24–27) to the First National Health and Nutrition Examination Survey (1971–1975) of a multistage, stratified, probability sample, representative of the US civilian, noninstitutionalized population, aged 1–74 years, with oversampling of people aged 65 years or older, those living in poverty, and women of childbearing age (24). NHEFS surveys collected self-reported information on alcohol use and physical functioning from face-to-face interviews in 1982–1984 and telephone interviews in later surveys. We examined the alcohol consumption level in 1982–1984 as a predictor of incident disability between 1982–1984 and 1987 (first period) and the alcohol consumption level in 1987 as a predictor of incident disability between 1987 and 1992 (second period).
Study sample
Of the 12,200 persons surveyed at the NHEFS 1982–1984 survey, 6,588 were 50 years or older at the time, and physical disability data were collected for 6,577 (99.8%). Only 3,871 of these individuals were free of disability and thus at risk for incident disability; 3,564 (92.1%) persons with complete alcohol and follow-up (year 1987) disability (or death) data contributed to the first period analyses (Figure 1). Of this group, 2,719 remained at risk for incident disability in the second period (i.e., they had not died or become disabled by the end of the first period) (Figure 1); 2,571 of them (94.6%) with follow-up disability (or death) data (in 1992) contributed to disability analyses in both the first and second periods.
Figure 1.
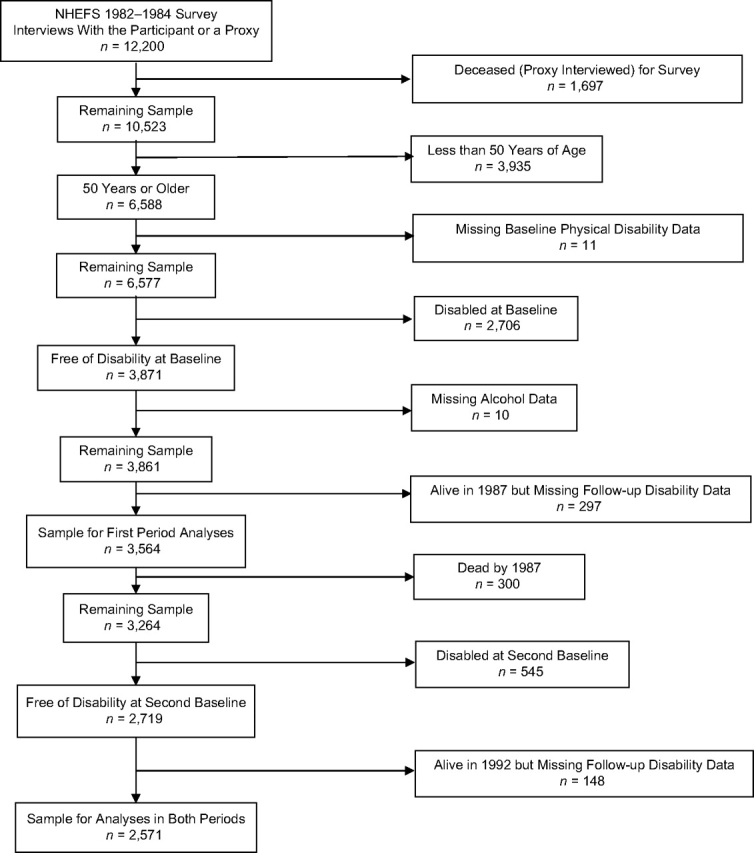
Flow diagram describing those in the study sample from the National Health and Nutrition Examination Survey Epidemiologic Follow-up Study (NHEFS) surveys cohorts who were 50 years of age or older in the 1982–1984 survey.
By the time of the NHEFS 1987 survey, an additional 1,286 participants had become 50 years of age or older, and physical disability data in 1987 were collected in 1,261 (98.1%). Only 989 of these individuals were free of disability and at risk for incident disability; 712 (72%) with complete alcohol and follow-up disability (or death) data (in 1992) were included in the second period analyses (Figure 2). Thus, our sample size was 4,276 with 3,564 in the first period analysis, 3,283 in the second period analysis, and 2,571 in the analyses for both periods.
Figure 2.

Flow diagram describing those in the study sample from the National Health and Nutrition Examination Survey Epidemiologic Follow-up Study (NHEFS) surveys cohorts who were less than 50 years of age in the 1982–1984 survey but were 50 years of age or older in the 1987 survey.
Alcohol variables
Study participants answered similar questions about quantity and frequency of alcohol use in each of the survey waves. We defined abstinence as consuming fewer than 12 drinks in the previous year, based on the definition used in the National Health Interview surveys (28). We wanted to use a clinically easy-to-use definition of light to moderate drinking and based our drinking categories on those suggested by the National Institute on Alcohol Abuse and Alcoholism (28). Accordingly, we calculated the number of drinks consumed per week (by multiplying the reported usual number of days per week that alcohol was consumed with the reported usual number of drinks per drinking day) to classify drinkers in 2 groups: Those who drank less than 15 drinks per week and less than 5 drinks per drinking day (4 per day for women) were classified as light to moderate drinkers, and those who drank 15 or more drinks per week or 5 or more drinks per drinking day (4 or more per day for women) were classified as heavy drinkers (29). Alcohol data in 1987 were missing and had to be imputed (by carrying forward 1982–1984 data) in 770 persons (23.8% of those contributing to period 2 analyses). We felt that such an imputation was justified because alcohol consumption patterns were fairly stable: In the 2,088 persons with alcohol data in both periods, 83% were in the same drinking group (abstainer, light to moderate drinker, heavy drinker) in the 2 periods. Because this imputation could have led to bias in our findings, we conducted a sensitivity analysis in which we reran the model after excluding these persons.
In the NHEFS 1982–1984 survey, alcohol consumption in previous years was ascertained. Using these data, we created a former drinker indicator variable to identify those who drank in the past (12 or more drinks in a prior year) but were currently abstinent, because older adults who discontinue drinking often do so because of a health condition (30) and are at increased risk for poor outcomes (31). The former drinker variable was created for both 1982–1984 and 1987.
Physical disability variables
Questions measuring physical disability were asked at each of the surveys by using the Stanford Health Assessment Questionnaire Disability Index (32). The index queries specific tasks representing 8 domains (dressing and grooming, personal hygiene, arising, eating, walking, gripping, reaching, and doing common daily errands and chores) with the following question structure: “Please tell me if you have no difficulty (0), some difficulty (1), much difficulty (2), or are unable to do these activities at all (3) when you are by yourself and without the use of aids.” We used 19 questions that were common to all survey periods (33) and created a binary global disability indicator: Indicator = 0 if all 19 responses were 0 (no difficulty), and indicator = 1 if the response on one or more of the items was 1 (some difficulty) or higher.
On the basis of our study inclusion criteria, everyone in the sample had disability indicator = 0 at baseline (the 1982–1984 survey for period 1 and the 1987 survey for period 2). Participants were defined as having incident disability over a period if their global disability indicator at the end of the period was 1.
In exploratory analyses, we also examined disability as a count of the number of functional domains (range, 0–8) in which the response was 1 (some difficulty) or higher, with the count at 1987 as the outcome for the first period and the count at 1992 as the outcome for the second period. By definition, everyone in the analytical sample had a disability count of zero at the start of the period.
Statistical analyses
The generalized estimating equations (GEE) method (34) was used to model the log odds of incident disability over a follow-up period as a function of alcohol consumption (3 categories: abstainer, light to moderate drinker, and heavy drinker) at the start of the period (1982–1984 alcohol assessment for period 1 and 1987 alcohol assessment for period 2), length of the follow-up period (since actual length of follow-up varied from period 1 to period 2 and from participant to participant), an indicator for period 1 versus period 2 (to model a period effect: a secular change in disability incidence from one time period to the next), and history of former drinking and other relevant covariates measured at the start of the period (NHEFS 1982–1984 survey for period 1 and NHEFS 1987 survey for period 2). We used an exchangeable correlation structure with GEE to account for correlation between repeated observations in the same individual (i.e., correlation between observations from periods 1 and 2 in participants who contribute to the analyses for both periods). All analyses were weighted by NHEFS sampling weights to make the results representative of the US civilian, noninstitutionalized population aged 50 years or older. The SAS procedure GENMOD (35) was used to implement GEE with empirically calculated standard errors by use of the Huber-White sandwich correction (36).
Selection of covariates for inclusion in the model was based on known associations with impairment of physical function and amount of alcohol consumption. The covariates in the model were as follows: 1) age (a linear term and a squared term); 2) gender; 3) race (white vs. other than white); 4) education (less than high school education vs. at least a high school education); 5) employment status (working vs. other); 6) annual income (less than the median $7,000 vs. at least $7,000); 7) marital status (married vs. other than married); 8) current smoking status (smoker vs. nonsmoker); 9) number of medical conditions (0, 1, 2, or 3 or more) reported by the subject (from a list of 13 conditions queried: high blood pressure, cancer, diabetes, stroke, heart failure/heart attack, hip fracture, arthritis, asthma/emphysema, liver disease, Parkinson's disease, seizure disorder, multiple sclerosis, and vision problems) as a single linear term; 10) incident myocardial infarction and stroke; 11) participation in regular exercise (yes/no); and 12) self-rated health (dichotomized as excellent, very good, or good vs. fair or poor).
To reduce residual confounding by covariate–covariate interactions, we also included preselected interaction terms in the GEE model, specifically, interactions between 1) age and gender, 2) marital status and gender, and 3) age and race. To test for effect modification by major demographic and health variables, we added alcohol interactions with gender and self-reported health one at a time to the model and conducted stratified analyses if significant alcohol interactions were found.
In sensitivity analyses, we reran the models after excluding the individuals with imputed alcohol variables in the second period and conducted analyses by using the disability count (range, 0–8) as outcome and Poisson regression with GEE for the purpose.
RESULTS
The mean age in the study sample was 60.4 years (range, 50–74 years), and the sample was 50% female and 92% white. Comparing the study sample (n = 4,276) with the rest of the cohort who met the age criterion and were not disabled at baseline but were excluded because of missing data (n = 584), we found that those in the study sample were slightly younger; more likely to be white, more educated, married, and working; and more likely to have higher income, to participate in regular exercise, and to report good health (Table 1).
Table 1.
Descriptive Statisticsa for the US Study Sample Compared With the Rest of the Cohort Aged 50 Years or Older Without Disability at Baseline (1982–1984 and 1987)
| Variables at Baselineb | Study Sample (n = 4,276) | Rest of Cohort (n = 584) | ||
| % | Mean (SD) | % | Mean (SD) | |
| Age, yearsc | 60.4 (8.5) | 61.0 (8.6) | ||
| Sex | ||||
| Male | 49.7 | 51.4 | ||
| Female | 50.3 | 48.6 | ||
| Racec | ||||
| White | 92.4 | 85.7 | ||
| Other | 7.6 | 14.3 | ||
| Educationc | ||||
| Less than high school | 70.8 | 78.9 | ||
| High school or more | 29.2 | 21.1 | ||
| Marital statusc | ||||
| Married | 75.6 | 67.0 | ||
| Other | 24.4 | 33.0 | ||
| Employmentc | ||||
| Working | 69.4 | 62.4 | ||
| Other | 30.6 | 37.6 | ||
| Incomec | ||||
| <$7,000 | 11.6 | 25.5 | ||
| ≥$7,000 | 88.4 | 74.5 | ||
| Smoker | ||||
| Current smoker | 25.4 | 25.0 | ||
| Nonsmoker | 74.6 | 75.0 | ||
| Regular exercisec | ||||
| No | 74.4 | 81.7 | ||
| Yes | 25.6 | 18.3 | ||
| Incident heart attack | ||||
| No | 94.0 | 94.0 | ||
| Yes | 6.0 | 6.0 | ||
| Incident stroke | ||||
| No | 98.8 | 99.1 | ||
| Yes | 1.2 | 0.9 | ||
| Comorbidity count | ||||
| 0 | 22.8 | 23.4 | ||
| 1 | 42.1 | 41.8 | ||
| 2 | 24.6 | 23.0 | ||
| 3 or more | 10.5 | 11.8 | ||
| Self-rated healthc | ||||
| Excellent/very good/good | 87.8 | 79.1 | ||
| Fair/poor | 12.2 | 20.9 | ||
Abbreviation: SD, standard deviation.
All descriptive statistics are weighted to be representative of the US civilian, noninstitutionalized population. Descriptive statistics are reported as the percentage for categorical variables and the mean for continuous variables.
Baseline is 1982–1984, except for those contributing only to analyses of incident disability between 1987 and 1992, for whom the baseline is 1987.
P < 0.05 for the test of difference (t test for continuous variables and χ2 for categorical variables) between the study sample and the rest of the cohort.
Further, 42% of the sample (32% of men, 51% of women) abstained from drinking at baseline, 48% of the sample (51% of men, 45% of women) were light to moderate drinkers, 10% of the sample (17% of men, 4% of women) were heavy drinkers, and 8% were former drinkers.
In addition, 22% percent of the sample either died (7%) or became disabled (15%) over 5 years: The risk was similar in men and women (P = 0.8) but substantially higher in those with poor or fair self-reported health (42%) compared with those with excellent, very good, or good self-reported health (19%) (P < 0.001). Among those who survived 5 years, 16% developed disability; again, the risk was higher in those with poor or fair self-reported health (31%) than in those with excellent, very good, or good self-reported health (14%) (P < 0.0001) and also higher in women than in men (18% vs. 14%; P = 0.0002). Comparing the first with the second period, we found that risks were slightly higher in the second period when participants were a few years older (20% dead or disabled in the first period vs. 24% in the second; among survivors, 14% were disabled in the first period vs. 18% in the second).
In unadjusted analyses, the risk of incident disability or death was lowest in light/moderate drinkers (17.7% compared with 26.7% in abstainers and 21.4% in heavy drinkers; P < 0.0001). Because mortality risk was also lowest in light/moderate drinkers (6.0% vs. 8.4% in abstainers and 6.9% in heavy drinkers), it is possible that alcohol's association with the incident disability-or-death outcome is a reflection of the alcohol–mortality association. To address this possibility, we excluded those who died and examined the risk of incident disability by alcohol consumption level among the survivors. In unadjusted analyses, the risk of incident disability among survivors was also lowest in light-to-moderate drinkers (12.5% compared with 20.0% in abstainers and 15.6% in heavy drinkers) (Figure 3).
Figure 3.

Unadjusted 5-year (1982–1987 and 1987–1992) incident disability risk as a function of alcohol consumption level in the US civilian, noninstitutionalized population aged 50 years or older.
This association of light/moderate drinking with reduced disability risk persisted after controlling for potential confounders. Compared with abstainers, light to moderate drinkers had 23% lower adjusted odds for incident disability or death and, among survivors, 25% lower adjusted odds for incident disability (Table 2). Heavy drinkers and former drinkers had risks similar to those of abstainers in both analyses. In sensitivity analyses, after exclusion of the 770 individuals whose alcohol variables in 1987 had been imputed from 1982–1984 alcohol data, the associations did not substantially change (data not shown).
Table 2.
Adjusted Odds Ratiosa for Incident Disability Over 5 years (1982–1987 and 1987–1992) for the US Civilian, Noninstitutionalized Population Aged 50 Years or Older
| Alcohol Consumption | Incident Disability or Death | Incident Disability (Among Survivors) | ||
| Odds Ratio | 95% Confidence Interval | Odds Ratio | 95% Confidence Interval | |
| Light/moderate drinkerb | 0.77* | 0.64, 0.94 | 0.75* | 0.60, 0.93 |
| Heavy drinkerc | 1.04 | 0.78, 1.39 | 1.12 | 0.80, 1.56 |
| Former drinkerd | 0.96 | 0.71, 1.29 | 0.89 | 0.62, 1.27 |
P < 0.05.
Adjusted for age, gender, race, education, marital status, income, employment, smoking status, regular exercise, history of heart attack, history of stroke, number of comorbid health conditions, self-rated health, period, length of follow-up, and the following interactions: age × gender, marital status × gender, and age × race. The reference group was lifelong abstainers (<12 drinks/year).
Defined as ≥12 drinks/year but <15 drinks/week and <5 drinks/drinking day (4 for women).
Defined as ≥15 drinks/week or ≥5 drinks/drinking day (4 for women).
Defined as ≥12 drinks/year in prior years but in the past year drank <12 drinks.
In tests of effect modification, light/moderate drinking had a smaller protective effect in men compared with women (Pinteraction = 0.06 for death or disability outcome and Pinteraction = 0.05 for disability outcome in survivors) and a larger protective effect in those with good, very good, or excellent self-reported health compared with those with poor or fair self-reported health (Pinteraction = 0.01 for death or disability outcome and Pinteraction = 0.02 for disability outcome in survivors). On the basis of these results, we reran the models separately in 4 strata defined by gender and self-reported health. To allow for the possibility that benefit or harm may accrue at different levels of consumption in the 4 strata, we divided the light/moderate drinking category into 2 subcategories: light drinking, defined as consuming 7 or fewer drinks per week; and moderate drinking, defined as consuming more than 7 but fewer than 15 drinks per week. The association between light/moderate drinking and reduced disability risk was seen only in women in good or better health, and there was a suggestion that there might be a dose response in both men and women with good or better health (Table 3).
Table 3.
Adjusted Odds Ratiosa for Incident Disability Over 5 Years (1982–1987 and 1987–1992) for the US Civilian, Noninstitutionalized Population Aged 50 Years or Older, Stratified by Gender and Self-reported Health
| Alcohol Consumption | Incident Disability or Death | Incident Disability (Among Survivors) | ||
| Odds Ratio | 95% Confidence Interval | Odds Ratio | 95% Confidence Interval | |
| Women in good or better health | ||||
| Light drinkerb | 0.67* | 0.52, 0.87 | 0.66* | 0.49, 0.87 |
| Moderate drinkerc | 0.41* | 0.22, 0.77 | 0.35* | 0.17, 0.73 |
| Heavy drinkerd | 0.73 | 0.39, 1.35 | 0.81 | 0.42, 1.56 |
| Former drinkere | 1.01 | 0.52, 1.98 | 0.87 | 0.40, 1.93 |
| Drinks per week (if not heavy drinker)f | 0.93* | 0.88, 0.98 | 0.92* | 0.87, 0.98 |
| Men in good or better health | ||||
| Light drinkerb | 0.92 | 0.62, 1.34 | 0.89 | 0.57, 1.42 |
| Moderate drinkerc | 0.69 | 0.42, 1.13 | 0.68 | 0.37, 1.24 |
| Heavy drinkerd | 1.21 | 0.78, 1.89 | 1.27 | 0.77, 2.11 |
| Former drinkere | 1.29 | 0.81, 2.06 | 1.22 | 0.69, 2.14 |
| Drinks per week (if not heavy drinker)f | 0.97* | 0.93, 1.00 | 0.97 | 0.93, 1.01 |
| Women in fair or worse health | ||||
| Light drinkerb | 1.46 | 0.68, 3.14 | 1.30 | 0.59, 2.90 |
| Moderate drinkerc | 1.74 | 0.23, 13.2 | 2.10 | 0.32, 13.8 |
| Heavy drinkerd | 1.54 | 0.29, 8.19 | 1.41 | 0.24, 8.18 |
| Former drinkere | 0.77 | 0.34, 1.74 | 0.96 | 0.37, 2.53 |
| Drinks per week (if not heavy drinker)f | 1.09 | 0.91, 1.31 | 1.08 | 0.93, 1.25 |
| Men in fair or worse health | ||||
| Light drinkerb | 1.68 | 0.83, 3.38 | 1.74 | 0.74, 4.15 |
| Moderate drinkerc | 1.57 | 0.47, 5.21 | 2.67 | 0.72, 9.87 |
| Heavy drinkerd | 1.30 | 0.61, 2.78 | 1.35 | 0.54, 3.40 |
| Former drinkere | 1.14 | 0.56, 2.32 | 1.47 | 0.65, 3.31 |
| Drinks per week (if not heavy drinker)f | 1.05 | 0.96, 1.16 | 1.10 | 0.98, 1.23 |
P < 0.05.
Adjusted for the same variables as in Table 2 but excluding the stratifying variables. The reference group is lifelong abstainers (<12 drinks/year).
Defined as ≥12 drinks/year but ≤7 drinks/week and <5 drinks/drinking day (4 for women).
Defined as >7 drinks/week but <15 drinks/week and <5 drinks/drinking day (4 for women).
Defined as ≥15 drinks/week or ≥5 drinks/drinking day (4 for women).
Defined as ≥12 drinks/year in prior years but in the past year drank <12 drinks.
Odds ratio per each additional drink.
To test for a dose response, we reran the stratified models with number of drinks per week as a continuous predictor, after excluding the heavy drinkers. Each additional drink per week was associated with 3% lower odds of disability in men in good or better health, 7%–8% lower odds in women in good or better health, and a statistically nonsignificant 5%–10% greater odds in those in fair or worse health (Table 3). We next added a quadratic term (square of the number of drinks per week) to the models to test for nonlinearity in the dose response. The squared term did not make significant contributions to the associations, except in women in good or better health, where it made a significant, positive contribution (P = 0.047) to the model for incident disability or death, implying that the benefit in healthy women peaks at around 9 drinks per week (Figure 4). To examine the nature of the dose effect in heavy drinkers, we reran the stratified models in heavy drinkers, once with number of drinks per week as continuous predictor and once with number of drinks per drinking day as predictor. Among those in fair or worse health, only 13 women and 63 men were heavy drinkers; hence, these analyses were conducted only in those in good or better health (144 women and 394 men). In both sexes, neither number of drinks per week nor number of drinks per drinking day had a significant association with incident disability risk (P > 0.35 for all).
Figure 4.

Model-predicted relative odds of 5-year (1982–1987 and 1987–1992) incident disability or death (relative to abstainers) in US civilian, noninstitutionalized women aged 50 years or older in self-reported good, very good, or excellent health, who are not heavy drinkers, as a function of number of drinks per week.
In exploratory analyses (in survivors), we reran the stratified models using the follow-up disability count score (range, 0–8) as outcome and Poisson regression (with GEE to account for correlation of data between period 1 and period 2). Results were similar to the results from the main models. Light to moderate drinking was beneficial only in men and women in good or better health. Among the women in good or better health, compared with abstainers, the follow-up disability count score was 40% (95% confidence interval (CI): 24, 57) lower in light drinkers and 76% (95% CI: 51, 88) lower in moderate drinkers. Among those who were not heavy drinkers, each additional drink per week was associated with 11% (95% CI: 5, 17) lower disability scores in women in good or better health and 4% (95% CI: 0, 8) lower disability scores in men in good or better health. There were no quadratic dose effects in either group.
DISCUSSION
In a population-based sample of nondisabled Americans aged 50 years or older, we observed that light and moderate drinkers were less likely to become disabled than abstainers. However, the benefits from light/moderate drinking were seen only in men and women in good, very good, or excellent self-reported health. In these individuals, there was a dose response, where disability risk reduction was larger at higher levels of drinking, up to 9 drinks per week in women and 15 drinks per week in men. Although a causal relation between alcohol consumption and disability prevention cannot be directly inferred from an observational study, the suggestion of a dose response strengthens the evidence for a causal relation. One potential causal pathway might be through reduction in cardiovascular events (37, 38). Stroke is the chronic condition that has the largest impact on disability-free survival in old age (39); because moderate alcohol use is known to protect against cerebrovascular disease (6), it is possible that some of the disability risk prevention from light/moderate alcohol consumption comes from preventing strokes. However, adjustment for stroke in our analyses did not alter our findings, suggesting residual confounding by severity of stroke (which we could not adjust for) and/or subclinical cardiovascular disease.
The associations between light/moderate drinking and reduced disability risk were stronger in women than in men. There are several possible reasons for this finding, including gender differences in binge drinking (40) and the pace of alcohol consumption (41). Moreover, alcohol consumption declines (with aging) faster in men than in women (42); this could have led to more confounding by the ill effects of past heavy drinking in men than in women.
Light to moderate alcohol consumption appears to have disability prevention benefits only in men and women in relatively good health. It is possible that those who report poor health have progressed too far on the pathway to disability to accrue benefits from alcohol consumption and that alcohol consumption may even be deleterious for them. We found that even light/moderate consumption may be associated with increased disability risk in those in poor or fair self-reported health. Alcohol's interactions with medications may be responsible for increased disability risk in these individuals (43). Further studies are needed to examine if people with certain specific health conditions or on specific medications are more prone to disability from alcohol consumption.
Unlike other studies (31), this study did not find increased risk for incident disability in former drinkers compared with lifelong abstainers. People who quit drinking often do so for health-related concerns (30). The increased risks in these individuals might be secondary to their underlying health conditions. In our study, we controlled for health conditions by including a count of medical conditions and indicators of stroke, heart attack, and self-reported health. With these controls, former drinkers were not at increased risk for incident disability.
Our study had some limitations. Like other epidemiologic studies of the effects of alcohol consumption on health outcomes, this study also relied on participants’ reports of current and past consumption levels. However, a tendency in abstainers and very light drinkers to overreport and in heavy drinkers to underreport their consumption would only have reduced the strength of the estimated association between light/moderate drinking and incident disability risk. Disability status was also obtained from self-report, but the validity of self-reported disability data has been well established (44, 45). Levels of both alcohol consumption and disability were evaluated at discrete time points in our study; thus, we did not capture historical information about levels of drinking and did not distinguish between transient and permanent forms of disability. Like those in other prospective cohort studies, the participants in this study are likely to be healthier and from higher socioeconomic strata than the general population. The use of NHEFS sampling weights in our analyses at least partially compensates for such differences in sampling probability and makes our findings representative of the general population.
In conclusion, this large, nationally representative, prospective cohort study of alcohol consumption as a predictor of incident disability found that light/moderate drinking is associated with 33%–65% reduction overall (and 3%–8% reduction with each additional drink per week) in the odds of incident disability in men and women in good self-reported health, as well as possibly increased odds of incident disability in men and women in poor self-reported health. Further research is needed to discover the biologic underpinnings of this association, to understand why alcohol's benefits are seen only in those in good health, and to determine whether and how definitions of harmful drinking have to be tailored to an individual's overall health, specific comorbidities and medications used, and social circumstances.
Acknowledgments
Author affiliations: Department of Medicine, David Geffen School of Medicine, University of California at Los Angeles, Los Angeles, California (Arun S. Karlamangla, Deborah M. Kado, Howard Dedes, Diana H. Liao, Sungjin Kim, David B. Reuben, Gail A. Greendale, Alison A. Moore); and Geriatric Research Education and Clinical Center, VA Greater Los Angeles Healthcare System, Los Angeles, California (Catherine A. Sarkisian).
This work was supported by the John A. Hartford Foundation/American Federation for Aging Research Medical Student Geriatric Scholars Program (to H. D.); the National Institute on Alcohol Abuse and Alcoholism (grants R01-AA-013937, R01-AA-013990, and R01-DA-020944 to A. A. M.); and the Claude D. Pepper Older Americans Independence Center, National Institute on Aging (grant 5P30 AG028748 to A. S. K.).
Conflict of interest: none declared.
Glossary
Abbreviations
- CI
confidence interval
- GEE
generalized estimating equations
- NHEFS
National Health and Nutrition Examination Survey Epidemiologic Follow-up Study
References
- 1.Manton KG, Corder L, Stallard E. Chronic disability trends in elderly United States populations: 1982–1994. Proc Natl Acad Sci U S A. 1997;94(6):2593–2598. doi: 10.1073/pnas.94.6.2593. [DOI] [PMC free article] [PubMed] [Google Scholar]
- 2.Reid MC, Boutros NN, O'Connor PG, et al. The health-related effects of alcohol use in older persons: a systematic review. Subst Abus. 2002;23(3):149–164. doi: 10.1080/08897070209511485. [DOI] [PubMed] [Google Scholar]
- 3.White IR, Altmann DR, Nanchahal K. Alcohol consumption and mortality: modelling risks for men and women at different ages [electronic article] BMJ. 2002;325(7357):191. doi: 10.1136/bmj.325.7357.191. [DOI] [PMC free article] [PubMed] [Google Scholar]
- 4.Klatsky AL, Udaltsova N. Alcohol drinking and total mortality risk. Ann Epidemiol. 2007;17(suppl):S63–S67. [Google Scholar]
- 5.Rimm EB, Moats C. Alcohol and coronary heart disease: drinking patterns and mediators of effect. Ann Epidemiol. 2007;17(suppl):S3–S7. [Google Scholar]
- 6.Mukamal K. Alcohol intake and noncoronary cardiovascular diseases. Ann Epidemiol. 2007;17(5 suppl):S8–S12. doi: 10.1016/j.annepidem.2007.01.003. [DOI] [PMC free article] [PubMed] [Google Scholar]
- 7.Letenneur L. Moderate alcohol consumption and risk of developing dementia in the elderly: the contribution of prospective studies. Ann Epidemiol. 2007;17(suppl):S43–S45. [Google Scholar]
- 8.Howard AA, Arnsten JH, Gourevitch MN. Effect of alcohol consumption on diabetes mellitus: a systematic review. Ann Intern Med. 2004;140(3):211–219. doi: 10.7326/0003-4819-140-6-200403160-00011. [DOI] [PubMed] [Google Scholar]
- 9.LaCroix AZ, Guralnik JM, Berkman LF, et al. Maintaining mobility in late life. II. Smoking, alcohol consumption, physical activity, and body mass index. Am J Epidemiol. 1993;137(8):858–869. doi: 10.1093/oxfordjournals.aje.a116747. [DOI] [PubMed] [Google Scholar]
- 10.Nelson HD, Nevitt MC, Scott JC, et al. Smoking, alcohol, and neuromuscular and physical function of older women. Study of Osteoporotic Fractures Research Group. JAMA. 1994;272(23):1825–1831. doi: 10.1001/jama.1994.03520230035035. [DOI] [PubMed] [Google Scholar]
- 11.Stuck AE, Walthert JM, Nikolaus T, et al. Risk factors for functional status decline in community-living elderly people: a systematic literature review. Soc Sci Med. 1999;48(4):445–469. doi: 10.1016/s0277-9536(98)00370-0. [DOI] [PubMed] [Google Scholar]
- 12.Wang L, van Belle G, Kukull WB, et al. Predictors of functional change: a longitudinal study of nondemented people aged 65 and older. J Am Geriatr Soc. 2002;50(9):1525–1534. doi: 10.1046/j.1532-5415.2002.50408.x. [DOI] [PubMed] [Google Scholar]
- 13.Woods NF, LaCroix AZ, Gray SL, et al. Frailty: emergence and consequences in women aged 65 and older in the Women's Health Initiative Observational Study. J Am Geriatr Soc. 2005;53(8):1321–1330. doi: 10.1111/j.1532-5415.2005.53405.x. [DOI] [PubMed] [Google Scholar]
- 14.Byles J, Young A, Furuya H, et al. A drink to healthy aging: the association between older women's use of alcohol and their health-related quality of life. J Am Geriatr Soc. 2006;54(9):1341–1347. doi: 10.1111/j.1532-5415.2006.00837.x. [DOI] [PubMed] [Google Scholar]
- 15.Lang I, Guralnik J, Wallace RB, et al. What level of alcohol consumption is hazardous for older people? Functioning and mortality in US and English national cohorts. J Am Geriatr Soc. 2007;55(1):49–57. doi: 10.1111/j.1532-5415.2006.01007.x. [DOI] [PubMed] [Google Scholar]
- 16.Cawthon PM, Fink HA, Barrett-Connor E, et al. Alcohol use, physical performance, and functional limitations in older men. J Am Geriatr Soc. 2007;55(2):212–220. doi: 10.1111/j.1532-5415.2007.01062.x. [DOI] [PubMed] [Google Scholar]
- 17.Colsher PL, Wallace RB. Elderly men with histories of heavy drinking: correlates and consequences. J Stud Alcohol. 1990;51(6):528–535. doi: 10.15288/jsa.1990.51.528. [DOI] [PubMed] [Google Scholar]
- 18.Strawbridge WJ, Shema SJ, Balfour JL, et al. Antecedents of frailty over three decades in an older cohort. J Gerontol B Psychol Sci Soc Sci. 1998;53(1):S9–S16. doi: 10.1093/geronb/53b.1.s9. [DOI] [PubMed] [Google Scholar]
- 19.Perreira KM, Sloan FA. Excess alcohol consumption and health outcomes: a 6-year follow-up of men over age 50 from the Health and Retirement Study. Addiction. 2002;97(3):301–310. doi: 10.1046/j.1360-0443.2002.00067.x. [DOI] [PubMed] [Google Scholar]
- 20.Moore AA, Endo JO, Carter MK. Is there a relationship between excessive drinking and functional impairment in older persons? J Am Geriatr Soc. 2003;51(1):44–49. doi: 10.1034/j.1601-5215.2002.51008.x. [DOI] [PubMed] [Google Scholar]
- 21.Ostermann J, Sloan FA. Effects of alcohol consumption on disability among the near elderly: a longitudinal analysis. Milbank Q. 2001;79(4):487–515. doi: 10.1111/1468-0009.00219. [DOI] [PMC free article] [PubMed] [Google Scholar]
- 22.Branch LG. Health practices and incident disability among the elderly. Am J Public Health. 1985;75(12):1436–1439. doi: 10.2105/ajph.75.12.1436. [DOI] [PMC free article] [PubMed] [Google Scholar]
- 23.Guralnik JM, Kaplan GA. Predictors of healthy aging: prospective evidence from the Alameda County Study. Am J Public Health. 1989;79(6):703–708. doi: 10.2105/ajph.79.6.703. [DOI] [PMC free article] [PubMed] [Google Scholar]
- 24.National Center for Health Statistics. Plan and Operation of the National Health and Nutrition Examination Survey, United States. 1971–73. Hyattsville, MD: National Center for Health Statistics; 1973. (Vital and health statistics, series 1: part A, development, plan, and operation; part B, data collection forms of the survey, no. 10a and 10b) (DHEW publication no. (PHS) 79-1310) [Google Scholar]
- 25.National Center for Health Statistics. Plan and Operation of the NHANES I Epidemiologic Follow-up Study 1982–84. Hyattsville, MD: National Center for Health Statistics; 1987. (Vital and health statistics, series 1: programs and collection procedures, no. 22) (DHHS publication no. (PHS) 87-1324) [Google Scholar]
- 26.National Center for Health Statistics. Plan and Operation of the NHANES I Epidemiologic Follow-up Study 1987. Hyattsville, MD: National Center for Health Statistics; 1992. (Vital and health statistics, series 1: programs and collection procedures, no. 27) (DHHS publication no. (PHS) 92-1303) [Google Scholar]
- 27.National Center for Health Statistics. Plan and Operation of the NHANES I Epidemiologic Follow-up Study, 1992. Hyattsville, MD: National Center for Health Statistics; 1997. (Vital and health statistics, series 1: programs and collection procedures, no. 35) (DHHS publication no. (PHS) 98-1311) (GPO no. 017-022-01405-0) [Google Scholar]
- 28.Williams GD, DeBakey SF. Changes in levels of alcohol consumption: United States, 1983–1988. Br J Addict. 1992;87(4):643–648. doi: 10.1111/j.1360-0443.1992.tb01966.x. [DOI] [PubMed] [Google Scholar]
- 29.National Institute on Alcohol Abuse and Alcoholism. Helping Patients Who Drink Too Much. A Clinician’s Guide. Updated 2005 Edition. Bethesda, MD: National Institute on Alcohol Abuse and Alcoholism; 2007. (NIH publication no. 07-3769) [Google Scholar]
- 30.Moore AA, Hays RD, Greendale GA, et al. Drinking habits among older persons: findings from the NHANES I Epidemiologic Followup Study (1982–84). National Health and Nutrition Examination Survey. J Am Geriatr Soc. 1999;47(4):412–416. doi: 10.1111/j.1532-5415.1999.tb07232.x. [DOI] [PubMed] [Google Scholar]
- 31.Reid MC, Concato J, Towle VR, et al. Alcohol use and functional disability among cognitively impaired adults. J Am Geriatr Soc. 1999;47(7):854–859. doi: 10.1111/j.1532-5415.1999.tb03844.x. [DOI] [PubMed] [Google Scholar]
- 32.Bruce B, Fries JF. The Stanford Health Assessment Questionnaire: a review of its history, issues, progress, and documentation. J Rheumatol. 2003;30(1):167–178. [PubMed] [Google Scholar]
- 33.Ferraro KF, Su YP, Gretebeck RJ, et al. Body mass index and disability in adulthood: a 20-year panel study. Am J Public Health. 2002;92(5):834–880. doi: 10.2105/ajph.92.5.834. [DOI] [PMC free article] [PubMed] [Google Scholar]
- 34.Zeger SL, Liang KY, Albert PS. Models for longitudinal data: a generalized estimating equation approach. Biometrics. 1998;44(4):1049–1060. [PubMed] [Google Scholar]
- 35.SAS Institute, Inc. SAS/STAT User’s Guide, Version 8. Cary, NC: SAS Institute, Inc; 1999. [Google Scholar]
- 36.Twisk JWR. Applied Longitudinal Data Analysis for Epidemiology: A Practical Guide. New York, NY: Cambridge University Press; 2003. [Google Scholar]
- 37.Corrao G, Rubiatti L, Bagnardi V, et al. Alcohol and coronary heart disease: a meta analysis. Addiction. 2000;95(10):1505–1523. doi: 10.1046/j.1360-0443.2000.951015056.x. [DOI] [PubMed] [Google Scholar]
- 38.Corrao G, Rubiatti L, Zambon A, et al. A meta analysis of alcohol consumption and the risk of 15 diseases. Prev Med. 2004;38(5):613–619. doi: 10.1016/j.ypmed.2003.11.027. [DOI] [PubMed] [Google Scholar]
- 39.Jagger C, Matthews R, Matthews F, et al. The burden of diseases on disability-free life expectancy in later life. J Gerontol A Biol Sci Med Sci. 2007;62(4):408–414. doi: 10.1093/gerona/62.4.408. [DOI] [PubMed] [Google Scholar]
- 40.Stahre M, Naimi T, Brewer R, et al. Measuring average alcohol consumption: the impact of including binge drinks in quantity-frequency calculations. Addiction. 2006;101(12):1711–1718. doi: 10.1111/j.1360-0443.2006.01615.x. [DOI] [PubMed] [Google Scholar]
- 41.York JL, Welte J, Hirsch J. Gender comparison of alcohol exposure on drinking occasions. J Stud Alcohol. 2003;64(6):790–801. doi: 10.15288/jsa.2003.64.790. [DOI] [PubMed] [Google Scholar]
- 42.Moore AA, Gould R, Reuben DB, et al. Longitudinal patterns of alcohol consumption in the United States. Am J Public Health. 2005;95(3):458–465. doi: 10.2105/AJPH.2003.019471. [DOI] [PMC free article] [PubMed] [Google Scholar]
- 43.Oslin DW. Alcohol use in late life: disability and comorbidity. J Geriatr Psychiatry Neurol. 2000;13(3):134–140. doi: 10.1177/089198870001300307. [DOI] [PubMed] [Google Scholar]
- 44.Fried LP, Young Y, Rubin G, et al. Self reported preclinical disability identifies older women with early declines in performance and early disease. J Clin Epidemiol. 2001;54(9):889–901. doi: 10.1016/s0895-4356(01)00357-2. [DOI] [PubMed] [Google Scholar]
- 45.Sayers SP, Brach JS, Newman AB, et al. Use of self report to predict ability to walk 400 metres in mobility-limited older adults. J Am Geriatr Soc. 2004;52(12):2099–2103. doi: 10.1111/j.1532-5415.2004.52571.x. [DOI] [PubMed] [Google Scholar]