

Abstract
Background
Examination of 12 or more regional lymph nodes for colon cancer is associated with improved staging and survival, and the National Quality Forum recently endorsed lymph node examination for colon cancer as a quality surveillance measure. However, information regarding the extent of hospital compliance with the 12-node measure in the United States is lacking.
Methods
From the National Cancer Data Base, 1296 hospitals that performed 156 789 colectomies in 1996–1997 and 2004–2005 were identified, and rates of hospital-level compliance (defined as examination of ≥12 nodes in ≥75% of patients) in these two time periods were compared. Multivariable models were developed to determine if hospital type, volume, or differences in case mix were associated with 12-node measure compliance. All statistical tests were two-sided.
Results
In 1996–1997, 15% of hospitals were compliant with the 12-node measure; in 2004–2005 the percentage of compliant hospitals had increased to 38%. From 1996–1997 to 2004–2005, 12-node measure compliance increased at 980 hospitals, remained unchanged at 6 hospitals, and decreased at 310 hospitals. In 2004–2005, National Cancer Institute–designated Comprehensive Cancer Centers were more frequently compliant with the 12-node measure than other academic hospitals, Veterans’ Administration hospitals, or community hospitals (78.1% versus 52.4%, 53.1%, and 33.7%, respectively, all P < .001), even after adjustment for differences in characteristics of the colon cancer patients at these hospitals.
Conclusions
This study provides a national report card of nearly 1300 hospitals showing that more than 60% of institutions failed to achieve a compliance benchmark for the 12-node measure. Considerable improvement is needed in colon cancer nodal evaluation in the United States.
Context and Caveats
Prior knowledge
Although examination of 12 or more regional lymph nodes in patients diagnosed with colon cancer is associated with improved survival, the extent to which hospitals comply with the 12-node measure was unknown.
Study design
Rates of hospital compliance with the 12-node measure (defined as examination of 12 or more nodes in 75% or more of patients) in 1996–1997 and 2004–2005 were determined from the National Cancer Data Base. Logistic regression models were used to determine associations of hospital characteristics with compliance.
Contribution
Although the percentage of hospitals compliant with the 12-node measure increased over time, only 38% of hospitals were compliant in 2004–2005. National Cancer Institute–designated Comprehensive Cancer Centers and academic hospitals were more likely than community hospitals to be in compliance with the 12-node measure.
Implications
Improvement is needed in nodal evaluation of colon cancer patients in the United States.
Limitations
The authors only had access to data from hospitals approved by the Commission on Cancer, which may have biased estimates of compliance at community hospitals.
From the Editors
Colon cancer is the most common gastrointestinal malignancy and the second-leading cause of cancer death in the United States (1). Approximately 80% of colon cancer patients present with resectable, localized disease, and in these patients, nodal metastases have long been recognized as the most important factor predicting long-term survival (1,2). Nodal involvement is an important determinant in the decision to administer adjuvant chemotherapy, and with the demonstration over the last decade of highly effective systemic therapies for colon cancer, it is essential to ensure that all patients who would benefit from such treatment receive counseling concerning these therapies and have access to them (3).
Numerous studies have shown an improvement in disease-specific and overall survival when increasing numbers of lymph nodes are examined for colon cancer (4–13). The improvement in outcomes is probably due in part to stage migration or more accurate staging that allows for increased utilization of adjuvant chemotherapy. The adequacy of lymph node examination for colon cancer may alternatively be a proxy for other factors that account for the improvement in outcomes, such as overall surgical technique and cancer surveillance activities (14). The suggestion that there is a direct therapeutic benefit from a more complete lymphadenectomy is controversial (14).
There has been a considerable effort to determine the minimum number of nodes that need to be evaluated to deem a patient free of nodal metastases with reasonable certainty. Estimates have varied from 6 to 40 lymph nodes (5,9,11–15); however, numerous studies and consensus guidelines have suggested that examination of 12 regional lymph nodes is a reasonable minimum for adequate nodal evaluation for colon cancer (5,9,11–20). Despite these findings, population-based assessments have shown that the majority of patients in the United States do not have 12 or more nodes examined (21,22).
Although a recent and controversial study comparing survival of colorectal cancer patients based on the hospitals’ lymph node examination rates has questioned whether the 12-node measure improves survival and is an indicator of hospital quality (23–25), the American College of Surgeons (ACoS), American Society of Clinical Oncology (ASCO), and the National Comprehensive Cancer Network (NCCN) harmonized a quality measure requiring resection and pathological examination of 12 or more lymph nodes for colon cancer (16,26,27). Subsequently, the National Quality Forum (NQF) endorsed the 12-node measure for quality surveillance (28). A large, national health-care insurer, United Healthcare, is already basing referral recommendations for colectomy on a one-time requirement that surgeons provide pathology reports demonstrating examination of 12 or more lymph nodes for colon cancer.
However, the level of national compliance with the 12-node measure at the hospital level is unknown. The objective of this study was to create a national report card of hospital compliance with the 12-node measure over time by 1) assessing performance rates according to hospital type and volume, 2) determining what proportion of hospitals are compliant with the 12-node measure, and 3) evaluating the association of hospital type and volume with institutional compliance with the 12-node measure. We hypothesized that the number of hospitals compliant with the 12-node measure had increased over time and that National Cancer Institute–designated Comprehensive Cancer Centers (NCI–CCCs) and high-volume hospitals were more likely to be compliant than other hospital types.
Methods
Data Acquisition and Patient Selection
The National Cancer Data Base (NCDB) is a program of the ACoS, the Commission on Cancer (CoC), and the American Cancer Society (29) that has been collecting data on newly diagnosed cancers since 1985 and contains information on over 21 million patients. All CoC-approved hospitals must report all their cancer cases to the NCDB annually. Based on national incidence estimates from the American Cancer Society, the NCDB has been estimated to capture approximately 67% of all new colon cancers annually (1,29).
One of the first recommendations to examine 12 or more lymph nodes was put forth by the American Joint Committee on Cancer (AJCC) in 1997 in the fifth edition of the Cancer Staging Manual (17). This recommendation was followed by similar ones from numerous other major oncology organizations over the next 3 years (17). Thus, we sought to compare nodal evaluation between patients diagnosed between January 1, 1996, and December 31, 1997 (prior to the AJCC’s recommendation) and patients diagnosed between January 1, 2004, and December 31, 2005 (most recent data available). Patients who had a diagnosis of colon cancer in 1996–1997 and 2004–2005 were identified from the NCDB. We limited the study to patients who underwent a colectomy for adenocarcinoma of the colon, excluding patients who had local procedures (eg, polypectomy) (30,31). Patients were also excluded if they were <18 years old, had nonepithelial lesions, presented with distant metastases (AJCC Stage IV), had a reported history of prior malignancy, or had undergone neoadjuvant therapy. Patients were also excluded if they had undergone surgery at a hospital other than the reporting facility. Appendiceal, rectal, and rectosigmoid junction cancers were not included in this study. The inclusion and exclusion criteria used in this study are identical to those specified in the 12-node measure by the ACoS, NCCN, ASCO, and NQF. From the patient-level analytic cohort, patients were aggregated to create a hospital-level dataset. This study was approved by the Northwestern University Institutional Review Board.
Hospital Classification
Hospitals were examined by type and volume. The categories for the hospital-type variable were NCI–CCC (n = 32), other academic institutions (academic but not NCI–CCC, n = 231), Veterans’ Administration (VA) centers (n = 49), and community hospitals (n = 984). The National Cancer Institute designates hospitals as Comprehensive Cancer Centers based on clinical care, research, and community outreach criteria. Hospitals in the NCDB are broadly classified by the CoC into academic and community hospitals (32). To be considered as academic, hospitals must be primarily affiliated with teaching and research institutions, meet annual case volume requirements, fulfill criteria regarding the capacity to provide a wide range of cancer-specific services and specialists, meet specified clinical trial accrual standards, perform a range of quality improvement activities (convening cancer committees and multidisciplinary tumor boards, carrying out specified annual quality assessment and improvement projects, and instituting a cancer registry quality control plan), and offer community outreach programs. A hospital's compliance with these standards is reassessed every 3 years through an on-site evaluation. VA hospitals are those operated by the Veterans’ Health Administration. Procedure volume quartiles were calculated separately for 1996–1997 and 2004–2005 by ranking all hospitals in order of increasing mean annual hospital volume of colectomies, and whole-number cut points were chosen that most closely categorized hospitals into four equal groups.
Hospital-Level Analysis
Only hospitals that reported to the NCDB in both time periods were included in the hospital-level dataset. Variables representing the characteristics of an individual hospital included median number of nodes examined; proportion of patients having at least 12 nodes examined; mean annual hospital colectomy volume; median age of study patients; percent of study patients per hospital who are female and nonwhite; and percent of study patients with right-sided colon cancers, high-grade tumors, and T1, T2, T3, or T4 lesions. The unit of analysis was the hospital for all analyses in this study.
Adequate lymph node evaluation was defined as examination of 12 or more nodes based on consensus guidelines and the specifications for the 12-node measure (16,26–28). To measure hospital performance with respect to the 12-node measure, we calculated the proportion of patients who had at least 12 nodes examined per hospital per time period. Thus, performance was defined as the proportion of patients per hospital who had at least 12 nodes examined. A benchmark for performance was derived by calculating the mean performance level with the 12-node measure for the top-performing quartile of hospitals in 2004–2005. This level, 75%, was considered the benchmark for compliance. Thus, a hospital was considered compliant with the 12-node measure if examination of at least 12 nodes occurred for at least 75% of patients at that hospital. Due to statistical variation, hospitals were considered “statistically compliant” if the upper limit of the 95% confidence interval (CI) of the estimate of their performance rate was greater than or equal to 75%.
Statistical Analysis
Multiple logistic regression models were developed to evaluate the association of hospital characteristics and compliance with the 12-node measure. The dependent variable was statistical compliance (ie, the upper limit of the 95% CI for the estimate of performance was greater than or equal to 75%) versus non–statistical compliance with the 12-node measure. Variables were introduced into the model in a forward stepwise fashion and included the hospital-level characteristics calculated for sex (percent female), median age (continuous), race/ethnicity (percent nonwhite), T stage (percent with T1, T2, T3, or T4), tumor grade (percent with poorly differentiated tumors), lesion location along the colon (percent with right-sided tumors), and hospital type and volume. Hospital type (NCI–CCC, other academic, VA, or community hospitals) and volume (as both a continuous and a categorical [quartiles] variable) were examined separately. Odds ratios with 95% CIs were calculated and converted to relative risks (RRs) with 95% CIs (33).
Differences in case mix and 12-node measure performance by hospital type and volume were compared using analysis of variance. Median lymph node counts by hospital type and volume were compared with the Mann–Whitney test. Differences in mean performance rates over time were compared with t tests. The chi-square test was used to compare compliance by hospital type and volume. The Bonferroni method was used to correct for multiple comparisons. The threshold for statistical significance was set at .05. All P values were based on two-sided tests. Statistical analyses were performed using SPSS, version 14 (SPSS Inc., Chicago, IL).
Results
Patient and Hospital Characteristics
From the NCDB, we identified 74 669 patients with a diagnosis of colon cancer in 1996–1997 and 82 120 with a diagnosis of colon cancer in 2004–2005 who underwent a colectomy and met the inclusion criteria for this study. For each time period, the records for patients were aggregated into a hospital-level file consisting of 1296 hospitals (Table 1). Of these hospitals, 32 (2.5%) were NCI–CCCs, 231 (18%) were other academic institutions (academic but not NCI–CCC), 49 (3.8%) were VA medical centers, and 984 (76%) were community hospitals. Hospital characteristics according to type and volume derived from data from patients in this study are described in Table 1.
Table 2.
Hospital-level median lymph node counts and 12-node performance rates: 1996–1997 versus 2004–2005*
| Lymph nodes examined, median (IQR) |
Hospital performance rate, % |
|||||||||
| 1996–1997 |
2004–2005 |
1996–1997 |
2004–2005 |
|||||||
| Median | IQR | Median | IQR | P value† | Median | IQR | Median | IQR | P value† | |
| All hospitals | 10 | 8.0–10.0 | 12.0* | 10.0–15.0 | <.001 | 39.8 | 40.7–66.9 | 53.8* | 26.1–53.6 | <.001 |
| Hospital type‡ | ||||||||||
| NCI–CCC | 11.5 | 10.0–14.0 | 16.0* | 14.5–20.0 | <.001 | 50.8 | 45.6–56.0 | 71.0* | 66.9–75.2 | <.001 |
| Other academic | 11 | 9.0–13.0 | 14.0* | 11.5–20.0 | <.001 | 47.2 | 45.1–49.3 | 60.9* | 58.7–63.1 | <.001 |
| VA | 8.5 | 6.0–10.0 | 13.0* | 10.0–16.5 | <.001 | 34.7 | 29.3–40.1 | 51.8* | 45.7–57.9 | <.001 |
| Community | 9 | 7.0–12.0 | 12.0* | 10.0–19.5 | <.001 | 38.0 | 36.8–39.2 | 51.7* | 50.4–53.0 | <.001 |
| Hospital volume quartiles | ||||||||||
| Highest volume | 10 | 9.0–13.0 | 14.0* | 12.0–16.0 | <.001 | 44.1 | 42.3–45.9 | 61.7* | 60.1–63.4 | <.001 |
| High volume | 10 | 8.0–12.0 | 12.0* | 10.0–15.5 | <.001 | 41.1 | 39.2–43.0 | 54.8* | 52.6–57.0 | <.001 |
| Moderate volume | 9 | 7.0–12.0 | 12.0* | 10.0–15.0 | <.001 | 38.2 | 36.0–40.3 | 53.1* | 50.9–55.3 | <.001 |
| Lowest volume | 9 | 7.0–11.0 | 11.0* | 9.0–13.5 | <.001 | 36.0 | 33.7–38.4 | 45.7* | 43.2–48.1 | <.001 |
Performance rate is the percentage of patients per hospital who had at least 12 nodes examined. IQR = interquartile range; NCI–CCC = National Cancer Institute Comprehensive Cancer Center; VA = Veterans’ Administration.
In comparison with 1996–1997 using Mann–Whitney test for median node counts and analysis of variance for performance rates.
NCI–CCCs are designated by the NCI. Other academic hospitals are designated as academic centers by the Commission on Cancer but do not include NCI–CCCs. VA hospitals include those facilities operated by the Veterans’ Health Administration. Community hospitals are designated by the Commission on Cancer as nonteaching/research institutions.
Table 1.
Hospitals and their colon cancer patient characteristics by hospital type and volume (2004–2005)*
| Hospital type † |
Hospital volume quartiles |
|||||||
| Variable | NCI–CCC | Other academic | VA | Community | Highest volume (>42 cases/y) | High volume (28–42 cases/y) | Moderate volume (17–27 cases/y) | Lowest volume (<17 cases/y) |
| No. of hospitals | 32 | 231 | 49 | 984 | 324 | 324 | 324 | 324 |
| Patient characteristics | ||||||||
| Female patients (%) | 51.8 | 52.4 | 2.3‡ | 52.5 | 52.4 | 51.9 | 50.1 | 47.7 |
| Median age (years) | 67.5 | 70.0 | 70.5‡ | 73.0‡ | 72.0 | 73.0 | 73.0 | 71.0‡ |
| Nonwhites (%) | 26.3 | 33.1‡ | 26.4 | 15.2‡ | 18.1 | 19.2 | 18.3 | 22.1‡ |
| Colon cancer characteristics | ||||||||
| Right side (%) | 62.0 | 59.0 | 56.0‡ | 60.4 | 61.3 | 60.3 | 60.0 | 58.6 |
| T1 (%) | 14.6 | 14.1 | 15.2 | 13.3 | 14.6 | 13.8 | 13.6 | 12.0‡ |
| T2 (%) | 17.1 | 17.3 | 21.9‡ | 18.4 | 17.9 | 18.2 | 18.4 | 18.7 |
| T3 (%) | 57.6 | 60.0 | 55.1 | 59.4 | 58.9 | 59.1 | 59.0 | 60.4 |
| T4 (%) | 10.7 | 8.5 | 7.8 | 9.0 | 8.8 | 8.9 | 8.9 | 8.9 |
| Poorly differentiated (%) | 20.9 | 17.3 | 13.2‡ | 18.1 | 19.5 | 18.8 | 17.7 | 15.4‡ |
Hospital characteristics derived from data from patients in this study. NCI–CCC = National Cancer Institute Comprehensive Cancer Center; VA = Veterans’ Administration.
NCI–CCC are designated by the NCI. Other academic hospitals are designated as academic centers by the Commission on Cancer but do not include NCI–CCCs. VA hospitals include those facilities operated by the Veterans’ Health Administration. Community hospitals are designated by the Commission on Cancer as nonteaching/research institutions.
P < .05 in comparison with NCI–CCCs or highest volume hospitals using analysis of variance for mean percentages and Mann–Whitney for medians.
Change in Nodal Evaluation Over Time
The median number of nodes examined was calculated for all hospitals and by institution type and volume (Table 2). The median number of nodes examined per hospital increased from 10 in 1996–1997 to 12 in 2004–2005 (P < .001). Increases in the median number of nodes examined were seen irrespective of hospital type and volume, with the largest absolute median increase observed for NCI–CCCs and VA hospitals (increase = 4.5 nodes for both NCI–CCCs [from 11.5 to 16 nodes] and VA hospitals [from 8.5 to 13 nodes]).
Hospital performance rates were calculated with respect to the 12-node measure as the proportion of patients per hospital who had at least 12 nodes examined (Table 2). From 1996–1997 to 2004–2005, the mean hospital performance rate in the United States increased from 39.8% to 53.8% (P < .001 based on t test). An increase was observed in NCI–CCCs, other academic institutions, VA hospitals, and community hospitals, as well as for all hospital volume quartiles. The largest absolute increase in performance rates was observed for NCI–CCCs (20.2%, Table 2), and the smallest absolute increase was observed for community hospitals (13.7%). From 1996–1997 to 2004–2005, 12-node measure performance increased at 980 hospitals, remained unchanged at 6 hospitals, and decreased at 310 hospitals.
Based on the statistically derived benchmark for hospital performance, a hospital was considered compliant with the 12-node measure if at least 12 nodes were examined in 75% or more of patients. A hospital was considered statistically compliant if the upper limit of the 95% CI for the estimate of performance was greater than or equal to 75%. In 1996–1997, 51 hospitals (3.9%) were compliant with the 12-node measure and 195 hospitals (15.0%) were statistically compliant with the measure (Figure 1, A, Table 3). In 2004–2005, 222 hospitals (17.5%) were compliant with the 12-node measure and 504 hospitals (38.9%) were statistically compliant (Figure 1, B, Table 3). From 1996–1997 to 2004–2005, 282 hospitals (21.8%) improved their performance enough to become statistically compliant with the 12-node measure.
Figure 1.
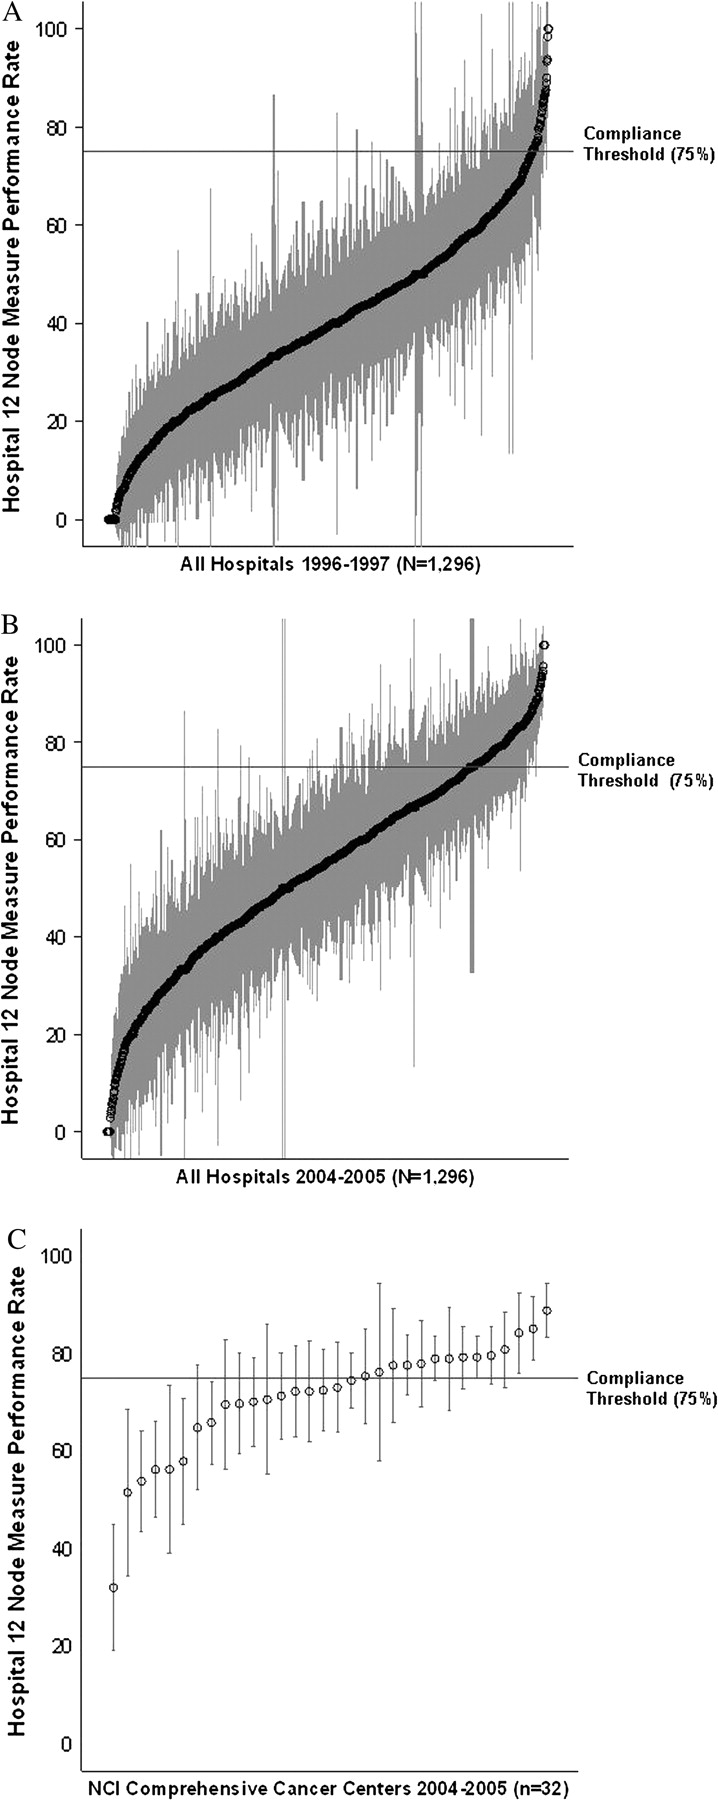
Hospital 12-node measure performance. Dots and gray bars represent estimates for percentage of patients with 12 or more nodes examined in a given hospital, with 95% confidence intervals. The horizontal line represents the 75% benchmark for compliance. A) All hospitals, 1996–1997. B) All hospitals, 2004–2005. C) National Cancer Institute–designated Comprehensive Cancer Centers, 2004–2005.
Table 3.
Hospital-level compliance with the 12-node measure: 1996–1997 versus 2004–2005*
| Compliant hospitals † |
Statistically compliant hospitals ‡ |
|||
| Hospitals | 1996–1997, No. (%) | 2004–2005, No. (%) | 1996–1997, No. (%) | 2004–2005, No. (%) |
| All hospitals | 51 (3.9) | 222 (17.1) | 195 (15.0) | 504 (38.9) |
| Hospital type | ||||
| NCI–CCC | 1 (3.1) | 14 (43.8) | 5 (15.6) | 25 (78.1) |
| Other academic | 11 (4.8) | 54 (23.4) | 39 (16.9) | 121 (52.4) |
| VA | 1 (2.0) | 6 (12.2) | 11 (22.4) | 26 (53.1) |
| Community | 38 (3.9) | 148 (15.0) | 140 (14.2) | 332 (33.7) |
| Hospital volume (quartiles) | ||||
| Highest volume | 15 (4.6) | 72 (22.2) | 26 (8.0) | 140 (43.2) |
| High volume | 8 (2.5) | 61 (18.8) | 35 (10.8) | 116 (35.8) |
| Moderate volume | 13 (4.0) | 54 (16.7) | 49 (15.1) | 130 (40.1) |
| Lowest volume | 15 (4.6) | 35 (10.8) | 85 (26.2) | 118 (36.4) |
NCI–CCCs are designated by the NCI. Other academic hospitals are designated as academic centers by the Commission on Cancer, but do not include NCI–CCCs. VA hospitals include those facilities operated by the Veterans’ Health Administration. Community hospitals are designated by the Commission on Cancer as nonteaching/research institutions. NCI–CCC = National Cancer Institute Comprehensive Cancer Center; VA = Veterans’ Administration.
Estimate of hospital performance rate (ie, percentage of patients with 12 or more nodes examined) is at least 75%.
Upper limit of the 95% confidence interval for estimate of hospital performance rate is at least 75%.
Figure 2.

Change in individual hospitals’ performance rates with the 12-node measure from 1996–1997 to 2004–2005 at National Cancer Institute–designated Comprehensive Cancer Centers (NCI–CCCs). Each gray circle represents one of the 32 (NCI–CCCs) in this study.
In 1996–1997, statistical compliance with the 12-node measure was observed at 15.6% of NCI–CCCs, 16.9% of other academic institutions, 22.4% of VA centers, and 14.2% of community hospitals. In 2004–2005, 78.1% of NCI–CCCs, 52.4% of other academic institutions, 53.1% VA centers, and 33.7% of community hospitals were statistically complaint (P < .001 for all hospital types in comparison with NCI–CCCs [Figure 1, C] based on chi-square tests), and corresponding absolute differences between the two time periods were 62.5%, 35.5%, 30.7%, and 19.5%, respectively. The absolute improvement in the proportion of compliant hospitals was 21.0% at highest volume, 17.0% at high-volume, 23.4% at moderate-volume, and 15.6% at low-volume hospitals (Table 3).
Factors Associated With Compliance
A multivariable logistic regression model was developed to examine the association of hospital factors and statistical compliance with the 12-node measure while adjusting for differences in hospital colon cancer patient populations (Table 4). Hospital type was the factor most strongly associated with statistical compliance. Compared with community hospitals, NCI–CCCs (RR = 2.22, 95% CI = 1.65 to 2.60), other academic institutions (RR = 1.53, 95% CI = 1.30 to 1.75), and VA hospitals (RR = 1.90, 95% CI = 1.27 to 2.40) were more likely to be statistically compliant with the 12-node measure. Average annual hospital colectomy volume was also examined, but volume was not statistically significantly associated with 12-node measure compliance, either as a continuous or as a categorical variable (Table 4, Figure 3).
Table 4.
Hospital factors associated with 12-node measure statistical compliance (2004–2005)*
| Unadjusted RR (95% CI) | P value | Adjusted RR† (95% CI) | P value | |
| Hospital type‡ | ||||
| NCI–CCC | 2.32 (1.79 to 2.65) | <.001 | 2.22 (1.65 to 2.60) | <.001 |
| Other academic | 1.55 (1.34 to 1.76) | <.001 | 1.53 (1.30 to 1.75) | <.001 |
| VA | 1.57 (1.15 to 1.98) | .007 | 1.90 (1.27 to 2.40) | .005 |
| Community | 1.00 (referent) | 1.00 (referent) | ||
| Hospital volume (quartiles) | ||||
| Highest volume | 1.19 (0.98 to 1.40) | .078 | 1.21 (0.99 to 1.44) | .056 |
| High volume | 0.98 (0.79 to 1.19) | .87 | 1.02 (0.82 to 1.24) | .85 |
| Moderate volume | 1.10 (0.90 to 1.32) | .33 | 1.16 (0.94 to1.38) | .15 |
| Low volume | 1.00 (referent) | 1.00 (referent) |
Hospitals were considered statistically compliant if the upper limit of the 95% confidence interval of the estimate of their performance rate (proportion of patients with 12 or more nodes examined) was greater than or equal to 75%. RR = relative risk; CI = confidence interval; NCI–CCC = National Cancer Institute Comprehensive Cancer Center; VA = Veterans’ Administration.
Multivariable logistic regression model evaluating the association between hospital type/volume and compliance with the 12-node measure while adjusting for sex, age, race/ethnicity, lesion location along the colon, T classification, and tumor grade. Hospital type and hospital volume were examined in separate models. Relative risk >1.0 indicates a higher likelihood of compliance with the 12-node measure.
NCI–CCCs are designated by the NCI. Other academic hospitals are designated as academic centers by the Commission on Cancer, but do not include NCI–CCCs. VA hospitals include those facilities operated by the Veterans’ Health Administration. Community hospitals are designated by the Commission on Cancer as nonteaching/research institutions.
Figure 3.

Scatterplot showing relationship between annual average colectomy volume and hospital 12-node measure performance.
The expected values for performance (ie, the predicted rate of examination of at least 12 nodes) from the regression model were used to assess compliance with the 12-node measure. Adjustment for differences in colorectal cancer patient populations between hospitals did not result in any additional hospitals becoming compliant with the 12-node measure (the expected value for performance did not increase above the compliance threshold for any hospital). Moreover, the expected values were relatively unaffected for all hospitals by adjustment for patient characteristics (data not shown).
Discussion
In examining treatment of colon cancer patients who underwent colectomy at 1296 hospitals using data from the NCDB, we found that although the proportion of compliant hospitals (those that examined at least 12 lymph nodes in at least 75% of patients) increased considerably from 1996–1997 to 2004–2005, the majority of hospitals failed to comply with the 12-node measure. To our knowledge, this is the first study to examine the 12-node measure at the hospital level and provide a hospital report card for regional lymph node evaluation for colon cancer in the United States.
Prior studies conducted at the level of individual patients have demonstrated that only approximately 37% to 50% of colon cancer patients in the United States have 12 or more nodes examined (21,34). At the hospital level, we found that the overall performance rate (proportion of patients at a hospital who had at least 12 nodes examined) increased by a statistically significant extent from 1996–1997 to 2004–2005. This increase was observed regardless of hospital type or volume. This improvement is presumably due to multiple factors that have increased awareness of the importance of lymph node examination for colon cancer. Nodal evaluation is likely to improve further with the recent development of a 12-node measure by multiple national oncology organizations and as physicians and hospitals recognize that a requirement to examine 12 or more nodes may affect referral and reimbursement.
The primary objective of this study was to determine the number of hospitals that are compliant with the 12-node measure. We considered a hospital statistically compliant if the upper limit of the 95% CI for the estimate of its performance was greater than or equal to 75% to preclude categorizing hospitals as noncompliant simply based on statistical variation. The percentage of statistically compliant hospitals increased from 15.0% in 1996–1997 to 38.9% in 2004–2005. Overall, national compliance with a 12-node measure remains low, possibly because some question whether the 12-node measure is important for staging and is an indicator of hospital quality. However, the increase in performance over time, particularly at NCI–CCCs, is encouraging and demonstrates that improved compliance with the 12-node measure is feasible.
In examining the association of hospital factors with compliance with the 12-node measure, we found that the rate of statistical compliance for NCI–CCCs (78%) was higher than that for other hospital types. Previous studies have shown that colon cancer patients treated at high-volume specialized cancer centers have better long-term outcomes (eg, recurrence and survival) than those treated at low-volume community hospitals (35,36). Better lymph node examination rates at NCI–CCCs and other academic hospitals may in part explain this disparity.
Because hospitals care for varying proportions of elderly patients and those with left-sided tumors, both of which are associated with lower nodal counts, it has been suggested (37) that a 12-node measure that compares hospitals must adjust for differences in the patient populations at various hospitals and hospital types. To examine the effect of patient characteristics on the rate of lymph node examination, the predicted rates were calculated as a function of the multivariable logistic regression model. We found that patient characteristics did not affect the proportion of hospitals meeting the compliance benchmark. Thus, these differences among hospitals do not appreciably affect evaluation of compliance rates, and comparing hospitals without adjustment for case mix is likely appropriate. Moreover, adjustment for differences in patient populations is, in principle, not needed for process measures, because adherence with the measure is either met or not met.
The large number of hospitals in the United States that are not compliant with the 12-node measure may indicate to some that 12 lymph nodes is not an appropriate threshold for a quality indicator for colon cancer because it is either not attainable or unimportant. The rate of adherence with a requirement to evaluate 12 regional lymph nodes is dependent on the extent of surgical resection, the thoroughness of pathological examination, and multiple patient factors (38–40). However, large institutions and entire geographic areas have been able to dramatically improve nodal examination rates for colon cancer. In a study of eight NCCN hospitals, Rajput et al. (41) found that during 2005–2006, 89% of colectomy patients had 12 or more nodes examined. Similarly, emphasizing the importance of nodal evaluation has resulted in a substantial improvement in lymph node examination in the Canadian province of Ontario (42). If large institutions or an entire province can improve lymph node examination rates, then it is likely that evaluation of 12 nodes is a reasonable benchmark for colon cancer, and increasing awareness of the importance of nodal evaluation through multidisciplinary initiatives can improve lymph node examination for colon cancer.
Hospital-specific performance for the 12-node measure will be reported to all 1450 individual facilities currently reporting to the NCDB. The reporting process is meant to increase awareness of the importance of adequate nodal evaluation and allow institutions to privately compare their performance with a large national sample of hospitals. Hospitals with outlying nodal evaluation rates can be identified and notified so that these centers can initiate internal quality improvement initiatives.
The potential limitations of this study should be noted. First, there is considerable statistical variation in 12-node measure performance rates among extremely low-volume hospitals, and an argument could be made to exclude hospitals that performed a small number of colectomies per year. However, when we excluded very low–volume hospitals, the proportion of compliant hospitals did not change substantially (data not shown). Second, only hospitals approved by the CoC report to the NCDB. These hospitals may exhibit a higher level of specialization than institutions that are not approved by the CoC. Thus, if all hospitals in the United States were examined, the differences in 12-node measure compliance between NCI–CCCs and community hospitals would likely be augmented. Finally, the benchmark for compliance of 75% was derived statistically by calculating the mean performance rate of hospitals in the top quartile of lymph node examination rates in 2004–2005. Some have suggested that the quality threshold should be the performance rate of the hospitals in the 90th percentile (43). Although there are numerous methods to derive quality benchmarks, 75% serves as a statistically derived, conservative, and achievable starting point. Establishment of a benchmark should be considered an iterative process as hospitals improve and science progresses.
This study presents a hospital report card for regional lymph node examination for colon cancer in the United States. Nearly two-thirds of hospitals failed to meet the benchmark for compliance with the measure in 2004–2005. Considerable improvement in lymph node examination rates is needed, irrespective of hospital type. The measure may be used to assess physicians and/or hospital performance in the future, and a surveillance period will allow hospitals to focus on the issue and improve their performance before they may be held accountable. The 12-node measure offers an opportunity to improve the quality of care for colon cancer patients in the United States.
Funding
American College of Surgeons, Clinical Scholars in Residence program (to K.Y.B.); American Cancer Society (ACS IRG 93-037-12 to D.J.B.); National Cancer Institute (NCI-60058-NE to C.Y.K.).
Footnotes
The funding sources had no role in the design of the study; the collection, analysis, and interpretation of the data; the decision to submit the manuscript for publication; and the writing of the manuscript.
References
- 1.Jemal A, Siegel R, Ward E, et al. Cancer statistics, 2008. CA Cancer J Clin. 2008;58(2):71–96. doi: 10.3322/CA.2007.0010. [DOI] [PubMed] [Google Scholar]
- 2.Dukes C. The classification of cancer of the rectum. J Pathol Bacteriol. 1932;25:325–332. [Google Scholar]
- 3.Benson AB III. New approaches to the adjuvant therapy of colon cancer. Oncologist. 2006;11(9):973–980. doi: 10.1634/theoncologist.11-9-973. [DOI] [PubMed] [Google Scholar]
- 4.Berger AC, Sigurdson ER, LeVoyer T, et al. Colon cancer survival is associated with decreasing ratio of metastatic to examined lymph nodes. J Clin Oncol. 2005;23(34):8706–8712. doi: 10.1200/JCO.2005.02.8852. [DOI] [PubMed] [Google Scholar]
- 5.Caplin S, Cerottini JP, Bosman FT, Constanda MT, Givel JC. For patients with Dukes’ B (TNM Stage II) colorectal carcinoma, examination of six or fewer lymph nodes is related to poor prognosis. Cancer. 1998;83(4):666–672. [PubMed] [Google Scholar]
- 6.Chen SL, Bilchik AJ. More extensive nodal dissection improves survival for stages I to III of colon cancer: a population-based study. Ann Surg. 2006;244(4):602–610. doi: 10.1097/01.sla.0000237655.11717.50. [DOI] [PMC free article] [PubMed] [Google Scholar]
- 7.Cianchi F, Palomba A, Boddi V, et al. Lymph node recovery from colorectal tumor specimens: recommendation for a minimum number of lymph nodes to be examined. World J Surg. 2002;26(3):384–389. doi: 10.1007/s00268-001-0236-8. [DOI] [PubMed] [Google Scholar]
- 8.Cserni G, Vinh-Hung V, Burzykowski T. Is there a minimum number of lymph nodes that should be histologically assessed for a reliable nodal staging of T3N0M0 colorectal carcinomas? J Surg Oncol. 2002;81(2):63–69. doi: 10.1002/jso.10140. [DOI] [PubMed] [Google Scholar]
- 9.Goldstein NS. Lymph node recoveries from 2427 pT3 colorectal resection specimens spanning 45 years: recommendations for a minimum number of recovered lymph nodes based on predictive probabilities. Am J Surg Pathol. 2002;26(2):179–189. doi: 10.1097/00000478-200202000-00004. [DOI] [PubMed] [Google Scholar]
- 10.Johnson PM, Porter GA, Ricciardi R, Baxter NN. Increasing negative lymph node count is independently associated with improved long-term survival in stage IIIB and IIIC colon cancer. J Clin Oncol. 2006;24(22):3570–3575. doi: 10.1200/JCO.2006.06.8866. [DOI] [PubMed] [Google Scholar]
- 11.Le Voyer TE, Sigurdson ER, Hanlon AL, et al. Colon cancer survival is associated with increasing number of lymph nodes analyzed: a secondary survey of intergroup trial INT-0089. J Clin Oncol. 2003;21(15):2912–2919. doi: 10.1200/JCO.2003.05.062. [DOI] [PubMed] [Google Scholar]
- 12.Prandi M, Lionetto R, Bini A, et al. Prognostic evaluation of stage B colon cancer patients is improved by an adequate lymphadenectomy: results of a secondary analysis of a large scale adjuvant trial. Ann Surg. 2002;235(4):458–463. doi: 10.1097/00000658-200204000-00002. [DOI] [PMC free article] [PubMed] [Google Scholar]
- 13.Swanson RS, Compton CC, Stewart AK, Bland KI. The prognosis of T3N0 colon cancer is dependent on the number of lymph nodes examined. Ann Surg Oncol. 2003;10(1):65–71. doi: 10.1245/aso.2003.03.058. [DOI] [PubMed] [Google Scholar]
- 14.Chang GJ, Rodriguez-Bigas MA, Skibber JM, Moyer VA. Lymph node evaluation and survival after curative resection of colon cancer: systematic review. J Natl Cancer Inst. 2007;99(6):433–441. doi: 10.1093/jnci/djk092. [DOI] [PubMed] [Google Scholar]
- 15.Joseph NE, Sigurdson ER, Hanlon AL, et al. Accuracy of determining nodal negativity in colorectal cancer on the basis of the number of nodes retrieved on resection. Ann Surg Oncol. 2003;10(3):213–218. doi: 10.1245/aso.2003.03.059. [DOI] [PubMed] [Google Scholar]
- 16.National Comprehensive Cancer Network (NCCN) ASCO/NCCN Quality Measures: Breast and Colorectal Cancers. http://www.nccn.org/professionals/quality_measures/default.asp. Accessed April 26, 2007. [Google Scholar]
- 17.American Joint Committee on Cancer. Cancer Staging Manual. 5th ed. Chicago, IL: Springer; 1997. [Google Scholar]
- 18.Hammond ME, Fitzgibbons PL, Compton CC. College of American Pathologists Conference XXXV: solid tumor prognostic factors-which, how and so what? Summary document and recommendations for implementation. Cancer Committee and Conference Participants. Arch Pathol Lab Med. 2000;124(7):958–965. doi: 10.5858/2000-124-0958-COAPCX. [DOI] [PubMed] [Google Scholar]
- 19.Nelson H, Petrelli N, Carlin A, et al. Guidelines 2000 for colon and rectal cancer surgery. J Natl Cancer Inst. 2001;93(8):583–596. doi: 10.1093/jnci/93.8.583. [DOI] [PubMed] [Google Scholar]
- 20.National Comprehensive Cancer Network (NCCN). Clinical Practice Guidelines in Oncology: Colon Cancer Version 1. 2008 doi: 10.6004/jnccn.2009.0056. [DOI] [PubMed] [Google Scholar]
- 21.Baxter NN, Virnig DJ, Rothenberger DA, Morris AM, Jessurun J, Virnig BA. Lymph node evaluation in colorectal cancer patients: a population-based study. J Natl Cancer Inst. 2005;97(3):219–225. doi: 10.1093/jnci/dji020. [DOI] [PubMed] [Google Scholar]
- 22.Bilimoria KY, Stewart AK, Palis BE, Bentrem DJ, Talamonti MS, Ko CY. Adequacy and importance of lymph node evaluation for colon cancer in the elderly. J Am Coll Surg. 2008;206(2):247–254. doi: 10.1016/j.jamcollsurg.2007.07.044. [DOI] [PubMed] [Google Scholar]
- 23.Wong SL, Ji H, Hollenbeck BK, Morris AM, Baser O, Birkmeyer JD. Hospital lymph node examination rates and survival after resection for colon cancer. JAMA. 2007;298(18):2149–2154. doi: 10.1001/jama.298.18.2149. [DOI] [PubMed] [Google Scholar]
- 24.Bilimoria KY, Stewart AK, Edge S, Ko CY. Lymph node examination rate, survival rate, and quality of care in colon cancer. JAMA. 2008;299(8):896–897. doi: 10.1001/jama.299.8.896-a. [DOI] [PubMed] [Google Scholar]
- 25.Peters E, Nagtegaal I, van de Velde C, Krieken J. Lymph node examination rate, survival rate, and quality of care in colon cancer. JAMA. 2008;299(8):896–897. doi: 10.1001/jama.299.8.896-b. [DOI] [PubMed] [Google Scholar]
- 26.American Society of Clinical Oncology (ASCO) ASCO-NCCN Quality Measures. http://www.asco.org/portal/site/ASCO/menuitem.5d1b4bae73a9104ce277e89a320041a0/?vgnextoid = 1b08fcd4eb46c010VgnVCM100000ed730ad1RCRD. Accessed April 26, 2007. [Google Scholar]
- 27.Commission on Cancer (CoC) National Quality Forum Endorsed Commission on Cancer Measures for Quality of Cancer Care for Breast and Colorectal Cancers. http://www.facs.org/cancer/qualitymeasures.html. Accessed April 26, 2007. [Google Scholar]
- 28.National Quality Forum Endorses Consensus Standards for Diagnosis and Treatment of Breast & Colorectal Cancer. http://216.122.138.39/pdf/news/prbreast-colon03-12-07.pdf. Accessed December 27, 2007. [Google Scholar]
- 29.Bilimoria KY, Stewart AK, Winchester DP, Ko CY. The National Cancer Data Base: a powerful initiative to improve cancer care in the United States. Ann Surg Oncol. 2008;15(3):683–690. doi: 10.1245/s10434-007-9747-3. [DOI] [PMC free article] [PubMed] [Google Scholar]
- 30.Standards of the Commission on Cancer Volume II: Registry Operations and Data Standards. 1998 Commission on Cancer. [Google Scholar]
- 31.Facility Oncology Registry Data Standards. Chicago, IL: Commission on Cancer; 2004. [Google Scholar]
- 32.Commission on Cancer: Program Standards. Chicago, IL: American College of Surgeons; 2006. [Google Scholar]
- 33.Zhang J, Yu KF. What's the relative risk? A method of correcting the odds ratio in cohort studies of common outcomes. JAMA. 1998;280(19):1690–1691. doi: 10.1001/jama.280.19.1690. [DOI] [PubMed] [Google Scholar]
- 34.Bilimoria KY, Palis B, Stewart AK, et al. Impact of tumor location on nodal evaluation for colon cancer. Dis Colon Rectum. 2008;51(2):154–161. doi: 10.1007/s10350-007-9114-2. [DOI] [PubMed] [Google Scholar]
- 35.Schrag D, Cramer LD, Bach PB, Cohen AM, Warren JL, Begg CB. Influence of hospital procedure volume on outcomes following surgery for colon cancer. JAMA. 2000;284(23):3028–3035. doi: 10.1001/jama.284.23.3028. [DOI] [PubMed] [Google Scholar]
- 36.Rogers SO, Jr, Wolf RE, Zaslavsky AM, Wright WE, Ayanian JZ. Relation of surgeon and hospital volume to processes and outcomes of colorectal cancer surgery. Ann Surg. 2006;244(6):1003–1011. doi: 10.1097/01.sla.0000231759.10432.a7. [DOI] [PMC free article] [PubMed] [Google Scholar]
- 37.Baxter N, Rosen L. Open letter to the National Quality Forum regarding the 12 Node Measure on behalf of the American Society Colon and Rectal Surgeons. 2007 http:// www.qualityforum.org/pdf/cancer. Accessed March 13, 2008. [Google Scholar]
- 38.Rieger NA, Barnett FS, Moore JW, et al. Quality of pathology reporting impacts on lymph node yield in colon cancer. J Clin Oncol. 2007;25(4):463. doi: 10.1200/JCO.2006.09.2304. author reply 463–464. [DOI] [PubMed] [Google Scholar]
- 39.Simunovic M, Baxter NN. Lymph node counts in colon cancer surgery: lessons for users of quality indicators. JAMA. 2007;298(18):2194–2195. doi: 10.1001/jama.298.18.2194. [DOI] [PubMed] [Google Scholar]
- 40.Ostadi MA, Harnish JL, Stegienko S, Urbach DR. Factors affecting the number of lymph nodes retrieved in colorectal cancer specimens. Surg Endosc. 2007;21(12):2142–2146. doi: 10.1007/s00464-007-9414-6. [DOI] [PubMed] [Google Scholar]
- 41.Rajput A, Skibber JM, Engstrom PF, et al. Meeting the 12 lymph node benchmark in colorectal cancer surgery: a comparison of NCCN and SEER data. J Clin Oncol. 2007;25(18S):4015. [Google Scholar]
- 42.Cancer Care Ontario. http://www.cancercare.on.ca/. Accessed May 23, 2007. [Google Scholar]
- 43.Weissman NW, Allison JJ, Kiefe CI, et al. Achievable benchmarks of care: the ABCs of benchmarking. J Eval Clin Pract. 1999;5(3):269–281. doi: 10.1046/j.1365-2753.1999.00203.x. [DOI] [PubMed] [Google Scholar]